
記住我

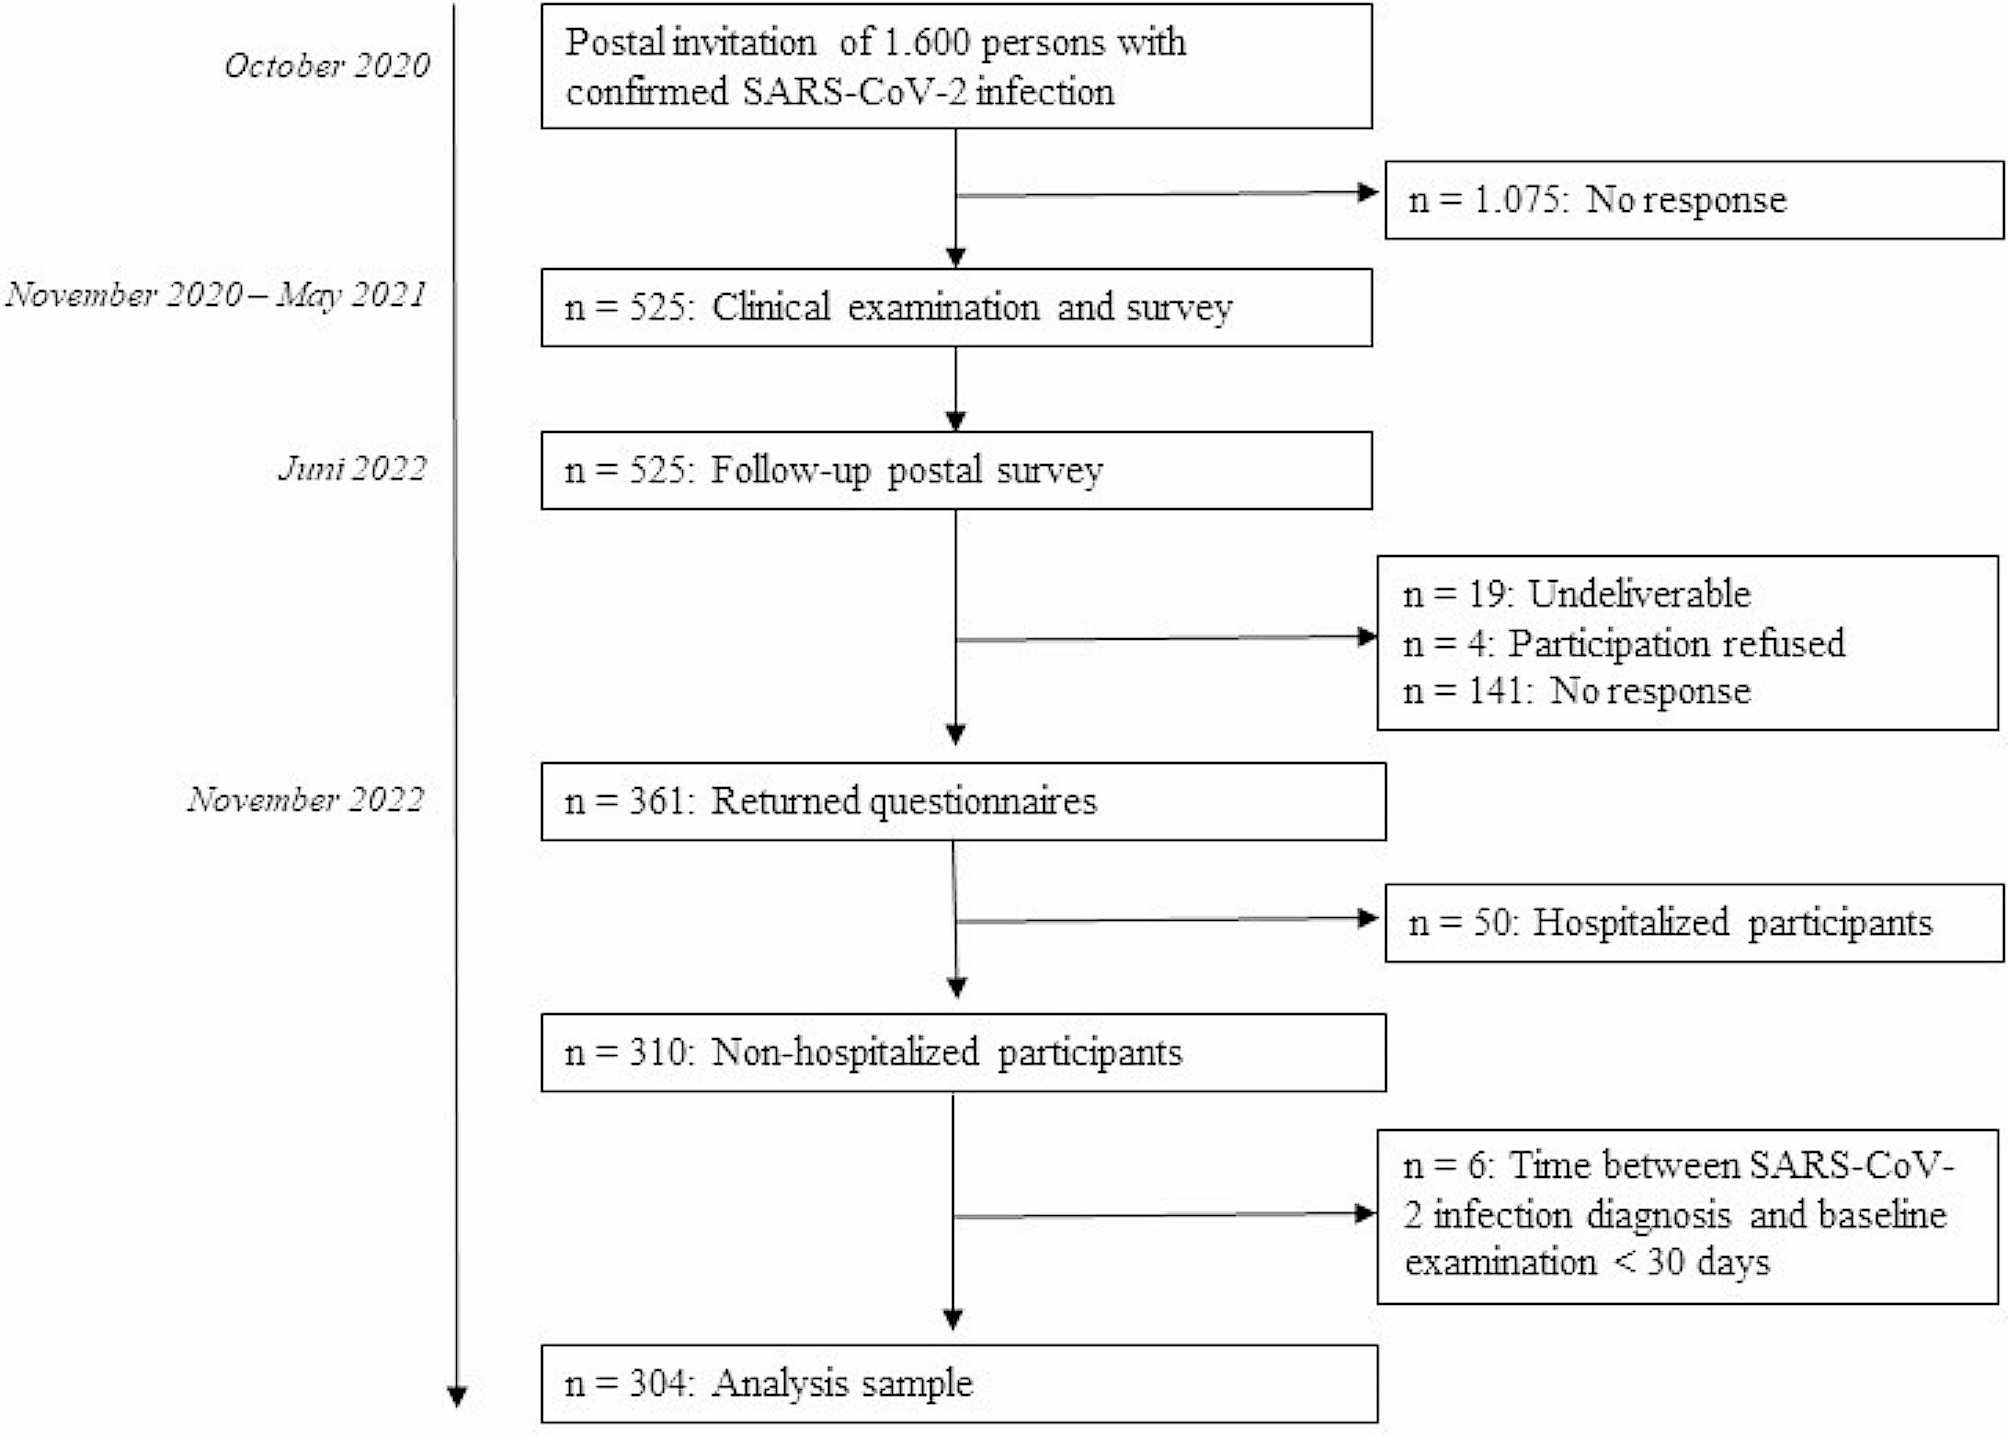
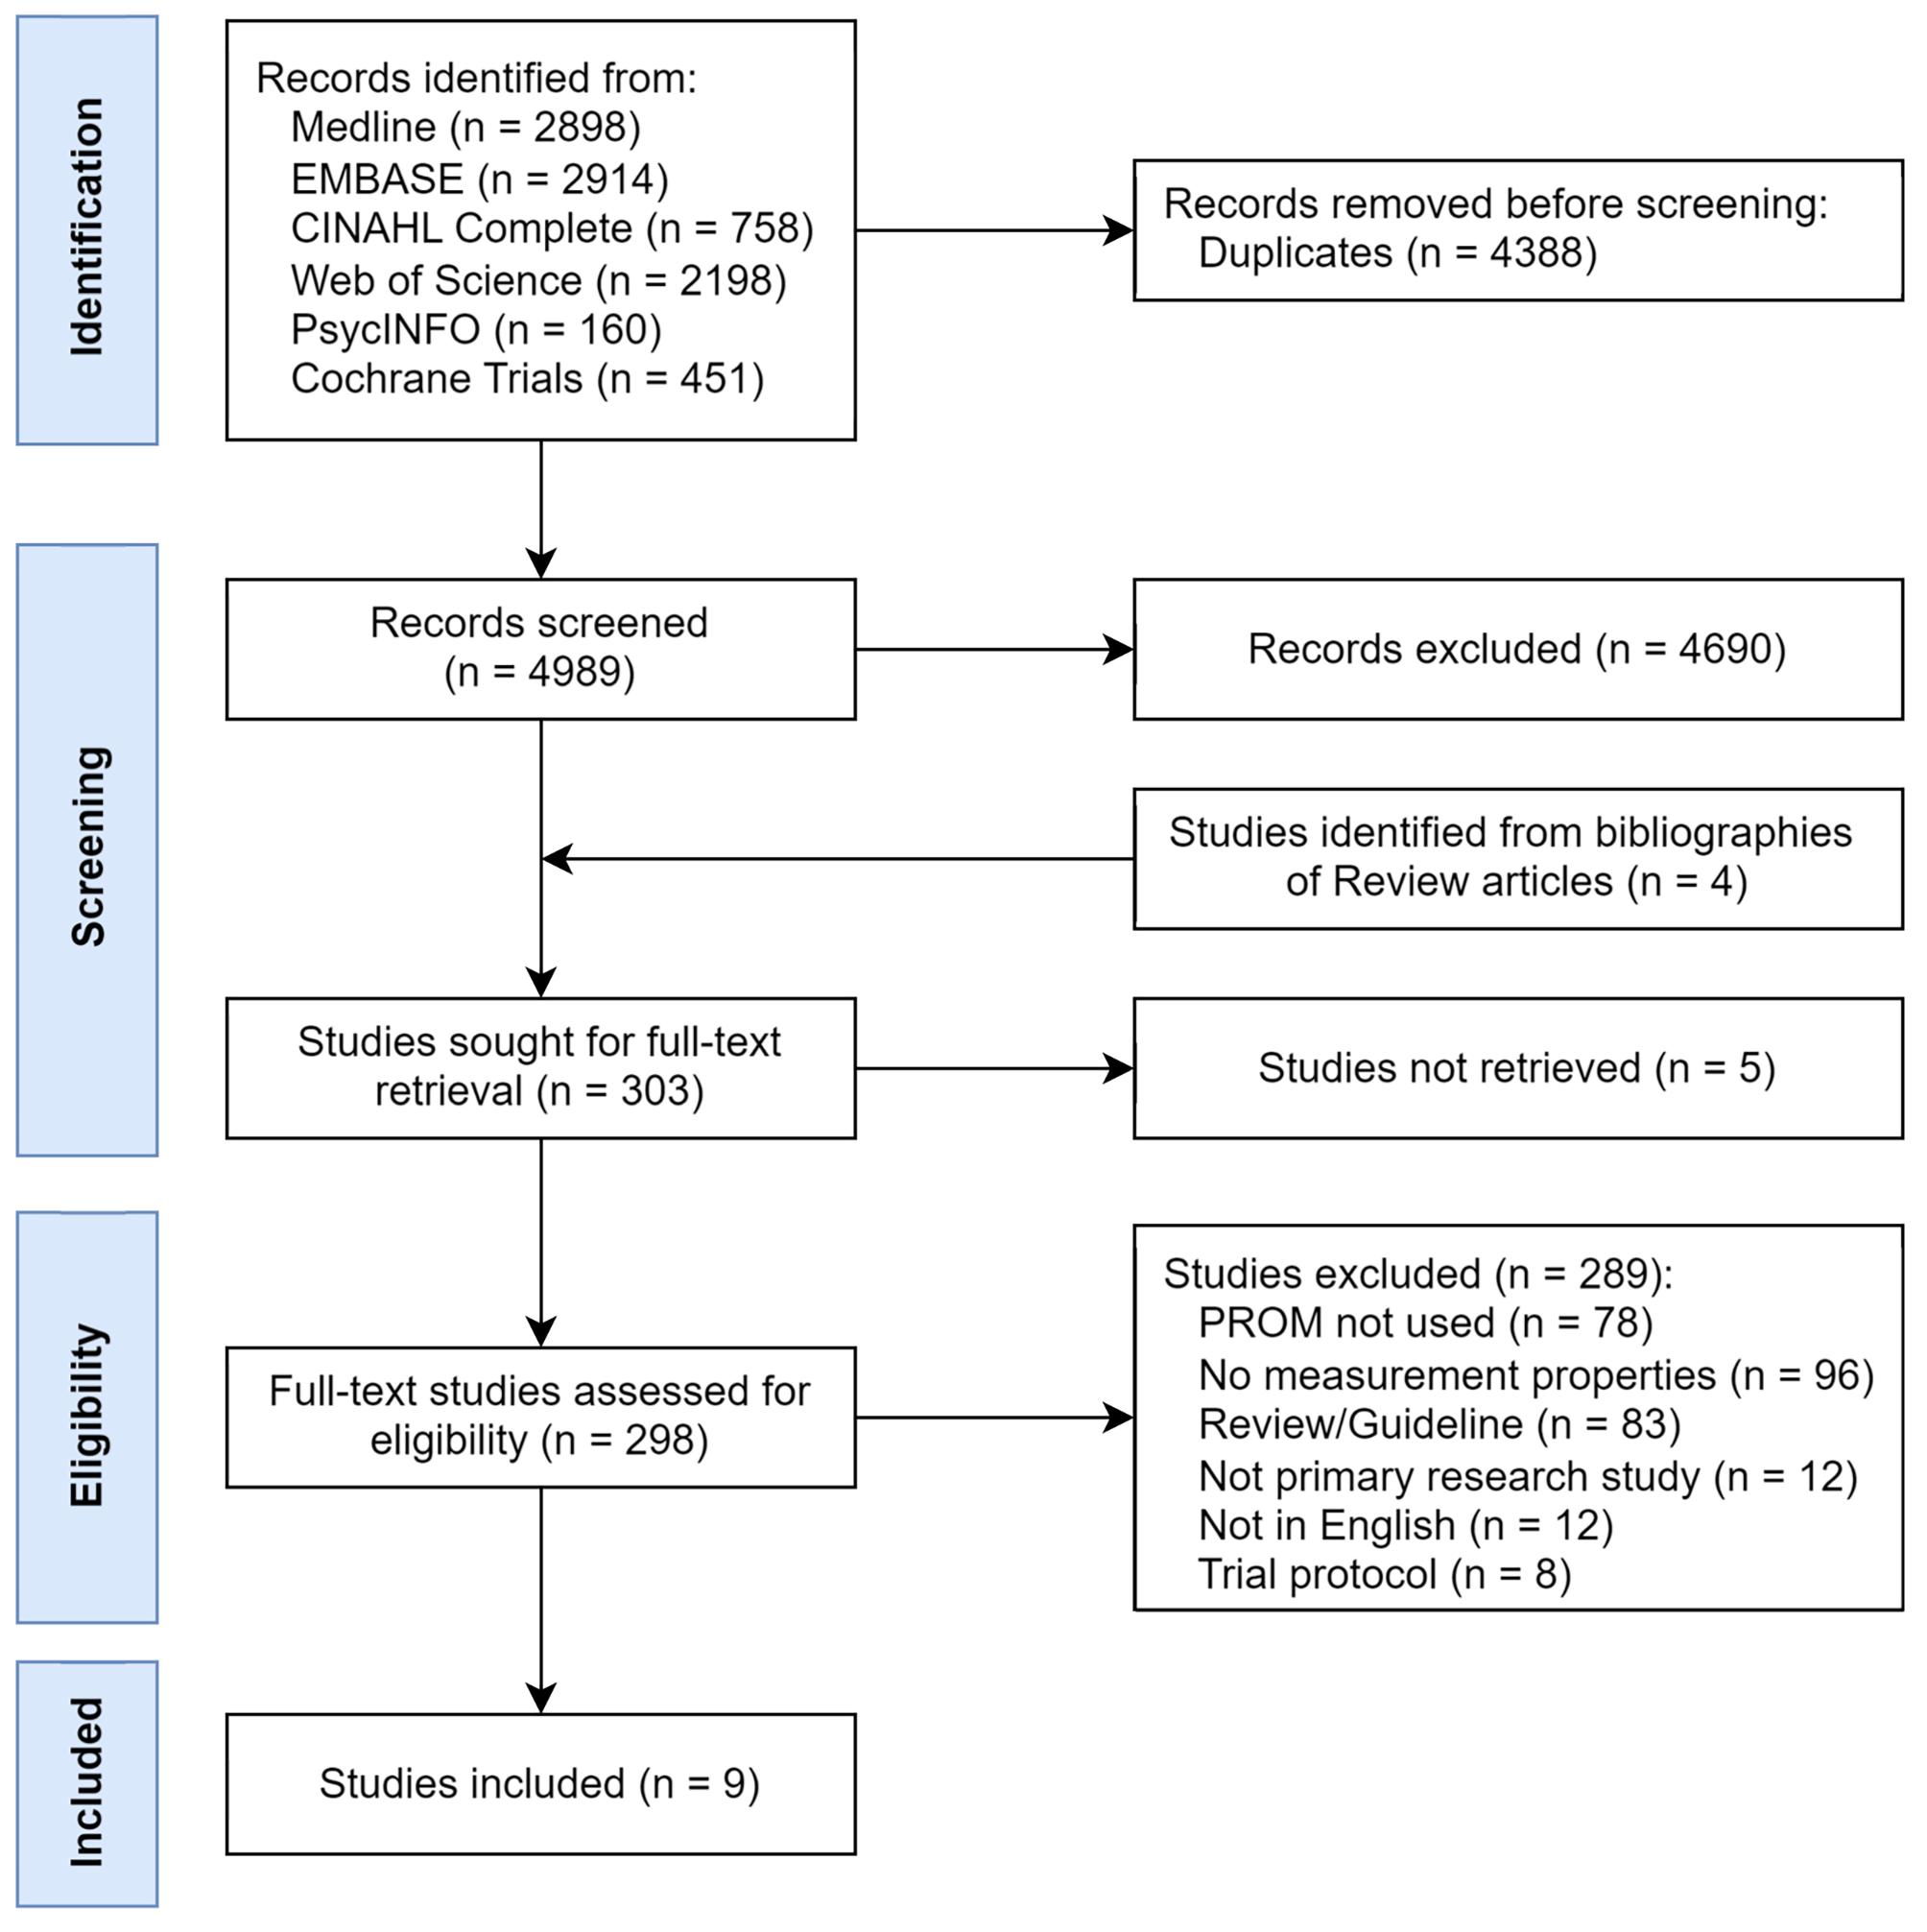
This study was designed as a multi-center, prospective cohort study. The checklist of items for TRIPOD statement of this study was shown in Table S1. Patients from three medical centers in Shanxi Province of People’s Republic of China were enrolled between July 1, 2017 and June 30, 2019. A total of 1011 patients hospitalized for CHF were enrolled in the study. Among them, 1003 (99.21%) patients completed the CHF-PROM, and 941 (93.08%) of them attended the follow-up examinations. The flow diagram is shown in Fig. 1.
Fig. 1
Eligibility requirements included only patients who were diagnosed with HF according to the ESC guideline [1] and classified as functional class II-IV according to the New York Heart Association (NYHA). Patients who had suffered acute cardiovascular events two months prior to enrolment or were not able to complete the questionnaire owing to intellectual disabilities were excluded. All subjects provided informed consent for inclusion before they participated in the study. The study was conducted in accordance with the Declaration of Helsinki, and the protocol was approved by Institutional Review Board of Shanxi Medical University.
MeasuresGeneral information and PROs of patients were collected during hospitalization. All participants who reported PROs were followed-up after discharge at 1, 3, and every 6 months thereafter by telephone to obtain the information on outcomes. To guarantee the quality of the data collected, all questionnaires were collected by professionally trained individuals.
General informationThe following demographic and clinical information were collected as general information in our study: age, sex, body mass index (BMI), occupation, level of education, health insurance, history of smoking and alcohol drinking, family history, blood pressure, heart rate, NYHA class, and severe comorbidities.
The following points were considered when collecting the general information:
Health insurance was classified as either urban or rural health insurance in our study based on the national policies of the People’s Republic of China. Urban health insurance covers about 80% of hospitalization expenses, whereas rural health insurance covers only 60%.
Comorbidities included coronary heart disease, valvular heart disease, hypertension, diabetes mellitus, atrial fibrillation, chronic obstructive pulmonary disease, and renal insufficiency [1].
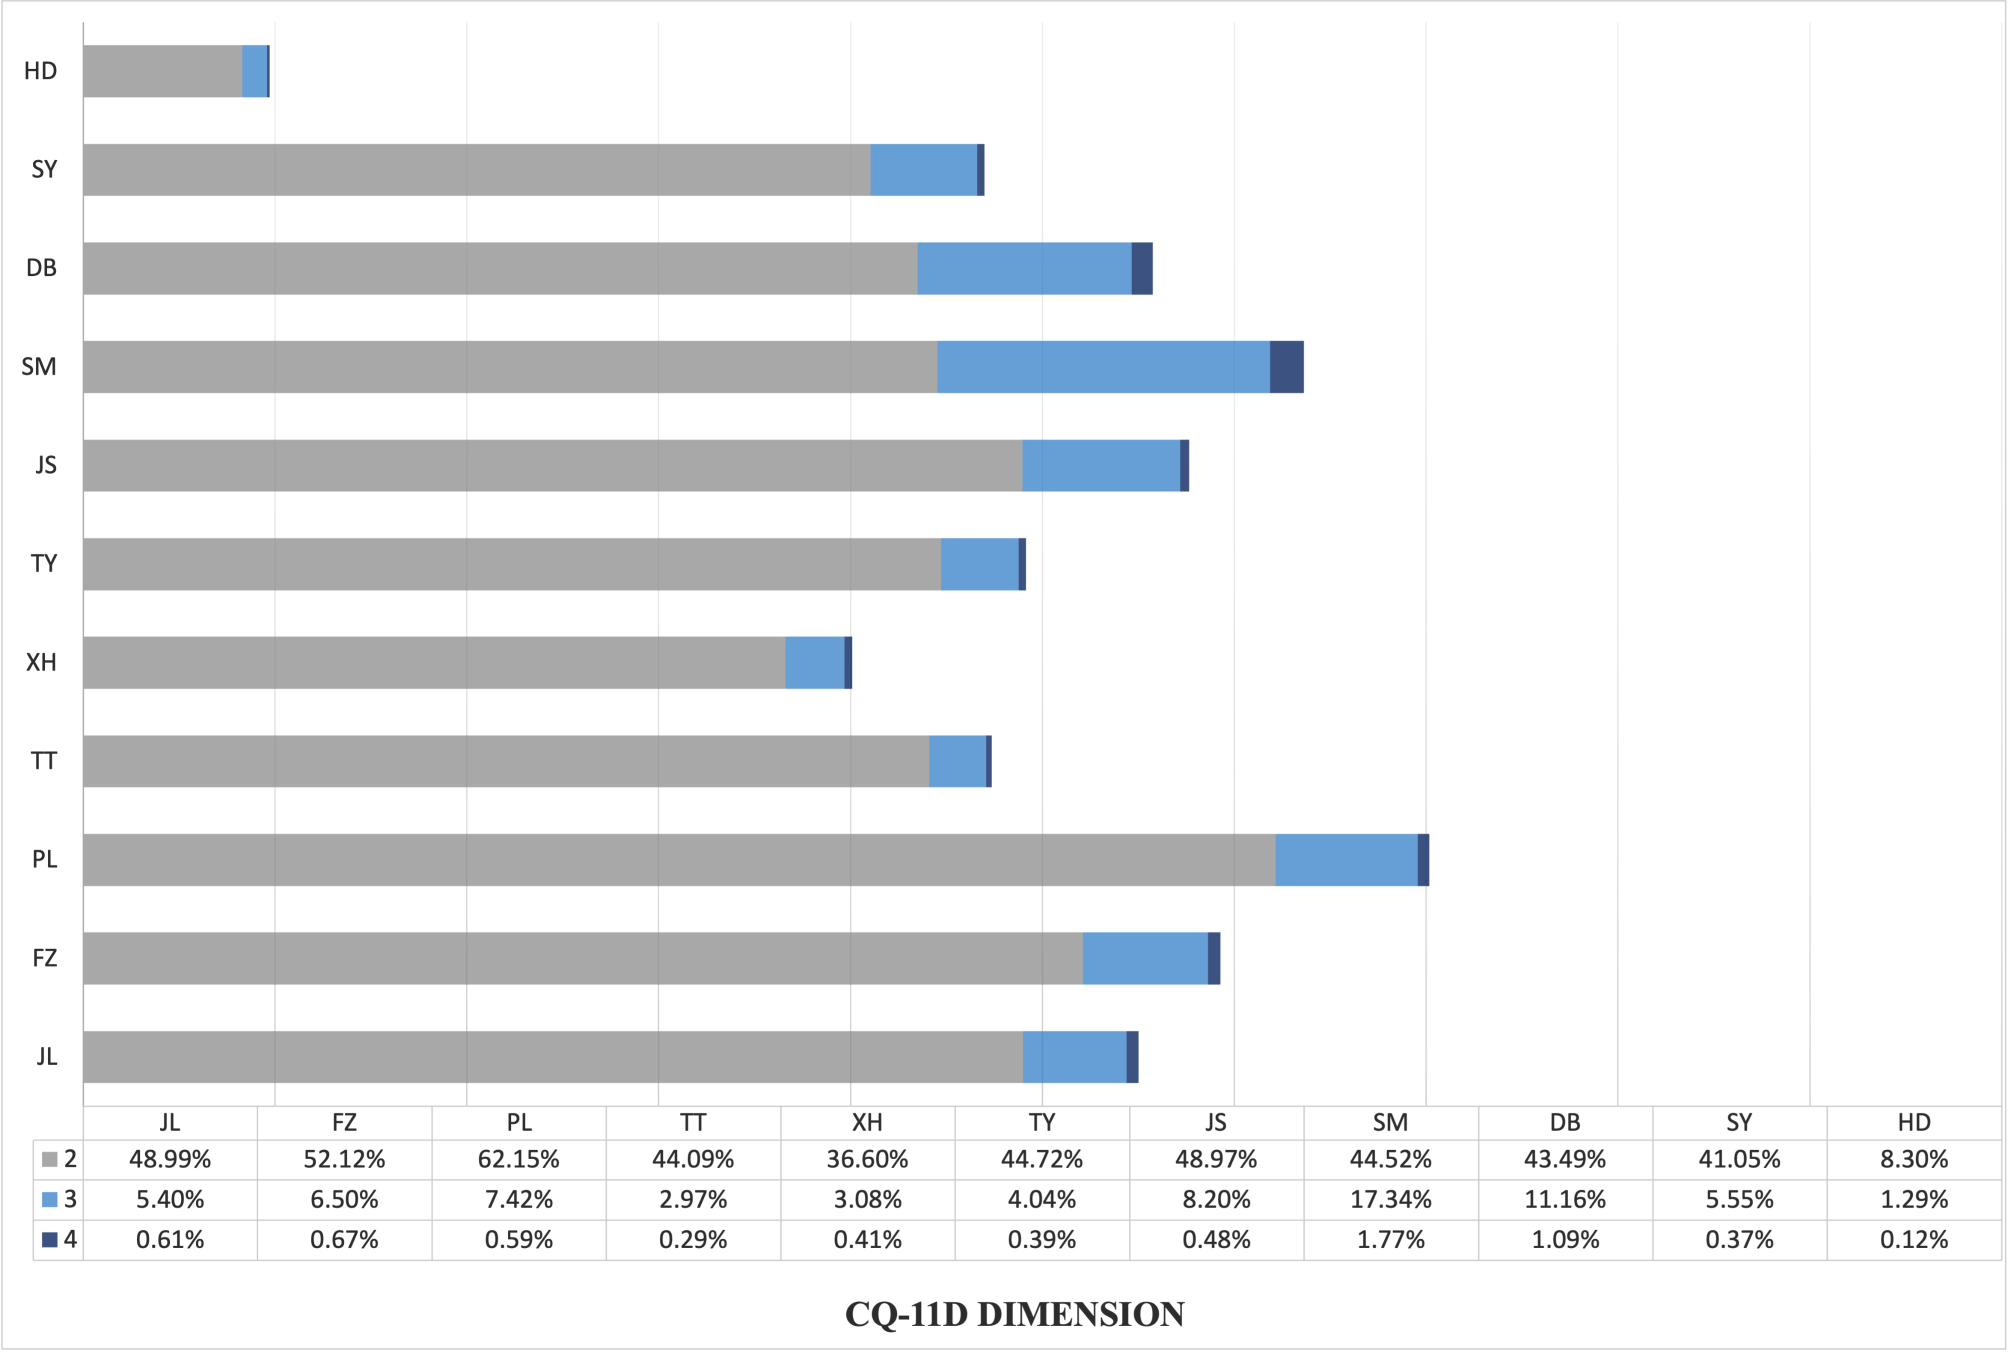
CHF-PROThe patient-reported outcome of chronic heart failure measure (CHF-PROM) developed by the authors’ research group was used in this study [11]. The structure of CHF-PROM is presented in Table S2. This questionnaire contains 57 items and covers four domains of patients’ health status including the physical domain (PHY), psychological domain (PSY), social domain (SOC), and therapeutic domain (TRE).
OutcomesThe outcomes of interest included all-cause mortality, HF hospitalization, and major adverse cardiovascular events (MACEs) throughout the two-year follow-up. All-cause mortality was defined as death due to any cause. HF hospitalization was defined as an admission of more than 24 h with exacerbation of HF after the index admission. HF as the cause for hospitalization was judged by professionals during follow-up and confirmed by ICD-10 diagnosis of HF as the patient’s primary diagnosis. MACEs in the study comprised all-cause mortality and HF hospitalization as mentioned above.
Feature selection and data preprocessingTraining set was performed via a cohort of 677 patients of the First Hospital and the Second Hospital of Shanxi Medical University, and validation set was completed via a cohort of 264 patients of Shanxi Cardiovascular Hospital. Missing value filling was performed in the training set and the validation set, respectively. In the training set, the parameter adjustment was performed with 10-fold cross-validation, while in the validation set, external validation and 95% confidence interval estimation were conducted via Bootstrap.
The independent variables of our study comprised 24 general information data points and the 4 domains of CHF-PRO (PHY, PSY, SOC, and TRE). All of the continuous variables were presented as means ± standard deviations (SD) or median ± interquartile range. The categorical variables were expressed as n (%). Continuous variables were compared using independent t-tests for normality distribution and rank-sum test for non-normality distribution. The chi-square test was used to compare the rates. All tests were two-sided, and P < 0.05 was considered as statistical significance.
The variables that missing more than 30% were deleted [12, 13]. For the data missing less than 30%, we added it with missForest [14] which was completed by R version 4.0.5 (Lucent Technologies, Murray Hill, NJ, USA). In addition, Cronbach’s α coefficient was used to assess the data quality of the CHF-PRO. Since CHF-PRO comprised the complete entity, we used all the 4 domains of it as the prediction features, and recursive feature elimination (RFE) method was used to select the variables of general information. The gain information was used to implement the process of feature-ranking.
Processing of imbalanced dataIn this study the ratio between mortality rate and survival rate was rougthly 1:13, which was a severe unbalance distribution of samples. Accordingly, were the ratios of readmission (1:3) and MACEs (1:2) were observed. Therefore, we applied synthetic minority over-sampling technique algorithm (SMOTE) to resolve the imbalanced distributions of the outcomes [15].
Machine learning model approachesSix ML approaches were used to train prediction models for mortality and HF hospitalization over the two years of follow-up. 10-fold cross-validation was used to select the value of the training parameters in an attempt to minimize the model deviance. The approaches applied in the study included logistic regression, random forest (RF) classifier, XGBoost, light gradient boosting machine (LightGBM), naive bayes (NB), and multilayer perceptron (MLP). Logistic regression (LR) was performed in this study as the basic model for the prediction. RF is a supervised ensemble learning method and based on decision trees that were built from the variable set. RF performs well in solving the overfitting problem of unbalanced data [16]. XGBoost is another ensemble tree algorithm. It is composed of a series of base classifiers which are linearly superimposed to optimize the algorithm after they are determined [17]. The LightGBM model is a type of optimized gradient boosting decision tree and can reduce the calculation amount of the structure fraction [18]. NB is based on Bayesian decision theory and Bayesian networks, and it is known to be insensitive to missing data [19], exhibit stable classification efficiency, and can process multiple classification tasks. Therefore, we were able to obtain better classification results by using NB [20]. MLP is a commonly used feedforward artificial neural network. It can adjust the weight of connections between neurons to obtain an output value which is equal to or close to the target value [21].
All models were constructed in four phases. First, they were constructed using only general information as predictors (model 1). Second, they were modified using four domains of CHF-PRO (model 2). Third, four domains of CHF-PRO were added to the general information predictors (model 3). Finally, we performed the parameter adjustment for model 3 (model 4). In the fourth step, we adjusted the parameters through learning curve and grid search to obtain the optimal configuration for each ML algorithm. Various software packages in the Python 3.7 that were used to perform the analysis and the optimized hyperparameters of each of the ML algorithms were shown in Table S3. We traversed all the combinations of parameters for each ML algorithm, and then determined the prediction results using 10-fold cross validation. The area under curve (AUC) was used to assess the model fitness function of variables.
Evaluation of candidate machine learning modelsPrediction performance of all model approaches was evaluated using the following parameters for the validation data from Shanxi Cardiovascular Hospital:
AUC was used to evaluate the discrimination ability of the predictive models. A 95% confidence interval (CI) of AUC was calculated in this study.
Brier score was used to assess the accuracy of the probability of the models and is defined as the mean squared differences between actual binary outcomes and predicted probabilities [22]. It ranges from 0 to 1.00, with a score of 0 indicating perfect prediction.
Calibration curves were used to determine the proximity between the predicted probabilities.
and observed probabilities. of outcomes for the optimal models.
The model with the optimal parameters was selected as the final model to the corresponding outcome for further analysis.
Evaluation of the selected machine learning modelsFeature importanceThe importance of each variable was ranked in the best performing models for death, rehospitalization, and MACEs. We applied a map of feature importance to represent the result.
Model interpretationThe SHAP method is a novel approach to explain various black boxes of ML models and has been validated in its interpretability performance [23]. Therefore, we applied SHAP to provide the interpretation for our prediction models with the contributing risk factors that lead to death and rehospitalization in patients with CHF. Shap packages in the Python 3.7 was used for this analysis.
To facilitate the application of the prediction model, Python 3.7 software was used to establish the self-made web-based risk calculator for patients with CHF. We transformed the models with the best verification to the self-made web-based risk calculator.
留言 (0)