
記住我
Colonoscopy is considered one of the most powerful and discriminative diagnostic tools for colorectal cancer screening. According to Global Cancer Statistics 2020, the mortality rate of colorectal cancer is ranked second in both sexes, whereas its incidence is ranked third (1). Colonoscopy has enabled the early detection and removal of neoplastic lesions and has lowered the incidence and mortality rates of colorectal cancer worldwide (2). Notably, the adequate cleansing of the bowel without bubbles or stains in preparation for colonoscopy is essential for the clear visualization of the mucosal surface and effective detection of pathologic lesions.
Colon purgatives are generally subcategorized into either hyperosmotic agents or polyethylene glycol (PEG)-based isosmotic bowel cleansing agents. Although its bowel cleansing efficacy has been comparable with that of sodium phosphate, the high volume and unpleasant taste of 4 L-PEG has made it difficult for patients to tolerate (3–6). However, when PEG was mixed with ascorbate/ascorbic acid, which is known to have a laxative effect, allowing the total volume to be decreased by half, the modified solution, 2 L-PEG/ascorbic acid (Asc), proved to be noninferior to the 4-L solution for efficacy and safety (7–11).
Currently, standardized 2 L-PEG/Asc is challenged by a solution with a lower volume. A new PEG-based bowel cleansing solution (Plenvu; Norgine, Amsterdam, the Netherlands, 1 L-PEG/ascorbate), containing twice as much sodium ascorbate as 2 L-PEG/Asc, demonstrated its noninferiority (12,13). Similarly, in South Korea, a 1-L bowel preparation solution, mainly composed of PEG + sodium ascorbic acid, has been recently introduced. However, the efficacy and safety of 1 L-PEG/Asc in Asian populations are poorly understood. This noninferiority trial aimed to evaluate the efficacy and safety of 1 L-PEG/Asc compared with 2 L-PEG/Asc.
METHODS Study design and participantsThis prospective, single-center, randomized, colonoscopist-blinded, parallel-group, noninferiority clinical trial (CLEANboWeL) comprised participants who visited a single tertiary academic referral medical center from July to October 2021. This study was approved by the Institutional Review Board of our hospital (approval number: 2020AN0480), adhered to the Consolidated Standards for Reporting Trial guidelines, and was officially registered in the primary registry of the World Health Organization International Clinical Trial Registry Platform (registration number: KCT0006313, https://cris.nih.go.kr/).
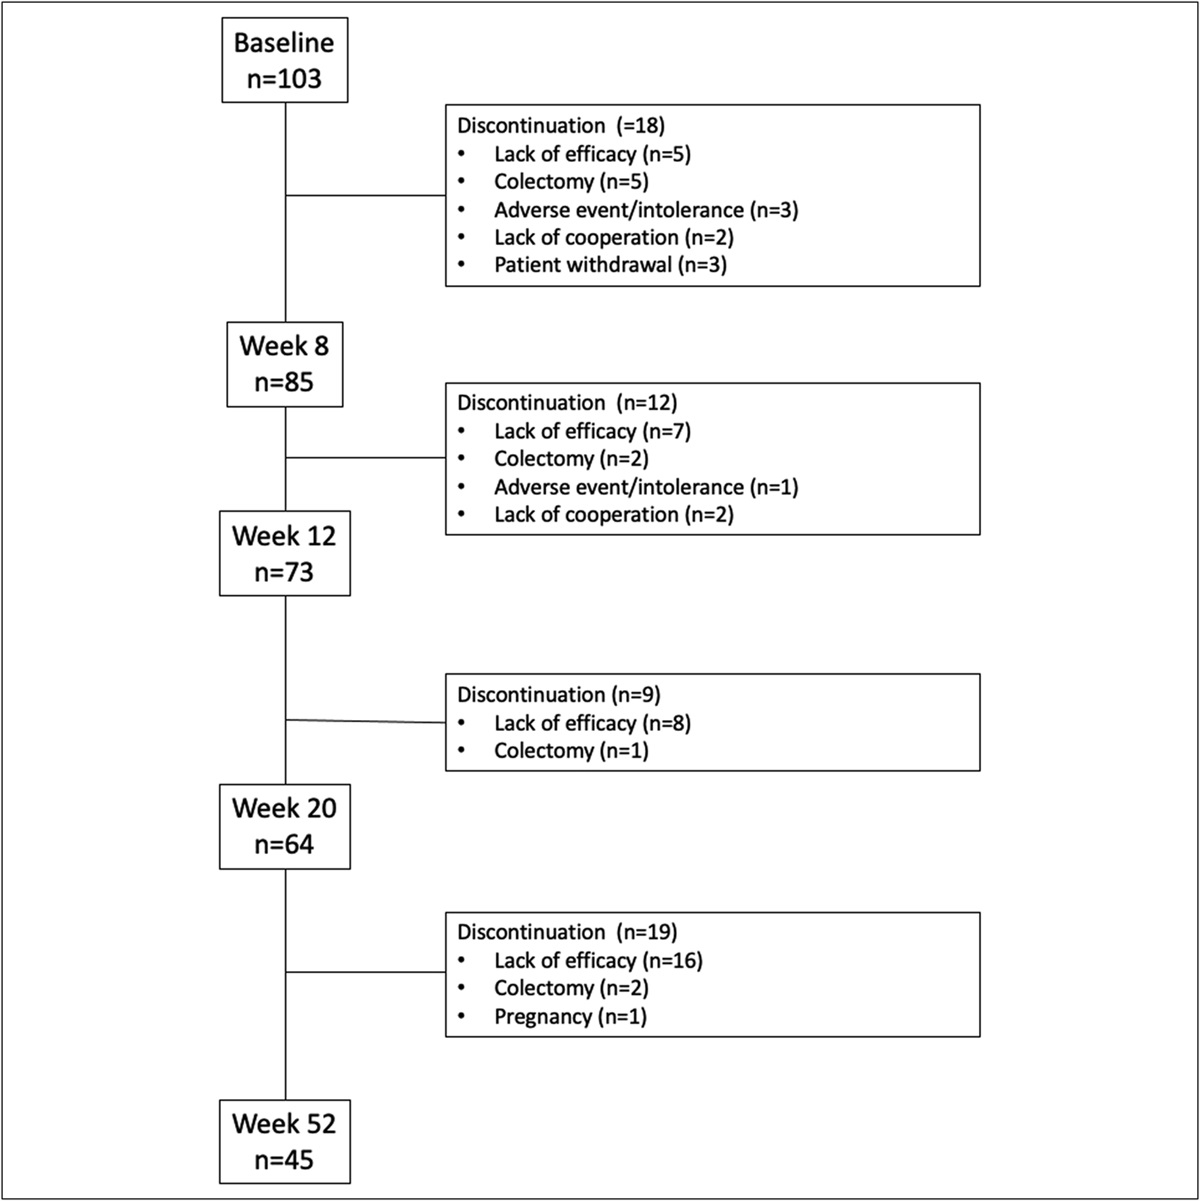
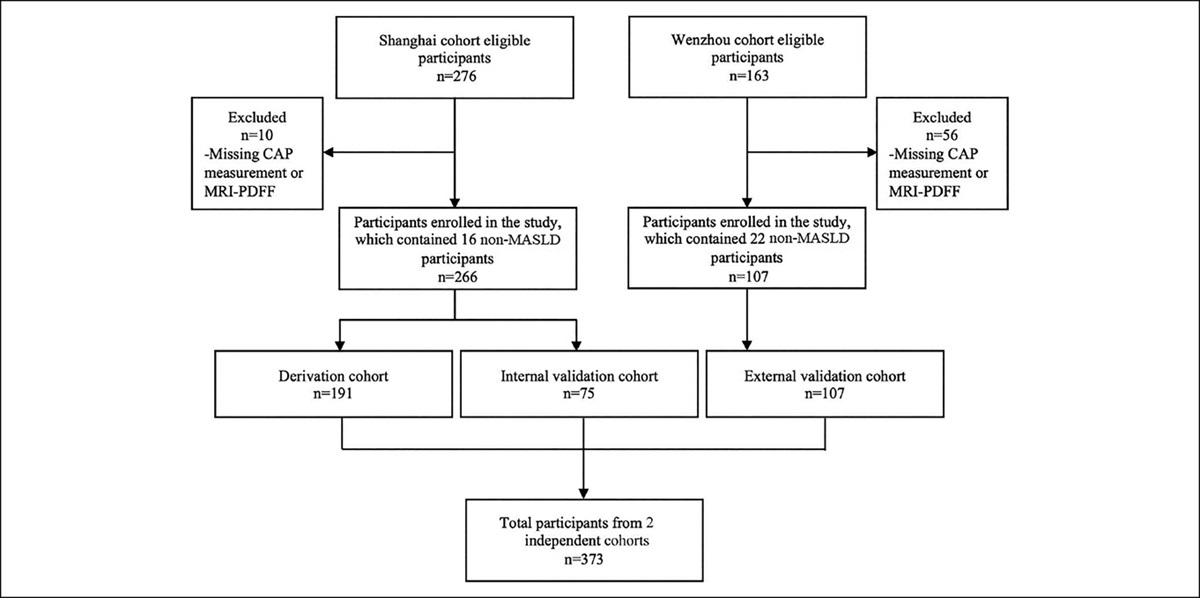
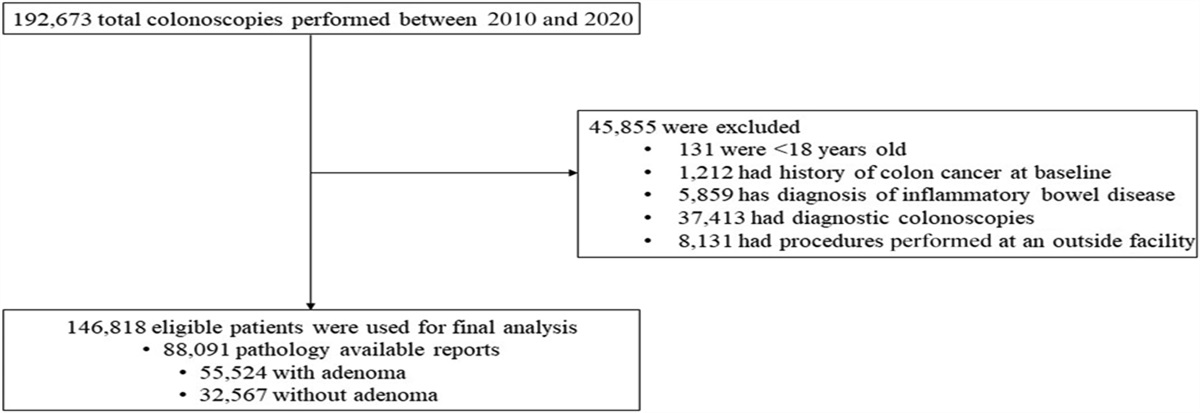
The study participants comprised outpatients aged between 19 and 85 years who were scheduled to undergo elective colonoscopy for symptomatic or screening and surveillance purposes. Figure 1 shows the flow of patient enrollment throughout this study. Patients with active colitis, inflammatory bowel disease, acute gastrointestinal bleeding, bowel obstruction, history of bowel resection, renal dysfunction (glomerular filtration rate <30 mL/min/1.73 m2), pregnancy, known allergies to bean, systolic blood pressure <80 mm Hg, and oxygen saturation <90% were excluded. All participants provided written informed consent.
Randomization and group dispositionThe patients were randomized by a statistical team with a 1:1 allocation ratio using a computer-generated random sequence. Only the study investigator was unblinded to the allocation process and not permitted to access data, management, or analysis. A statistical assistant collected and stored the backup data on a secure computer. After randomization, 8 colonoscopists were blinded to the preparation method, and patients were instructed not to reveal bowel solutions to colonoscopists.
Bowel preparation and colonoscopyThe patients consumed either 2 L-PEG/Asc (Coolprep; Taejoon, Seoul, South Korea) or 1 L-PEG/Asc (Cleanviewl; Taejoon) in a split-dose manner according to bowel preparation guidelines (14,15). The 1 L-PEG/Asc group was administered 500 mL of water (2 pairs of sachets A + B) once for 30 minutes with an additional 500 mL of water, whereas the 2 L-PEG/Asc group consumed 500 mL of water (sachet A + B) twice, followed by an additional 500 mL (Figure 2). This protocol was executed at 8 pm the night before the examination and repeated around 5 am the next morning on the day of the examination. Every participant was instructed with a manual by a nurse to follow a low-residue diet starting 3 days before the examination, have rice porridge for meals the day before the examination, and fast after 4 pm until the next day examination. Participants in both groups were encouraged to finish taking the solution at least 2 hours before the examination (16). Scheduled colonoscopy was performed between 9 am and 1 pm. The polyps discovered during colonoscopy were immediately removed after obtaining informed consent.
 Figure 1.:
 Consolidated Standards for Reporting Trial flowchart. ITT, intention-to-treat; PEG/Asc, polyethylene glycol with ascorbic acid.
Clinical outcomes and assessmentThe primary end point was to assess the overall bowel cleansing success rate and high-quality cleansing rate in the right colon and evaluate the noninferiority of the 1 L-PEG/Asc solution compared with the 2 L-PEG/Asc solution based on the Boston Bowel Preparation Scale (BBPS) and Harefield Cleansing Scale (HCS). BBPS was applied to each bowel segment, that is, the right, middle, and left colon, and scaled from 0 to 3 (0, the entire mucosa not viewed because of solid stool; 1, partially visualized mucosa because of staining; 2, minor amount of fragment, staining, and liquid; 3, fully visualized entire mucosa without fragment, staining, and liquid). The final score was expressed as the sum of each bowel segment's scale (total BBPS score: 0–9) and was subsequently translated into 4 quality rating scales: excellent (8–9), good (6–7), poor (3–5), and inadequate (0–2). The HCS system evaluated bowel preparations of the ascending, transverse, descending, sigmoid, and rectum on a scale of 0–4 (0, irremovable, hard stools; 1, semisolids; 2, brown liquid/fully removable semisolid stools; 3, clear liquid; and 4, empty and clean). This 5-point scale was replaced by 4 grades: A to D (A, all segments scored 3 or 4; B, at least 1 segment scored 2; C, at least 1 segment scored 1; and D, at least 1 segment scored 0). Overall bowel cleanliness was defined as successful if the total score was 6 or higher on BBPS or grade A or B on HCS. A score of 3 on BBPS and 4 or 3 on HCS was considered high quality.
The secondary end points included the polyp detection rate (PDR), adenoma detection rate (ADR), cecal intubation time, withdrawal time, procedure time, electrolyte imbalance, adverse events, tolerability, and acceptability. PDR and ADR were expressed as the proportion of colonoscopy cases in which polyps and pathologically confirmed adenomas were detected, respectively (17). The procedural time was calculated from the captured images while detecting and removing polyps. Blood samples were collected from each participant to examine electrolyte imbalances before and after taking bowel purgatives. Sampling was performed at the first outpatient visit before preparation and in the morning before colonoscopy on the day of examination.
Each patient was asked to provide feedback on adverse events using a binary questionnaire (i.e., yes or no questions). Acceptability was rephrased as ease of taking or willingness, which was subsequently expressed as binary categories, that is, yes or no. A patient was deemed compliant if he or she had no issues with taking 75% of the solution or more.
Sample size calculationWe calculated the sample size for noninferiority using the nQuery Advisor program (GraphPad Software; DBA Statistical Solutions, San Diego, CA) with a power of 80% (1-sided α = 0.025, β = 0.2). We assumed that the bowel cleansing rate for the 2 L-PEG/Asc group was 85% based on a previous study (18). The calculated successful cleansing rate for 1 L of PEG/Asc was 81%. Noninferiority was established if the lower limit of the 2-sided 95% confidence interval (CI) of the treatment difference was greater than −10%. The primary outcome was statistically significant if the overall bowel cleansing success rate and high-quality cleansing rate of the right-sided colon sufficed noninferiority of the 1 L-PEG/Asc solution, with a 1-sided P value of <0.025. All other statistics used a 2-sided test with a P value of <0.05 to demonstrate statistical significance.
Statistical analysisContinuous variables are expressed as mean and SD, whereas categorical variables are represented as percentages. An independent t test was used to compare the 2 groups of continuous variables. Categorical variables were analyzed using the χ2 and Fisher exact tests. Differences in electrolyte levels before and after bowel preparation were examined using paired t tests. Statistical analyses were performed using SPSS software version 24.0 (IBM, SPSS, Chicago, IL). The intention-to-treat (ITT) population was defined as the group of patients who underwent colonoscopy after randomization. The per-protocol (PP) population included patients who met the eligibility criteria and those who had successfully completed the bowel preparation solution (more than 75% of each dose).
RESULTS Baseline characteristicsTwo hundred fifty-four participants were recruited, of whom 4 (1.6%) failed to meet the eligibility criteria. The 250 patients enrolled were randomized into 2 groups in a 1:1 manner. After randomization, 10 patients were excluded from the ITT analysis, and 5 patients were excluded from the PP analysis (intake <75%). Therefore, 240 participants completed bowel purgatives in a split-dose regimen. In addition, 235 patients successfully took all bowel-cleansing solutions according to the instructions.
 Figure 2.:
 Scheduled bowel preparation. PEG/Asc, polyethylene glycol with ascorbic acid.
The average age of the 2 and 1 L groups was 62.3 and 59.8 years, with an average body mass index of 24.3 and 23.7 kg/m2, respectively (Table 1). There were no differences in the number of overweight and obese patients between the groups. Moreover, 7.5% of patients in the 2 L-PEG/Asc group and 6.7% of patients in the 1 L-PEG/Asc group had fewer than 3 bowel movements per week. Notably, 16.7% of the 2 L PEG/Asc group and 18.3% of the 1 L-PEG/Asc group answered that they had hard stool based on the Bristol chart.
Table 1. - Baseline characteristics Characteristic 2 L (N = 120) 1 L (N = 120) P value Sex, n (%) 0.691a Male 75 (62.5) 72 (60.0) Female 45 (37.5) 48 (40.0) Age, years, mean (SD) 62.3 ± 12.5 59.8 ± 15.7 0.185b Age ≥65, mean (SD) 56 (46.7) 56 (46.7) 1a BMI, mean (SD) 24.3 ± 3.2 23.7 ± 3.4 0.19b 35 (29.4) 30 (25.6) 0.517a BMI ≥30 obesity, mean (SD) 9 (7.5) 6 (5.0) 0.433a Diet restriction, n (%) 0.641a Yes 92 (76.7) 95 (79.2) No 28 (23.3) 25 (20.8) Indication, n (%) 0.955a Screening 50 (41.7) 48 (40.0) Surveillance 38 (31.7) 40 (33.3) Symptom 32 (26.7) 32 (26.7) No experience of colonoscopy, n (%) 18 (15.0) 18 (15.0) 1a Abdominal operation (except bowel resection), n (%) 0.768a Yes 32 (26.7) 30 (25.0) No 88 (73.3) 90 (75.0) Defecation number, n (%) Less than number of 3 per week 9 (7.5) 8 (6.7) 0.801a Bristol Stool Form Scale, n (%) Type 1 or 2 20 (16.7) 22 (18.3) 0.734a Underlying disease, n (%) Hypertension or cardiovascular disease 50 (41.7) 58 (48.3) 0.299a Diabetes mellitus 27 (22.5) 21 (17.5) 0.333a Hypothyroidism 6 (5.0) 6 (5.0) 1a Chronic kidney disease 4 (3.3) 7 (5.8) 0.354a Neurologic or psychiatric disease 14 (11.7) 11 (9.2) 0.526a Associated medication, n (%) Anticholinergics 3 (2.5) 5 (4.2) 0.722a Antidepressants 5 (4.2) 7 (5.8) 0.554a Iron supplement 8 (6.7) 7 (5.8) 0.79aBMI, body mass index; n, prevalence.
aP value from the χ2 test.
bP value from an independent t test. Data are expressed as mean and SD.
According to the ITT analysis, the rate of cleansing success measured using BBPS was 90.8% in the 2 L group and 92.5% in the 1 L group (Table 2). In addition, the treatment difference between the groups was 1.7% (95% CI, −5.4 to 8.7), which denotes its noninferiority because its lower margin was higher than −10%. The rate of cleansing success measured using the HCS was 89.2% (107/120) in the 2-L group and 92.5% (111/120) in the 1-L group. The treatment difference between the groups was 3.3% (95% CI, −4.0 to 10.7), also indicating noninferiority. Overall, 1 L-PEG/Asc demonstrated noninferiority to 2 L-PEG/Asc based on the BBPS and HCS ratings.
Table 2. - Overall and right colon clinical efficacy assessment of bowel preparation using the Boston Bowel Preparation Score and Harefield Cleansing Scale Intention-to-treat population Overall colon efficacy 2 L (N = 120) 1 L (N = 120) Treatment difference (95% CI) P value Segmental BBPS score, mean (SD) Right colon 2.24 ± 0.674 2.35 ± 0.589 0.186a Middle colon 2.63 ± 0.595 2.68 ± 0.552 0.501a Left colon 2.51 ± 0.594 2.43 ± 0.645 0.35a Total BBPS score, mean (SD) 7.31 ± 1.442 7.41 ± 1.458 0.594a Total BBPS quality scale, n (%) 0.77b Excellent 61 (50.8) 57 (47.5) Good 48 (40.0) 54 (45.0) Poor 10 (8.3) 9 (7.5) Inadequate 1 (0.8) 0 (0.0) BBPS successful, n (%) 109 (90.8) 111 (92.5) 1.7 (−0.054, +0.087) <0.001c Segmental HCS score, mean (SD) A-colon 2.48 ± 0.935 2.65 ± 0.876 0.136a T-colon 3.13 ± 0.931 3.21 ± 0.878 0.476a D-colon 2.96 ± 0.902 2.89 ± 0.887 0.564a S-colon 3.03 ± 0.888 2.97 ± 0.898 0.564a Rectum 3.08 ± 0.862 3.05 ± 0.858 0.822a Total HCS grade, n (%) 0.678b A 34 (28.3) 41 (34.2) B 73 (60.8) 70 (58.3) C 11 (9.2) 8 (6.7) D 2 (1.7) 1 (0.8) HCS successful, n (%) 107 (89.2) 111 (92.5) 3.3 (−0.040, +0.106) <0.001c Right colon efficacy 2 L (N = 120) 1 L (N = 120) Treatment difference (95% CI) P value (noninferiority) High-quality rate (BBPS = 3), n (%) 43 (35.8) 49 (40.8) 4.2 (−0.074, +0.174) 0.008c High-quality rate (HCS ≥3), n (%) 52 (43.3) 60 (50.0) 6.7 (−0.060, +0.194) 0.005c Success rate (BBPS ≥2), n (%) 108 (90.0) 113 (94.2) 4.2 (−0.027, +0.110) <0.001c Adequacy (BBPS ≥1), n (%) 118 (98.3) 120 (100) 1.7 (−0.006, +0.040) <0.001c PDR, right, n (%) 38 (31.7) 45 (37.5) 5.8 (−0.063, +0.180) 0.005c ADR, right, n (%) 30 (25.0) 33 (27.5) 2.5 (−0.087, +0.137) 0.014c Per-protocol population Overall colon efficacy 2 L (N = 118) 1 L (N = 117) Treatment difference (95% CI) P value (noninferiority) BBPS successful, n (%) 107 (90.7) 108 (92.3) 1.6 (−0.056, +0.088) <0.001c HCS successful, n (%) 106 (89.8) 108 (92.3) 2.5 (−0.049, +0.098) <0.001c Right colon efficacy 2 L (N = 118) 1 L (N = 117) Treatment difference (95% CI) P value (noninferiority) High-quality rate (BBPS = 3), n (%) 43 (36.4) 46 (39.3) 2.9 (−0.096, + 0.154) 0.021c High-quality rate (HCS ≥3), n (%) 52 (44.1) 57 (48.7) 4.6 (−0.082, + 0.175) 0.012c Success rate (BBPS ≥2), n (%) 106 (89.8) 110 (94.0) 4.2 (−0.028, + 0.112) <0.001c Adequacy (BBPS ≥1), n (%) 116 (98.3) 117 (100) 1.7 (−0.007, + 0.041) <0.001c PDR, right, n (%) 37 (31.4) 43 (36.8) 5.4 (−0.068, + 0.176) 0.006c ADR, right, n (%) 29 (24.6) 33 (28.2) 3.6 (−0.077, + 0.150) 0.009cADR, adenoma detection rate; BBPS, Boston Bowel Preparation Scale; CI, confidence interval; HCS, Harefield Cleansing Scale; ITT, intention-to-treat; n, prevalence; PDR, polyp detection rate.
aP value from an independent t test. Data are expressed as mean and SD.
bP value from the Fisher exact test.
cNoninferiority was demonstrated if the lower limit of the 2-sided 95.0% confidence interval for the treatment difference was greater than −10%. The right colon efficacy of the ITT population was considered significant at a 1-sided P value of <0.025.
Table 2 summarizes the high-quality cleansing efficacy results for the right colon. The treatment difference when patients had high-quality cleansing at the ascending colon, which was one of the primary end points in this study, was 4.2% on BBPS (95% CI, −8.2 to 16.5) and 6.7% on HCS (95% CI, −6.0 to 19.4). The success rate (BBPS ≥2) and adequacy (BBPS ≥1) were −2.7 and −0.6 for the lower confidence limit and −6.3 and −8.3 for PDR and ADR, respectively. The 1-L group achieved noninferiority in all other quality indicators.
Procedural assessmentColonoscopy-related outcomes, including cecal intubation time and rate, procedural time, withdrawal time, total colonoscopy time, PDR, and ADR, are listed in Table 3. Moreover, there were no significant differences in intubation, withdrawal, and procedural time between both groups (5.2 ± 2.5 vs 5.1 ± 2.5, P = 0.678; 8.8 ± 3.4 vs 8.7 ± 3.7, P = 0.928; and 7.1 ± 8.8 vs 7.6 ± 8.4, P = 0.598, respectively). Regarding PDR and ADR in the overall colon (PDR, 67.5% vs 74.2%, 0.256; ADR, 48.3% vs 50.8%, P = 0.699) and for each bowel segment, there was no statistically significant discrepancy.
Table 3. - Colonoscopy procedural assessment Procedural outcome 2 L (N = 120) 1 L (N = 120) P value Intubation success rate, n (%) 120 (100) 120 (100) N/A Intubation time, mean (SD) 5.19 ± 2.485 5.06 ± 2.485 0.678a Procedure time, mean (SD) 7.06 ± 8.823 7.63 ± 8.407 0.598a Withdrawal time excluding procedure time, mean (SD) 8.78 ± 3.438 8.74 ± 3.734 0.928a Total colonoscopy time, mean (SD) 21.02 ± 11.214 21.28 ± 10.491 0.849a PDR overall, n (%) 81 (67.5) 89 (74.2) 0.256b Right 38 (31.7) 45 (37.5) 0.342b Middle 31 (25.8) 36 (30.0) 0.472b Left 61 (50.8) 66 (55.0) 0.518b ADR overall, n (%) 58 (48.3) 61 (50.8) 0.699b Right 30 (25.0) 33 (27.5) 0.66b Middle 24 (20.0) 28 (23.3) 0.531b Left 42 (35.0) 44 (36.7) 0.788bADR, adenoma detection rate; n, prevalence; N/A, not applicable; PDR, polyp detection rate.
aP value from an independent t test; data are expressed as mean and SD.
bP value, χ2 test.
The electrolyte laboratory profiles of the 2 L-PEG/Asc and 1 L-PEG/Asc groups before and after preparation are presented in Table 4. The mean differences between groups were similar (Na, P = 0.270; K, P = 0.626; Cl, P = 0.552). The total incidences of hyponatremia, hypokalemia, and hypochloremia were not different between the groups (10/120, 8.3% vs 18/120, 15.8%).
Table 4. - Serum electrolyte change and number of patients with hyponatremia Serum electrolyte Pre Post P value 2 L (N = 120), mean (SD) Na 139.13 ± 2.35 139.00 ± 2.18 0.514a K 4.15 ± 0.32 4.13 ± 0.41 0.571a Cl 104.86 ± 2.46 105.18 ± 2.43 0.092a 1 L (N = 120), mean (SD) Na 139.20 ± 2.47 139.43 ± 2.69 0.374a K 4.23 ± 0.40 4.18 ± 0.45 0.27a Cl 105.26 ± 2.46 105.82 ± 3.45 0.105a Mean difference (post-pre), mean (SD) 2 L (N = 120) 1 L (N = 120) Na −0.133 ± 2.23 0.225 ± 2.76 0.27a K −0.022 ± 0.42 −0.051 ± 0.50 0.626a Cl 0.325 ± 2.10 0.558 ± 3.74 0.552a Pre, n (%) 2 L (N = 120) 1 L (N = 120) Hyponatremia <135 3 (2.5) 5 (4.2) 0.722a Hypokalemia <3.5 0 (0.0) 2 (1.7) 0.498a Hypochloremia <98 0 (0.0) 0 (0.0) N/A Post, n (%) 2 L (N = 120) 1 L (N = 120) Hyponatremia <135 3 (2.5) 6 (5.0) 0.499a Hypokalemia <3.5 2 (1.7) 7 (5.8) 0.171a Hypochloremia <98 0 (0.0) 0 (0.0) N/A Total incidence of decreased electrolyte, n (%) 10 (8.3) 18 (15.0) 0.108bCl, chloride; K, potassium; n, prevalence as a percentage; Na, sodium; N/A, not applicable; Post, after preparation; Pre, before preparation.
aP value from a paired t test; data are expressed as mean and SD.
bP value from the χ2 test.
No threatening adverse events were reported in all participants, with the most frequently reported symptoms being abdominal distention (37.5%) in the 2 L-PEG/Asc group and nausea (37.5%) in the 1 L-PEG/Asc group. However, thirst was significantly higher in the 1-L group than in the 2-L group (17.5% vs 29.2%, P = 0.033).
Generally, patients showed similar clinical acceptability and compliance rates. The proportion of those willing to repeat the same bowel preparation was 77.5% and 81.7% in the 2 and 1-L groups, respectively. A higher number of patients in the 1 L-PEG/Asc group reported convenience (30.4% vs 45.1%, P = 0.03). Five patients (2 in the 2 L-PEG/Asc group and 3 in the 1 L-PEG/Asc group) failed to take more than 75% of the bowel cleansing solutions (Table 5).
Table 5. - Adverse events with tolerability and acceptability 2 L (N = 120) 1 L (N = 120) P value Adverse events, n (%)
留言 (0)