
記住我
Colorectal cancer (CRC) has been reported to be the third most common cancer worldwide (1,2). Detection and removal of adenomatous polyps during colonoscopy is the most effective way to reduce the incidence of CRC (3). However, a recent meta-analysis revealed that a quarter of colorectal adenomas were missed at screening colonoscopy and resulted in most cases of interval CRC (4). While the colonoscopy quality varies largely among different endoscopists (5), colonoscopy quality control is considered a vital factor to ensure the effectiveness of screening colonoscopy (6).
Audit and feedback of the colonoscopy quality metric is proven to be effective in improving the adenoma detection rate (ADR) (7,8). Guidelines or expert consensus recommend withdrawal time as an important quality indicator in colonoscopy (9–11). However, as a surrogate indicator of mucosal observation quality, withdrawal time has certain limitations. First, withdrawal time can only reflect the observation quality of the whole colon, but not reflect the unqualified observation by rapid withdrawal within colorectal segments (12). Second, withdrawal time could not reflect the effect of the withdrawal technique on mucosal observation quality (13). Moreover, several studies have not found any association between withdrawal time and adenoma detection (14) or between withdrawal time and the risk of CRC after screening (15). Thus, the validity of withdrawal time as a quality measure remains unclear (16). Therefore, it is necessary to establish a more reliable index to measure the colonoscopy quality to make up for the shortage of withdrawal time.
In the past few years, artificial intelligence (AI) has made outstanding achievements in the clinical application of endoscopy (17). Our previous study established a real-time withdrawal speed monitoring system to control the withdrawal speed below the safe speed (18). With randomized controlled trials, the withdrawal speed monitoring system has proven to be effective in improving the ADR (8%–16% and 14.76%–24.54%, respectively) (18,19). However, it remains to be explored whether the proportion of overspeed frames (POF) of withdrawal can be a reliable substitute indicator to reflect the colonoscopy quality of endoscopists and whether the POF makes up for the lack of withdrawal time.
In this study, we have retrospectively enrolled a total of 1,804 eligible colonoscopy procedures to explore the relationship between the POF and withdrawal time and ADR and evaluate the feasibility of the POF as a quality control indicator. We hypothesized that the ADR is negatively correlated with the POF, and the combined assessment of the POF and withdrawal time would further increase the ADR.
METHODS Introduction of the systemWe conducted an automatic colonoscopy quality control system to calculate the POF and withdrawal time. The system consisted of 3 deep convolutional neural network (DCNN) models and the withdrawal speed value calculation model based on a hash algorithm. DCNN1 identified the cecum; DCNN2 filtered out the frames of biopsy and polypectomy; and DCNN3 identified the frames of endoscope outside the body. Details of model training and testing are provided in the Supplementary Digital Content (see Supplementary Material, https://links.lww.com/CTG/A908). The similarity between continuous colonoscopy frames was calculated based on the perceptual hashing algorithm to obtain the withdrawal speed value. Details of the calculation of speed values are available in Supplementary Digital Content (see Supplementary Material, https://links.lww.com/CTG/A908).
In routine clinical practice, the POF and withdrawal time were calculated after the cecum was identified by DCNN1; the frames of biopsy and polypectomy were automatically filtered out by DCNN2; and the system stopped counting the POF and withdrawal time after the frames of endoscope outside the body were identified by DCNN3. Following the previous study, a value of > 44 was considered a dangerous withdrawal speed (too fast) (18). The validity of a value of >44 is provided in the Supplementary Digital Content (see Supplementary Material, https://links.lww.com/CTG/A908; Figure 1).
 Figure 1.:
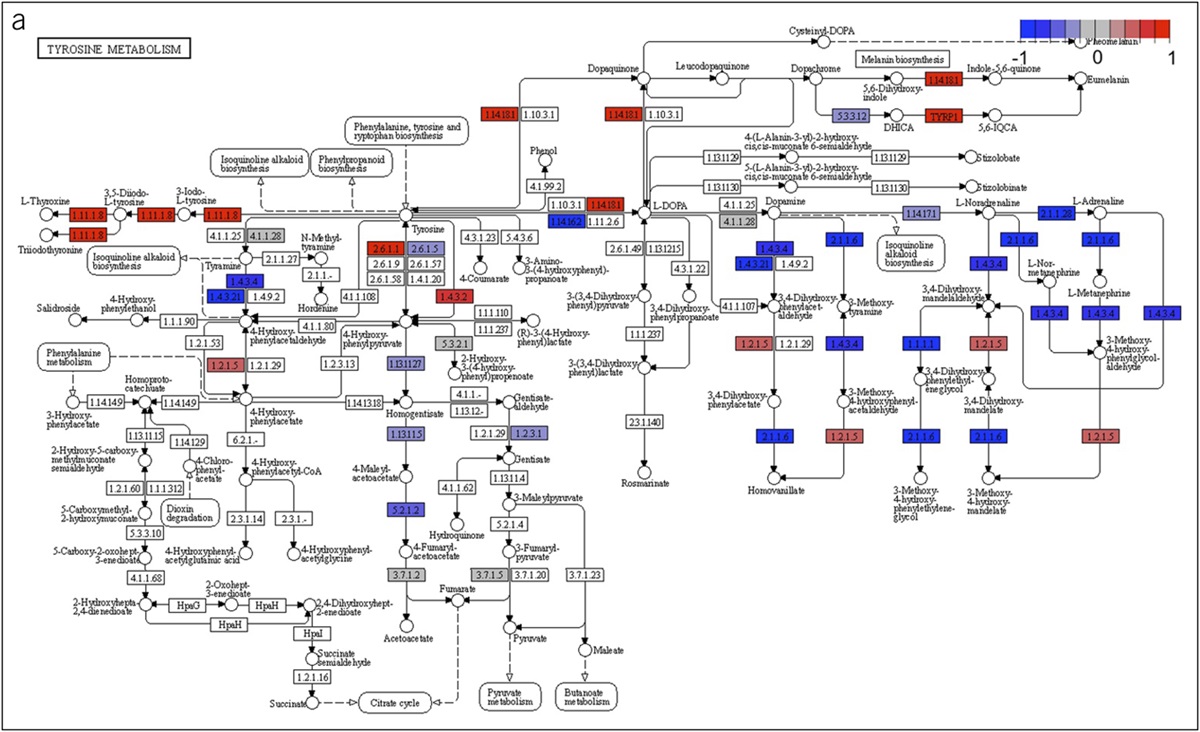
 Calculation principle of the proportion of overspeed frames. A hash algorithm is used to calculate the similarity between images, to characterize withdrawal speed, and to calculate the proportion of frames with instantaneous speed ≥44 in the whole colonoscopy video.
The POF was calculated as follows: The withdrawal frames of biopsy and polypectomy were filtered out, and the number of frames with the speed value > 44 was calculated:Proportion of the speed value >44 frames=the speed value >44 frames(total frames−the frames of biopsy and polypectomy)×100
Study design and participantsWe conducted a single-center, retrospective, observational study at the Renmin Hospital of Wuhan University. Thousand eight hundred four patients older than 18 years who attended the endoscopy center between May 10, 2020, and October 1, 2021, were included in this study. Patients with known contraindications to biopsy, bowel obstruction, or perforation; who were pregnant or lactating; who were suffering from polyposis syndromes; or who had a history of inflammatory bowel disease, CRC, or colorectal surgery were excluded. In addition, any patient whose cecum was not reached or who had suspicion for polyposis syndromes, inflammatory bowel disease, intestinal tuberculosis, or CRC was also excluded. This study was approved by the Ethics Committee of Renmin Hospital of Wuhan University. Informed consent was obtained from all patients.
ProceduresOperating endoscopists were from the Gastroenterology Department of Renmin Hospital of Wuhan University, Wuhan, China, with an endoscopy experience of 1–5 years and a total colonoscopy volume of 1,500–4,000. After the operating endoscopists found polyps, they were required to perform biopsies for histology and the staff assistant recorded the location, size, and morphological features according to the Paris classification.
After the colonoscopy, colonoscopy videos were collected. These videos were divided into images to calculate the POF and withdrawal time. Every 5% of the POF was treated as an interval; each interval is regarded as a point; and the lesion detection rate of each point represents the overall lesion detection rate of the interval. According to the ADR drop steeply point, we set a cutoff value of POF. First, the patients were classified into an LP group (the POF ≤ threshold, low POF) and HP group (the POF > threshold, high POF). Protocols or expert consensus recommend a standard withdrawal time of 6 minutes or longer (9–11). Second, the patients were classified into 4 groups according to the POF of 10% and withdrawal time of 6 minutes (ST-HP group: withdrawal time > 6 minutes and the POF > threshold, standard withdrawal time and high POF; standard withdrawal time and low POF (withdrawal time >6 min and the POF ≤10%) (ST-LP) group: withdrawal time >6 minutes and the POF ≤ threshold, standard withdrawal time and low POF; nonstandard withdrawal time and low POF (withdrawal time ≤6 min and the POF ≤10%) (NT-LP) group: withdrawal time ≤6 minutes and the POF ≤ threshold, nonstandard withdrawal time and low POF; NT-HP group: withdrawal time ≤6 minutes and the POF > threshold, nonstandard withdrawal time and high POF).
Furthermore, withdrawal videos were divided into 3 segments: the right colon defined as the cecum to the ascending colon, the transverse colon as the hepatic flexure to the splenic flexure, and the left colon as the descending colon to the rectum. These videos were fed into the POF system after being divided into the 3 segments to calculate the POF in each of the 3 segments.
Outcomes of colonoscopyThe primary outcome of this study was the ADR. Secondary outcomes included the polyp detection rate (PDR), ADR/PDR for adenomas with different sizes (diminutive ≤5 mm, small > 5 to <10 mm, and large ≥10 mm) and locations (right colon, transverse colon, and left colon), advanced ADR (≥10 mm diameter, high-grade dysplasia, and villous histology), benign lesion detection rate (including hyperplastic and inflammatory polyps), sessile serrated lesion detection rate, mean number of adenomas or polyps per patient, ADR between patients above and below the determined POF threshold, and withdrawal time.
Statistical analysisThe primary aim of this study was to find out whether there was an inverse relationship between the POF and ADR. We calculated the ADR or PDR of each POF and performed the correlation analysis using Pearson analysis. The baseline characteristics among the study groups were compared using the χ2 test for categorical variables and one-way analysis of variance test for continuous variables. Logistic regression was used to evaluate the ADR or PDR at different sizes and locations, and advanced ADR between patients with the POF above and below the determined threshold. The analysis of the detection rate was at a patient-based level, such that one positive outcome was registered, regardless of the number of lesions. To address possible confounding effects, we built covariate-adjusted regression models by adding group differences into the models as covariates, including the indication for colonoscopy, age, bowel cleanliness, sex, status as inpatient or outpatient, and endoscope manufacturers. A Poisson regression was used to assess the effect of the intervention on the mean number of adenomas and polyps per patient. A 2-sided P value of less than 0.05 was judged statistically significant. All analyses were performed using IBM SPSS (version 20).
Ethics approvalThis study was approved by the Institutional Review Board of Renmin Hospital of Wuhan University, with a waiver granted for the requirement of informed consent.
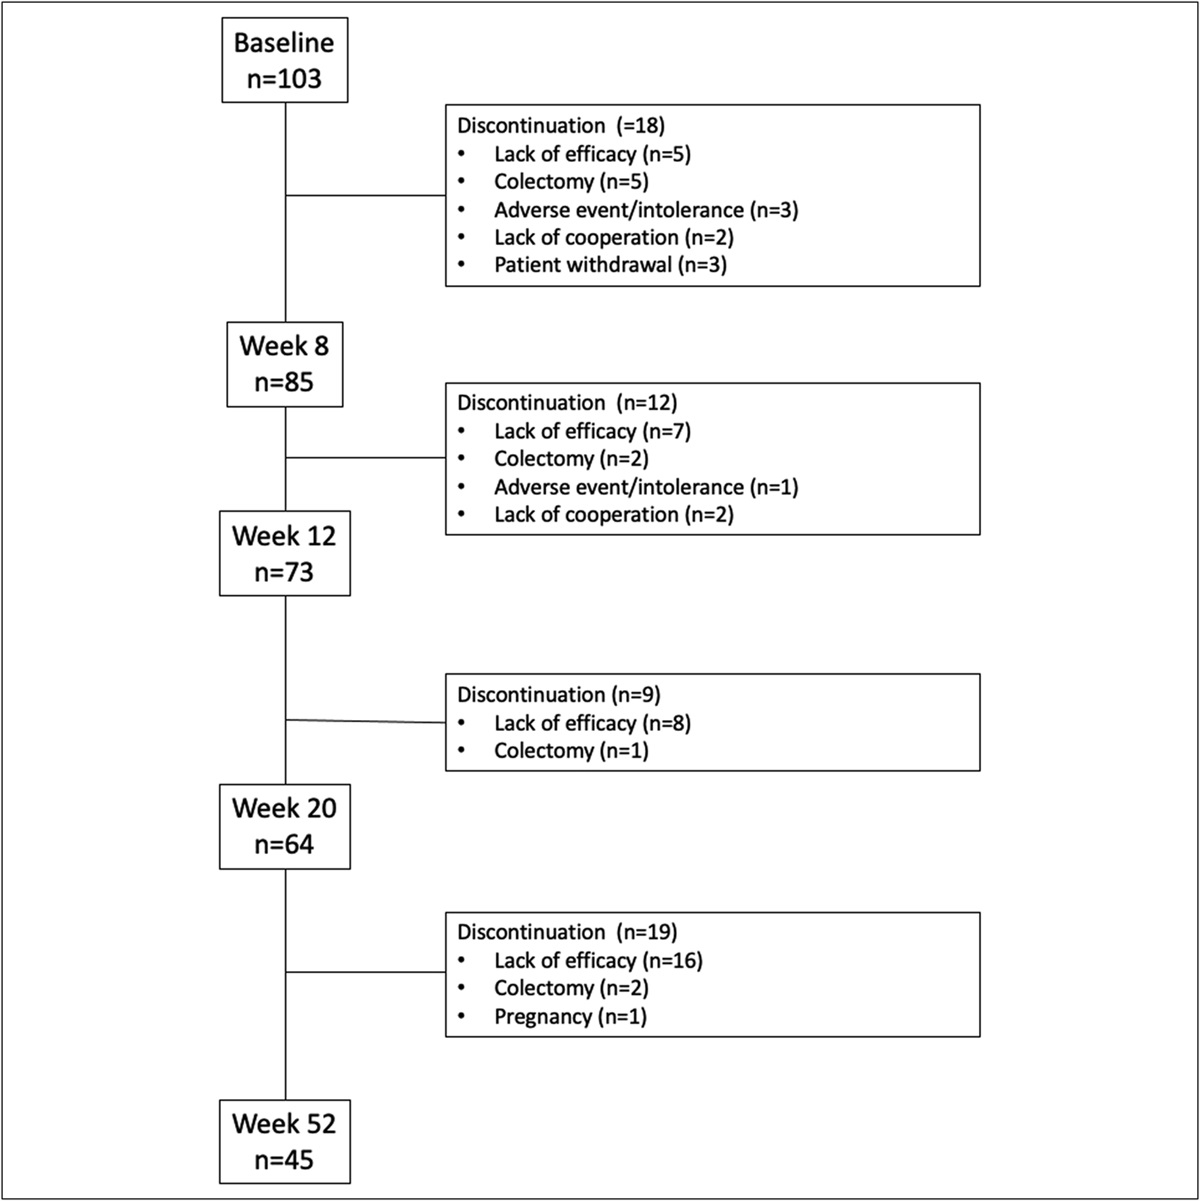
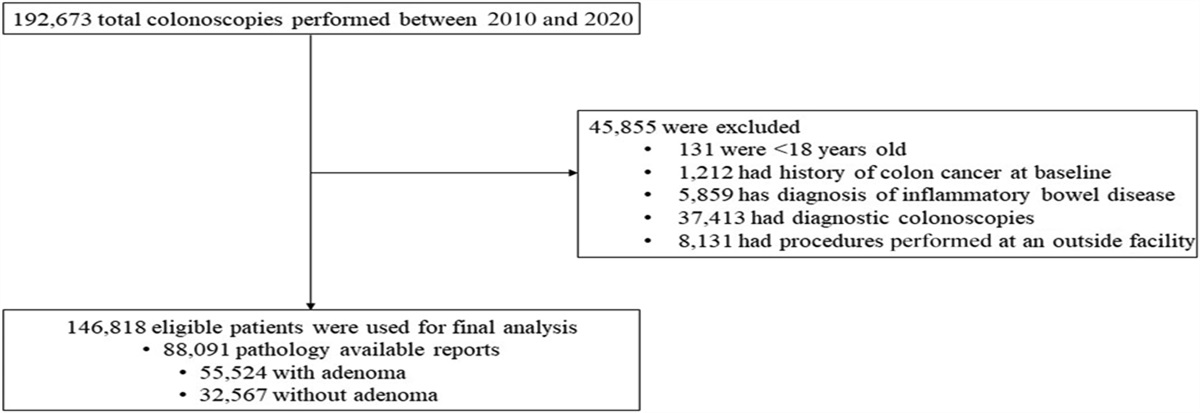
RESULTS Patient enrollment and baseline dataA total of 1,932 patients were evaluated, and 1,836 eligible individuals were enrolled in this study. We excluded 32 patients during colonoscopy according to the exclusion criteria: 23 patients because of the endoscope being withdrawn (13 cancer obstruction and 10 lumen obstruction), 5 because of poor bowel preparation, and 4 because of inability to achieve cecal intubation. Finally, 1,804 eligible patients were analyzed (Figure 2). Baseline characteristics of patients are presented in Table 1 (see Supplementary Digital Content, Table S1, https://links.lww.com/CTG/A908).
 Figure 2.:
 Flowchart.
Table 1. - Baseline information for the LP group and HP group No. of patients (n = 1,804) LP group (n = 1,398) HP group (n = 406) P Value Age (SD) 50.7 (12.66) 52.51 (12.45) 51.41 (13.32) 0.14 Sex 0.64 Male sex 839 (46.50) 646 (46.21) 193 (47.54) Female sex 965 (53.50) 752 (53.79) 213 (52.46) Indication for colonoscopy <0.01 Screening 1,108 (61.42) 957 (68.45) 151 (37.19) Diagnostic 560 (31.04) 346 (24.75) 214 (52.71) Surveillance 136 (7.54) 95 (6.80) 41 (10.10) Recruitment 0.09 Inpatient 407 (22.56) 303 (21.67) 104 (25.62) Outpatient 1,397 (77.44) 1,095 (78.33) 302 (74.38) Brand of colonoscopy 0.24 Olympus 1,083 (60.03) 829 (59.30) 254 (62.56) Fujifilm 721 (39.97) 569 (40.70) 152 (37.44) Bowel preparation 0.75 BBPS ≥2 in all segments 1,388 (76.94) 1,078 (77.11) 310 (76.35) BBPS<2 in any segment 416 (23.06) 320 (22.89) 96 (23.65)Data are mean (SD) or n (%). LP group: the POF ≤10%, low POF; HP group: the POF >10%, high POF.
POF, proportion of overspeed frames; BBPS, the Boston bowel preparation scale.
The P values represent the comparison of different measures between the LP group and the HP group.
Patient and segment distributions on different POFs are shown in Figure 3. The average ADR and PDR were calculated for each corresponding POF, and Table 2 presents the correlation coefficient between the POF and ADR and between the POF and PDR. Every 5% was treated as an interval; the POF was 5%, 10%, 15%, and >15%; and the ADR was 21.18%, 24.57%, 15.69%, and 12.24%, respectively. The Pearson correlation coefficient between the POF and the ADR was −0.836. Inverse correlation could also be observed in the transverse colon with a Pearson correlation coefficient of −0.864. For PDR, the Pearson correlation coefficient for the whole colon, right colon, transverse colon, and left colon was −0.926, −0.919, −0.962, and −0.941, respectively.
 Figure 3.:
 Sample distribution. Number of patients and segments at different POF for the whole colon, right colon, transverse colon, and left colon. POF, proportion of overspeed frames.
Table 2. - ADR and PDR at different POFs for the whole colon, right colon, transverse colon, and left colon POF 0%–5% 5%–10% 10%–15% >15% Pearson correlation coefficient ADR (%) Whole colon 21.28 24.57 15.69 12.24 −0.836 Right colon 6.32 5.85 3.61 5.74 −0.427 Transverse colon 6.24 5.71 5.60 2.63 −0.864 Left colon 12.72 12.44 7.96 10.99 −0.573 PDR (%) Whole colon 62.82 62.78 50.42 30.61 −0.926 Right colon 18.19 15.72 11.67 12.30 −0.919 Transverse colon 20.84 19.52 14.16 7.02 −0.962 Left colon 57.03 51.04 35.10 35.16 −0.941ADR, adenoma detection rate; PDR, polyp detection rate; POF, proportion of overspeed frames.
Similarly, every 3 minutes was treated as an interval. For ADR and PDR, the withdrawal time was 3, 6, 9, and 9 minutes, the ADR was 15.86%, 21.28%, 20.26%, and 32.24%, respectively, the PDR was 56.55%, 55.08%, 58.66% and 84.15%, respectively. The Pearson correlation coefficient between withdrawal time and the ADR was 0.892. the Pearson correlation coefficient between withdrawal time and the PDR was 0.810 (see Supplementary Digital Content, Table S2, https://links.lww.com/CTG/A908).
Threshold comparisonWe have drawn a dose-response curve to justify the POF threshold (Figure 4). The ADR dropped steeply at the point of the POF of 10%; therefore, the POF of 10% was set as a threshold and applied to analyze lesion detection rate difference. We divided the patients into 2 groups (LP group: the POF ≤10%, low POF; HP group: the POF >10%, high POF).
 Figure 4.:
 Dose-response curve of ADR and POF in the whole colon. The vertex represents the POF cutoff score of 10. ADR, adenoma detection rate; POF, proportion of overspeed frames.
For adenoma detection, as presented in Table 3, the whole colon ADR in the LP group was significantly higher than that in the HP group (22.89% vs 15.27%; odds ratio [OR] 0.508, 95% confidence interval (CI) 0.369–0.700, P < 0.01). Significantly higher ADR in the LP group was observed in the left colon (13.09% vs 6.65%; 0.415, 0.269–0.642, P < 0.01). Regarding the adenoma size analysis, the number of adenomas of all sizes detected in the LP group was significantly higher than that in the HP group (diminutive: 19.74% vs 13.79%, P < 0.01, 95% CI 0.385–0.754, OR 0.539; small: 4.15% vs 2.71%, P = 0.07, 95 % CI 0.274–1.053, OR 0.537; large: 2.36% vs 1.48%, P = 0.16, OR 0.522, 95 % CI 0.212–1.286).
Table 3. - Primary and secondary outcome analyses (comparison between the LP group and the HP group) LP group HP group Group LP vs group HP (n = 1,398) (n = 406) P Value Odds ratio (95% CI) Adenoma detection rate 320 (22.89) 62 (15.27) <0.01 0.508 (0.369 to 0.700) Polyp detection rate 878 (62.80) 195 (48.03) <0.01 0.487 (0.380 to 0.625) Adenoma size category Diminutive (≤5 mm) 276 (19.74) 56 (13.79) <0.01 0.539 (0.385 to 0.754) Small (>5 to <10 mm) 58 (4.15) 11 (2.71) 0.07 0.537 (0.274 to 1.053) Large (≥10 mm) 33 (2.36) 6 (1.48) 0.16 0.522 (0.212 to 1.286) Adenoma pathology Advanced adenoma 48 (3.43) 10 (2.46) 0.16 0.597 (0.293 to 1.217) Other adenoma 309 (22.10) 61 (15.02) <0.01 0.527 (0.382 to 0.728) Flat adenoma 33 (2.36) 5 (1.23) 0.08 0.414 (0.157 to 1.093) SSL 11 (0.79) 2 (0.49) 0.39 0.506 (0.108 to 2.373) Adenoma location Right colon 80 (5.72) 21 (5.17) 0.47 0.821 (0.483 to 1.394) Transverse colon 83 (5.94) 20 (4.93) 0.11 0.653 (0.387 to 1.102) Left colon 183 (13.09) 27 (6.65) <0.01 0.415 (0.269 to 0.642) Polyp size category Diminutive (≤5 mm) 845 (60.44) 182 (44.83) <0.01 0.472 (0.369 to 0.605) Small (>5 to <10 mm) 111 (7.94) 22 (5.42) 0.09 0.652 (0.400 to 1.061) Large (≥10 mm) 48 (3.43) 9 (2.22) 0.13 0.561 (0.267 to 1.179) Polyp pathology Flat polyp 152 (10.87) 25 (6.16) 0.01 0.547 (0.348 to 0.861) Polypoid polyp 800 (57.22) 176 (43.35) <0.01 0.501 (0.392 to 0.642) Polyp location Right colon 233 (16.67) 51 (12.56) 0.04 0.695 (0.493 to 0.980) Transverse colon 267 (19.10) 62 (15.27) 0.02 0.686 (0.497 to 0.946) Left colon 757 (54.15) 140 (34.48) <0.01 0.413 (0.321 to 0.532) Adenomas detected per colonoscopy 0.28 (0.601) 0.175 (0.435) <0.01 0.020 (−4.4476 to 3.359) Polyps detected per colonoscopy 2.551 (3.679) 1.466 (3.231) <0.01 0.307 (−1.358 to 1.003)Data are shown as n (%).
n = number of patients. % = proportion of the patients. These data are shown as P value, mean range (95% CI). LP group: the POF ≤10%, low POF; HP group: the POF >10%, high POF.
POF, proportion of overspeed frames; SSL, sessile serrated lesion.
For polyp detection, as presented in Table 3, the whole colon PDR in the LP group was significantly higher than that in the HP group (62.80% vs 48.03%; OR 0.487, 95% CI 0.380–0.625, P < 0.01). Significantly higher PDRs in the LP group were observed in the right colon (16.67% vs 12.56%; 0.695, 0.493–0.980, P = 0.04), transverse colon (19.10% vs 15.27%; 0.686, 0.497–0.946, P = 0.02), and left colon (54.15% vs 34.48%; 0.413, 0.321–0.532, P < 0.01).
The complementarity of the POF and withdrawal timeAccording to a systematic review and meta-analysis, a withdrawal time of 9 minutes is also a potential indicator of colonoscopy quality control (20); we further analyzed the lesion detection rate of withdrawal time 6–9 minutes and ≥9 minutes. The results showed that POF had no effect on ADR when withdrawal time reached more than 9 min, and the ADR of POF ≤10% was significantly higher than that with POF >10% at withdrawal time 6–9 minutes and less than 9 minutes (see Supplementary Digital Content, Table S5, https://links.lww.com/CTG/A908).
To explore the complementary effect of the POF and withdrawal time, we divided the patients into 4 groups: ST-HP group: withdrawal time > 6 minutes and the POF >10%, standard withdrawal time and high POF; ST-LP group: withdrawal time >6 minutes and the POF ≤10%, standard withdrawal time and low POF; NT-LP group: withdrawal time ≤6 minutes and the POF ≤10%, nonstandard withdrawal time and low POF; and NT-HP group: withdrawal time ≤6 minutes and the POF >10%, nonstandard withdrawal time and high POF.
The withdrawal time of the ST-HP group and ST-LP group was > 6 minutes, which was used to compare the influence of POF on ADR when the withdrawal time reaches the guideline standard. As presented in Table 4, the ADR in the ST-LP group was significantly higher than that in the ST-HP group (25.30% vs 16.50%; OR 0.463, 95% CI 0.296–0.724, P < 0.01). Moreover, significant improvement was also observed in the PDR in the ST-LP group (69.10% vs 51.46%; 0.436, 0.304–0.625, P < 0.01). Regarding the lesion size analysis, the number of adenomas and polyps of all sizes detected in the ST-LP group was significantly higher than that in the ST-HP group, although the lesions were smaller than 5 mm (adenomas 21.90% vs 15.05%, P < 0.01, 95% CI 0.295–0.755, OR 0.472; polyps 66.38% vs 47.57%, P < 0.01, 0.289–0.592, 0.414).
Table 4. - Primary and secondary outcome analyses (comparison between ST-HP group, ST-LP group, and NT-LP group) ST-HP group (n = 206) ST-LP group (n = 589) NT-LP group (n = 809) NT-HP group (n = 200) ST-LP group VS ST-HP group ST-LP group vs NT-LP group P Value Odds ratio (95% CI) P Value Odds ratio (95% CI) Adenoma detection rate 34 (16.50) 149 (25.30) 171 (21.14) 28 (14.00) 0.01 0.463 (0.296 to 0.724) 0.35 0.877 (0.667 to 1.153) Polyp detection rate 106 (51.46) 407 (69.10) 471 (58.22) 89 (44.50) <0.01 0.436 (0.304 to 0.625) <0.01 0.631 (0.492 to 0.809) Adenoma size category Diminutive (≤5 mm) 31 (15.05) 129 (21.90) 147 (18.17) 25 (12.50) <0.01 0.472 (0.295 to 0.755) 0.44 0.892 (0.669 to 1.191) Small (>5 to <10 mm) 6 (2.91) 27 (4.58) 31 (3.83) 5 (2.50) 0.22 0.555 (0.218 to 1.414) 0.94 1.022 (0.587 to 1.779) Large (≥10 mm) 4 (1.94) 21 (3.57) 12 (1.48) 2 (1.00) 0.25 0.523 (0.173 to 1.583) 0.04 0.454 (0.214 to 0.963) Adenoma pathology Advanced adenoma 6 (2.91) 21 (3.57) 27 (3.34) 4 (2.00) 0.76 0.861 (0.331 to 2.238) 0.72 1.118 (0.605 to 2.065) Other adenoma 33 (16.02) 144 (24.45) 165 (20.40) 28 (14.00) <0.01 1.696 (0.298 to 0.736) 0.34 0.873 (0.663 to 1.151) Flat adenoma 2 (0.97) 21 (3.57) 12 (1.48) 3 (1.50) 0.06 0.233 (0.052 to 1.035) 0.06 0.489 (0.232 to 1.031) SSL 0 (0.00) 1 (0.17) 10 (1.24) 2 (1.00) 0.99 0.000 (0.000 to 1.136) 0.04 9.351 (1.150 to 76.052) Adenoma location Right colon 12 (5.83) 32 (5.43) 48 (5.93)
留言 (0)