
記住我


Paraffin-embedded lung sections from control, MCT and SuHx rats were fixed and stained as previously described by Duim et al. [13]. Paraffin sections were deparaffinized and rehydrated. The sections were fixed in cold acetone (− 20 °C) for 1 min, air-dried for 1 h and hydrated in PBS. All sections were boiled for 40 min in Vector® Antigen Unmasking Solution (Vector) using a pressure cooker. After blocking with 1% BSA in 0.1% Tween-PBS, sections were incubated overnight at 4 °C with primary antibodies directed against ALK5 (1:1000 dilution; SantaCruz; Cat#sc-398), Pecam-1 (M-20; 1:1000 dilution; SantaCruz; Cat#sc-1506) and alpha smooth muscle actin (1:10,000 dilution; Aldrich, Cat#A2547). All sections were mounted with ProLong® Gold antifade reagent (Invitrogen, Carlsbad, USA) containing DAPI. For fluorescence quantification and comparison, sections were stained in a single run and images were collected in a single session with the same exposure time between different areas and different slides. Images were analysed using Caseviewer 2.3 software.
Western blottingFrozen lung tissues from controls, MCT and SuHx rats were homogenized, and cell lysates were prepared with NP-40 lysis buffer, and Western blotting was performed as described previously [14]. The protein suspensions were separated on a 10% gel, transferred to a nitrocellulose membrane, and incubated with blocking buffer (5% non-fat milk in PBS with 0.1% Tween 20). The blots were developed with antibodies for ALK5 (1:1000 dilution; SantaCruz; Cat#sc-398), vinculin (Sigma-Aldrich, Cat#V9131) or β-actin (Sigma-Aldrich, Cat# A5441) at 4 °C overnight, followed by horseradish peroxidase-conjugated antimouse or anti-rabbit (GE Healthcare) secondary antibodies using the Clarity ECL Substrate (1705061; Bio-Rad, Hercules, USA) and followed by scanning using light sensitive new RX medical 20 × 40 CM films (Fuji, Tokyo, Japan).
Quantitative polymerase chain reaction (qPCR)The frozen lung tissue was homogenized and total RNA was isolated using Tripure RNA isolation kit (Roche, Basel, Switzerland Cat#11667165001). cDNA synthesis was performed with iScript (Bio-Rad, Hercules, USA, Cat#170-8891), followed by real-time PCR using the SYBR Green and a Bio-Rad CFX Connect device. Primers used for real-time PCR for ALK5: Fw: GCTGACATCTATGCAATGGGCTTA, Rv: AGGCAACTGGTAGTCTTCGTGGA; GAPDH: Fw: GGTGGACCTCATGGCCTACA, Rv: CTCTCTTGCTCTCAGTATCCTTGCT. GAPDH served as a control for the amount of cDNA present in each sample. Data were analysed using the comparative difference in cycle number (ΔCT) method according to the manufacturer’s instructions. Q-PCR relative quantification was realized by calculating the ratio of the protein expression of interest over the GAPDH mRNA expression [15].
AutoradiographySections of 10 µm thickness were cut using a Cryostat (Leica CM3050 S) and thaw mounted on Thermo Scientific Superfrost plus adhesion slides. The sections were stored at– 20 °C until further handling. Tissue sections were defrosted, washed three times for 5 min with 5 mM Tris HCl buffer, pH 7.4 and dried in a cold stream of air. The sections were incubated for 30 min with 0.5 mL of 5 mM Tris HCl buffer, pH 7.4, containing 1.0 MBq·mL−1 (6 ± 0 nM) [11C]LR111 tracer or 0.5 MBq mL−1 (7 ± 2 nM) [18F]EW-7197 with or without SB431542 (94 µM; Sigma-Aldrich, Zwijndrecht, The Netherlands) [16]. The sections were washed in cold 5 mM Tris HCl buffer, pH 7.4, (three times 1 min) followed by a dip in ice cold water. The sections were dried under an air stream and exposed to a phosphor storage screen (GE Healthcare lifescience, Buckinghamshire, UK) for 10 min. Screens were developed on a Typhoon FLA 7000 phosphor imager (GE Healthcare lifescience, Buckinghamshire, UK) and analysed using Image Quant TL v8.1.0.0 (GE Healthcare lifescience, Buckinghamshire, UK). Results were expressed in percentage and the healthy lungs were normalized to 100%. Statistical analysis was performed using Graphpad PRISM (v 5.02, Graphpad Software Inc). Tracer uptake in the tissue was compared with tracer uptake co-administered with SB431542 by using a one-tailed unpaired t-test. Differences were considered significant if p < 0.05. Adjacent tissue sections were used for autoradiography experiments.
Animal modelsAnimal experiments were performed in accordance with the European Community Council Directive (2010/63/EU) for laboratory animal care and the Dutch Law on animal experimentation. The experimental protocol was validated and approved by the central committee for animal experimentation (CCD) and the local committee on animal experimentation of the Amsterdam University Medical Center, location VUmc. Animals were housed in groups under standard conditions (20–24 °C, 50–70% relative humidity, 12 h light/dark cycles) with a maximum of 6 animals per cage unless otherwise stated. In addition, they were provided with nesting material, sawdust, tap water and food (Teklad Global 16% Protein Rodent Diet, Harlan, Madison, WI, USA) ad libitum. Biodistribution studies (n = 32) were carried out in healthy male Wistar rats (214 ± 12 g, Envigo, Horst, The Netherlands). For PET studies, ten male Wistar rats (188 ± 20 g, Envigo, Horst, The Netherlands) were allocated to two different groups, a control group (n = 4) and an MCT-exposed group (n = 6) and Six Sprague Dawley (S.D.) rats (Charles River, Germany, 198 ± 6 g) were used as third group. MCT (Sigma-Aldrich, Zwijndrecht, The Netherlands) was administered subcutaneously to the Wistar rats as a single injection (60 mg kg−1) [17]. MCT rats were housed for two weeks after MCT injection. The S.D. rats were injected with Sugen (SU-5416, Tocris Bioscience, Bristol, UK) [18, 19] subcutaneously as a single injection (25 mg kg−1). SuHx rats were housed for 4 weeks after the Sugen injection in 10% oxygen, maintained by a nitrogen generator.
RadiochemistryThe tracers were synthesized as reported previously [12]. Briefly, precursor for [18F]EW-7197 was synthesized according to Jin et al. [20]. [18F]EW-7197 was synthesized with a reductive amination reaction that was based on a method published by Vasdev et al. [21, 22]. Precursor for [11C]LR111 and LR111 was synthesized according to Amada et al. [23]. [11C]LR111 was synthesized using the so-called [11C]CO2 fixation method [24, 25].
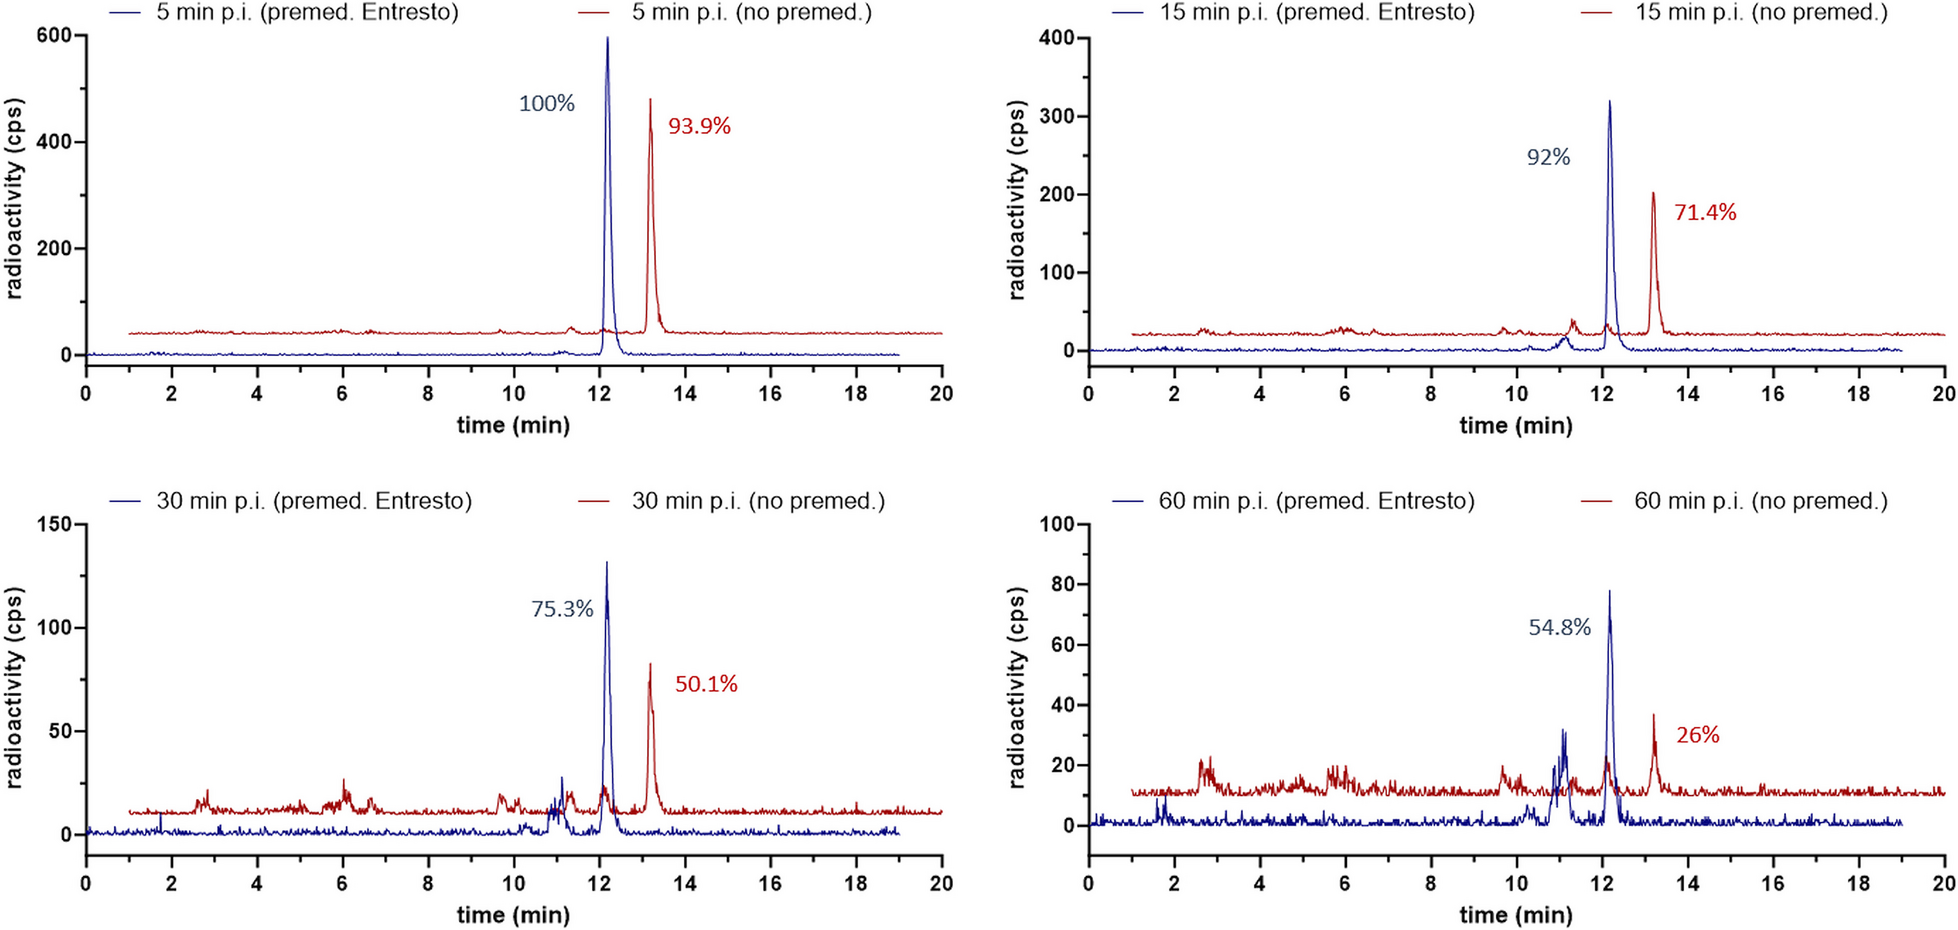
Biodistribution study and metabolite analysis in ratsA biodistribution study and metabolite analysis was carried out in healthy male Wistar rats (214 ± 15 g, Charles River, Germany). Rats were injected with 21 ± 15 MBq of [11C]LR111 in the tail vein under isoflurane anaesthesia (2% in O2 at 1 L min−1). Rats were sacrificed under similar isoflurane anaesthesia by exsanguination and dissected at 5, 15, 30 and 60 min post injection (p.i.) (n = 4 per time point). Rats were injected with 14 ± 5 MBq [18F]EW-7197 in the tail vein under isoflurane anaesthesia (2% in O2 at 1 L min−1). Rats were sacrificed under similar isoflurane anaesthesia by exsanguination and dissected at 5, 15, 30 and 45 min post injection (p.i.) (n = 4 per time point). Blood, heart, lungs, liver, kidneys, urine, bone and brain were collected, weighed and counted for radioactivity (Wallac 1210 Compugamma, PerkinElmer, Waltham, MA, USA). Biodistribution data were expressed as percentage injected dose per gram tissue (%ID·g−1) ± standard error of the mean (SEM). Blood at 15 min and 60 min p.i. ([11C]LR111) and blood at 15 min and 45 min p.i. ([18F]EW-7197), withdrawn from the abdominal aorta, (~ 7 mL) was collected in a heparin coated tube and centrifuged at 5000 rpm to separate plasma from blood cells (Hettich universal 32, Andreas Hettich GmbH & Co. KG, Tuttlingen, Germany). Solid phase extraction (SPE) cartridges (tC2, Waters, Ettenleur, The Netherlands) were preconditioned by washing with 6 mL MeOH and 2 × 6 mL H2O. Plasma (1 mL) was mixed with 6.0 M HCl (50 µL) and loaded on the SPE cartridge (> 99% recovery). The polar metabolite fraction was obtained by eluting the SPE cartridge with H2O (3 mL), the non-polar fraction by subsequent elution with MeOH (2 mL) and H2O (1 mL). Fractions were counted for radioactivity (Wallac 1210 Compugamma, PerkinElmer, Waltham, MA, USA). The percentage of intact tracer in the non-polar fraction was determined by online HPLC analysis on a Dionex (Sunnyvale, CA, USA) UltiMate 3000 HPLC equipment with Chromeleon software (version 6.8) equipped with a Gemini C18 column (5 μm, 10 × 250 mm, Phenomenex, Torrance, CA, USA) with a mixture of MeCN (A) and 0.1% TFA in water (B) as eluent according to the following scheme 0 min: 90% B; 12 min 15% B; 8 min 90% B at 3.5 mL.min−1 [11C]LR111 Rt = 10.7 min and [18F]EW-7197 Rt = 9.2 min. Results were expressed as percentage of intact tracer, polar metabolites and non-polar metabolites ± SEM (n = 4 for each time point).
Echocardiography and haemodynamicsOn the first day of the scanning sessions, all animals underwent echocardiographic assessments to measure right ventricular wall thickness (RVWT), right ventricular end diastolic diameter (RVEDD), tricuspid annular plane systolic excursion (TAPSE), cardiac output (CO) and estimated right ventricular systolic pressure (eRVSP), as published previously [26].
PET imagingDynamic PET imaging was performed with NanoPET/CT and nanoPET/MR 1 T scanners (Mediso Ltd., Hungary, Budapest) with identical PET components [27]. All injections were performed via a tail vein catheter. Rats were anesthetized with 4 and 2% isoflurane in 1 L·mL−1 oxygen for induction and maintenance, respectively. Rats were positioned on the scanner bed and the respiratory rate was monitored for the duration of the experiment, adjusting anaesthesia when required. Animals first underwent a computed tomography (CT) or magnetic resonance imaging (MRI) scan to keep the isoflurane exposure as low as possible (see Fig. 2 for the set-up of the experiment). All tracer injections were performed via a tail vein catheter using 4 and 2% isoflurane in 1 L min−1 oxygen for induction and maintenance, respectively (see Table 1 for animal weights and injected doses). Dynamic PET scans, starting at the time of tracer administration, were acquired for 60 min. Immediately after the [11C]LR111 scan, a bolus injection of [18F]EW-7197 was administered, in order to minimize the time that rats were exposed to isoflurane, and another dynamic PET scan was acquired. All animals received a baseline scan with [11C]LR111 and [18F]EW-7197 at day 1. At day 2, all animals received SB431542 30 min prior the injection of [11C]LR111. In addition, the control group received a cyclosporine A (Sigma-Aldrich, Zwijndrecht, The Netherlands) injection at day 3, 30 min prior to the injection of [11C]LR111. Finally, at day 4, SB431542 and cyclosporine A injections were administered 30 min prior to the injection of [11C]LR111. After these scanning experiments, the animals were sacrificed by cervical dislocation. Lung tissues were removed from MCT (n = 3), SuHx (n = 3) and healthy rats (n = 3). They were filled with 50% Tissue-Tek (VWR, Amsterdam, The Netherlands) and 50% physiological salt and snap frozen in liquid nitrogen. Positron emission scans were acquired in list mode and rebinned into the following frame sequence: 4 × 5, 4 × 10, 2 × 30, 3 × 60, 2 × 300, 1 × 600, 1 × 900 and 1 × 1200 s. The scans were reconstructed with a spatial resolution of 0.4 mm and were corrected for attenuation and scatter. The scans of the first 30 s were combined to correct for injection speed differences. Images were analysed using the freely available software AMIDE, version 1.0.4 (http://amide.sourceforge.net/). Regions of interest were drawn with a diameter of at least 4 mm in the lungs remote from the liver and heart, in order to avoid spill-over from these organs. Uptake was expressed as standard uptake values (SUV), which was calculated according to the following equation:
$$} = \left[ }/}} \right]/}$$
Fig. 2
Experimental set-up of the PET scanning study
Table 1 Injected doses of [18F]EW-7197, [11C]LR111, SB431542, cyclosporine and animal weights of each experimental groupError bars indicate standard deviation. Statistical analysis was performed using Graphpad PRISM (v 5.02, Graphpad Software Inc). Lung uptake in the control group was compared with uptake in the diseased animals with a one-tailed unpaired t-test. Differences were considered significant if p < 0.05. The representative PET images were generated using VivoQuant2020.
留言 (0)