
記住我


AMD is a progressive neurodegenerative disease characterized by reduced retinal pigment epithelium (RPE) function and loss of photoreceptors in the macula (Fritsche et al., 2016). By 2040, there will likely be 288 million AMD patients worldwide (Wong et al., 2014). Between 6 and 9 percent of blindness worldwide is caused by AMD, which is also the leading cause of blindness in developed countries (Wong et al., 2014; Jonas et al., 2017; Keenan et al., 2021). AMD is divided into early, intermediate, and late stages. In the first two stages, the visual symptoms are typically absent or mild. Late-stage AMD involves two forms: geographic atrophy (GA) and choroidal neovascularization (CNV), though the two manifestations are not mutually exclusive (Keenan et al., 2021; Ung et al., 2021). Either form of late AMD can lead to vision distortion and/or vision loss (Wong et al., 2014; Keenan et al., 2021). Until now, understanding of the disease biology and therapeutic options are limited (Fritsche et al., 2014; Fritsche et al., 2016). Age, genetics, and environmental factors are all expected to cause the disease in a complex interactive way (Keenan et al., 2021). Previous research has identified susceptibility SNPs and genes for the development of late-stage AMD (Fritsche et al., 2013; Kvale et al., 2015; Fritsche et al., 2016). However, the current identified genetic biomarkers only explained a small portion of the disease variability. It would be extremely helpful to identify novel biomarkers pertinent to late-stage AMD for a better understanding of the disease etiology and for developing new tools to aid accurate prognostic and precision treatment.
A recent landmark genome-wide association study (GWAS) has identified 52 independently associated variants across 34 susceptibility loci for AMD by comparing the late-stage AMD patients and unaffected controls of European ancestry (Fritsche et al., 2016). Even though GWAS is a very effective method for identifying SNPs associated with diseases, the majority of GWAS research selects significant biomarkers based on single marker approaches, where each SNP is evaluated separately for its marginal correlation with the outcome. As a result, the correlation spectrum between SNPs across the genome is ignored, and only SNPs with strong marginal effects can be selected. In Fritsche et al. (2016), the 52 identified variants explained only 27.2% of the disease variability. Recent studies have shown that incorporating inter-feature correlations/connections can help identify novel genetic biomarkers and improve outcome prediction accuracy (Li, 2019; Li et al., 2019a; Li et al., 2019b). This suggests that we might be able to discover new AMD variants and explain more disease variability by exploring and integrating the genome-wide correlation/connectivity patterns into the GWAS. Following Li (2019); Li et al. (2019b), we term the variants that cannot be directly detected but would exhibit significant differentiating effects after taking into consideration of their correlations/connections to other genome-wide significant SNPs as the marginally weak SNPs, or weak SNPs. In this paper, we aim to detect weak SNPs for late-stage AMD, investigate their biological function, and confirm whether they can help to improve disease prediction.
We use linkage disequilibrium (LD) as the metric to measure the inter-SNP correlations. In genetics, “LD” refers to the non-random correlations between alleles at different loci (Slatkin, 2008). It has been used to determine correlated disease-related SNP sets and is a crucial metric for determining inter-SNP interaction (Carlson et al., 2004). The squared correlation, or r2 statistic, which spans from 0 to 1, is one of the most widely used LD metrics. A higher r2 value indicates a stronger correlation between two SNPs. In this study, we use r2 to explore the whole-genome LD spectrum. For each genomewide significant SNP identified from a GWA scan, we detect its high-LD connected SNP cluster using connected component searching algorithms (Li et al., 2019b; Li, 2019), such that any pair of SNPs within the same cluster are connected through a path of high LD links. A marginally weak SNP can be then selected based on not only its own marginally differentiating effect but also how many other SNPs within the cluster it connects to and the disease-differentiating capabilities of those connected SNPs (Li et al., 2019b).
2 Materials and methods2.1 DataInternational Age-Related Macular Degeneration Genomics Consortium (IAMDGC) has collected genetic data from AMD patients and control subjects across 26 different studies. IAMDGC dataset is by far the largest-scaled AMD GWAS dataset (Fritsche et al., 2016). In this study, we used a total of 27,301 unrelated individuals of European ancestry in the IAMDGC dataset, including 14,590 late-stage AMD patients with GA and/or CNV and 12,711 normal controls. Genotypes and phenotypes for these 27,301 samples were downloaded from NCBI dbGap database.
Our analysis included a total of 5,002,684 common SNPs from chromosomes 1 through 22 with minor allele frequency (MAF) larger than 0.1. Each SNP is coded by its number of minor alleles (0, 1, or 2). It is known from previous studies that this sample population does not contain an obvious heterogeneous structure. We also carried out a principal component analysis (PCA). The PCA results showed no obvious population structures. We calculated the kinship matrix using 100,000 randomly sampled SNPs across the whole genome. The absolute values of the KING-robust estimators on 100,000 randomly chosen sub-principal matrices were very small (mean = 0.0077, standard deviation = 0.0081). All the above evidence suggests that the samples used in our study are independent. Following previous studies using the same data cohort (Fritsche et al., 2016), we did not adjust for PC scores in our study. The missing genotype values were imputed by the means of the non-missing ones. There are 2.1% of the participants older than 90 years. We capped their ages at 90 in the analysis. There are 0.4% of the samples with missing ages and their ages were imputed by the average age of non-missing subjects.
3 Methods3.1 NotationDenote the observed data matrix by Xn×p, where n is the number of subjects and p is the total number of features. We use Xj to denote the length-n sample vector for feature j, j = 1, … , p. Let y denotes the length-n vector of outcome class labels, and yi denotes the class indicator for subject i, i = 1, … , n. We use nk to denote the size of class k, k = 0, 1, where k = 0 for normal controls and k = 1 for late-stage AMD patients.
3.2 Detection of marginally strong SNPsMarginal Student t-tests were used to select marginally strong signals. Specifically, for each SNP j, j = 1, … , p, we calculated
T̂j=X̄j1−X̄j0/sΔ,(1)where X̄j[1]=∑Yi=1Xi,jn1, X̄j[0]=∑Yi=0Xi,jn0 and sΔ=∑∑(Xi,j−X̄j[k])2/n0+n1. SNPs with p-values less than 5 × 10⁻⁸ were selected as the marginally strong SNPs.
3.3 Detection of high-LD connected SNP clustersWe used PLINK 1.9 (Purcell et al., 2007), a tool set for whole-genome association and population-based linkage analyses, to calculate r2 values for all SNPs on each chromosome. We then thresholded r2 values at 0.7 so that only SNPs in high LD were considered connected and included in the downstream analyses. For each marginally strong SNP, we employed the connected component searching algorithms in Li (2019); Li et al. (2019b) to detect the cluster of SNPs each of which is connected to the strong SNP through a path of high-LD links. Suppose there are B such clusters detected, we denote those clusters by Cl, where l = 1, … , B.
3.4 Detection of marginally weak SNPsLD-adjusted effect sizes were then calculated for SNPs in the detected connected components. Specifically, for each Cl, l = 1, … , B, we calculated the multivariate t-statistic by T̂Clld=Ω̂ClX̄j[1]−X̄j[0], where Ω̂Cl=Σ̂Cl−1 is the inverse of the LD matrix Σ̂Cl on component Cl. Ω̂Cl characterizes the LD connections between SNPs in Cl. For each SNP j in Cl, its LD-adjusted differentiating statistic is the corresponding entry in T̂Clld
T̂jld=∑j′∈clΩ̂Cljj′X̄j1−X̄j0.(2)The greater the magnitude of T̂jld is, the higher power SNP j has in differentiating the diseases and controls after integrating the LD information with its connected SNPs. Marginally weak SNPs were selected based on |T̂jld|. It should be noted that the calculation of the connection matrix Ω is essential for marginally weak signal detection (Li et al., 2019b). For an ultra-high dimensional association study like a GWAS, it is impossible to directly calculate Ω̂ for all SNPs. By leveraging the marginal LD information, we were able to break it down to locally connected components Cls, which were of much smaller sizes, thus making the calculation feasible. Not every SNP within an LD-connected cluster would necessarily be informative for classification. Only the top 1,000 SNPs with the greatest |T̂jld| values, aside of the strong SNPs, were selected as the marginally weak SNPs. The optimal hyperparameter value of 1,000 was chosen by a cross-validation procedure.
3.5 Calculating p-values for selected SNPsTo evaluate the statistical significance of the selected SNPs, a post-selection non-parametric permutation test was performed. We first constructed a permutation dataset by re-sampling (with replacement) the class labels but keeping the genotype matrix unchanged. We kept the detected strong SNP set and the connected components unchanged to preserve the connection patterns. We then recalculated the statistics Tjld using the original Ω̂Cl, and X̄j[1] and X̄j[0] recalculated from the permuted dataset. An empirical null distribution of T̂jcl,(m), m = 1, … , M, was then generated by repeating the process M = 120,000 times. The percentage of the occurrences that the permuted statistics |T̂jcl,(m)| were equal to or more extreme than the observed statistics |T̂jld| (evaluated from the original non-permuted dataset) was defined to be the permutation test p-value for each selected SNP j. Last, to further control for the family-wise error rate, a Bonferroni correction was made for all selected SNPs.
3.6 Functional enrichment analysisAll SNPs in the analysis were first mapped onto genes in the Human Genome GRCh37/hg19 assembly using the R package “biomaRt” (Durinck et al., 2009). A SNP not in any gene region was mapped to its closest nearby gene containing it within its 2 kb upstream/downstream ranges. Functional enrichment analysis was then performed to validate the association of the selected SNPs with AMD from a system biology perspective. Ingenuity Pathway Analysis (IPA, QIAGEN, Inc.) was used to identify the significantly enriched canonical pathways. Fisher’s exact test p-values were provided for each canonical pathway. A pathway with a p-value less than 0.01 was considered a significantly enriched pathway.
For each significantly enriched pathway, we reported its leading-edge genes. Leading edge genes can be viewed as the pivot genes in the pathway because of which the pathway got enriched (Subramanian et al., 2005). We evaluated how the leading-edge genes of the enriched pathways overlapped with selected genes. A greater overlap indicates more compelling evidence of the biological functions of the selected genes/SNPs on AMD.
3.7 Late-stage AMD predictionWe fitted a logistic regression with a Lasso penalty and the selected marginally strong and weak SNPs for outcome prediction. We included age and gender as adjusting covariate variables.
The whole analysis pipeline is summarized in Algorithm 1.
Algorithm 1. Procedure for detecting strong and weak signals and late-stage AMD classification.
1: Marginally strong SNPs: From marginal t-tests.
2: LD connected SNP clusters: For each strong SNP, detecting its high-LD connected SNP clustered by searching for its connected component in the thresholded LD matrix.
3: Marginally weak SNPs: Detected by ranking the LD-adjusted statistics |T̂Clld|=|Ω̂ClX̄j[1]−X̄j[0]|.
4: Functional enrichment analysis.
5: Late-stage AMD prediction: Prediction using Lasso-logistic regression with selected SNPs and adjusting covariates.
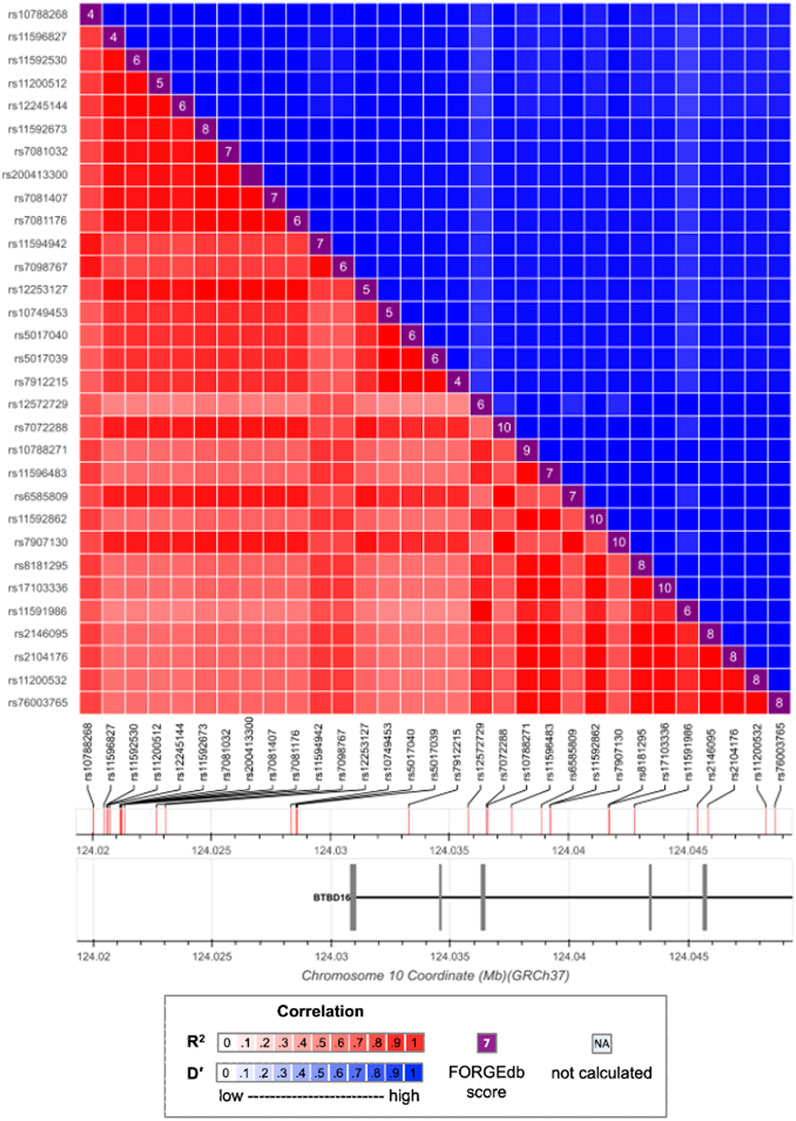
4 Results4.1 Selected candidate SNPs and associate genesVariants selection was conducted on each of the 22 autosomes separately. There were 4,679 genome-wide significant SNPs detected as the marginally strong SNPs, of which 26 had been reported by Fritsche et al. (2016). We further detected 3,446 high-LD connected SNPs, each of which had an r2 > 0.7 with at least one of the marginally strong SNPs. Those 3,446 SNPs were clustered within 410 connected components. Figure 1 shows an example connected component of 32 SNPs, out of which 14 were marginally strong SNPs and 1 was eventually selected as marginally weak SNPs. After the final filtering, the top 1,000 SNPs out of those 3,446 with the greatest |T̂Clld| values were selected as the marginally weak SNPs. Altogether, there were 5,679 SNPs (4,679 marginally strong and 1,000 marginally weak) selected as the informative SNPs. Those 5,679 SNPs were then mapped to 197 gene regions, with 99 genes mapped by marginally strong SNPs only, 35 genes mapped by marginally weak SNPs only, and 63 genes mapped by both marginally strong and weak SNPs (Supplementary Table S1).
FIGURE 1. LD pattern between strong and weak SNPs. Marginally strong SNPs: rs57581057, rs10788268, rs11594942, rs7098767, rs12572729, rs10788271, rs11596483, rs8181295, rs17103336, rs11591986, rs2146095, rs2104176, rs11200532, rs76003765. Marginally weak SNP: rs790713.
In Figure 1, the marginally weak SNP rs7907130 has a marginal p-value = 1.124 × 10⁻⁴. As a result, it is likely to be missed from downstream fine mappings in a conventional GWAS. However, Once the LD information is integrated, SNP rs7907130 has the most significant permutation test p-value among all the 32 SNPs. Therefore, its predictive effect is manifested through integrating its LD connections with the strong SNPs. Moreover, SNP rs7907130 was mapped to a previously identified gene BTBD16 (Strunz et al., 2020a) together with the other strong SNPs. It could potentially be a new AMD susceptibility locus.
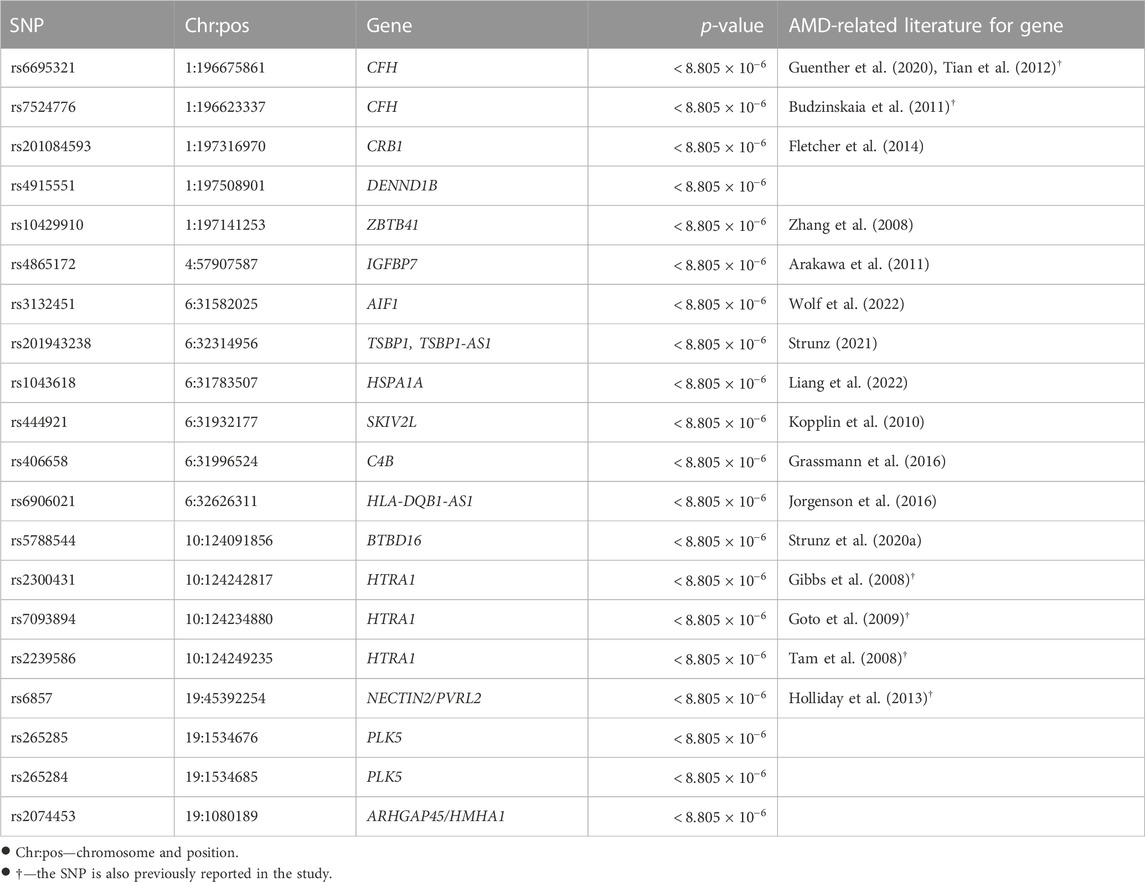
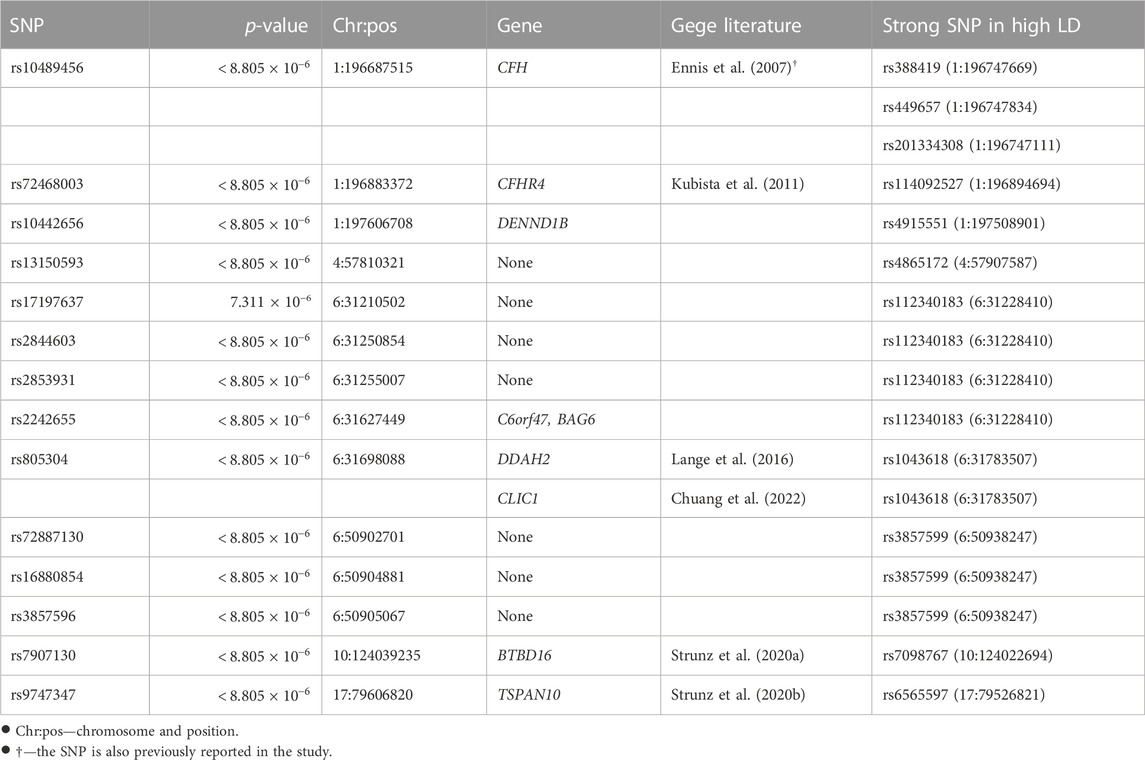
4.2 Statistically significance for selected SNPs and genesPost-selection inference was made for the 5,679 SNPs selected. A Bonferroni correction gave a family-wise significance level of 8.805 × 10⁻⁶ (= 0.05/5, 679). Based on the permutation test results, 55 out of the 4,679 selected marginally strong SNPs (Table 1 and the full list in Supplementary Table 4) and 13 out of the 1,000 selected marginally weak SNPs (Table 2) were statistically significant with a permutation p-value <8.805×10⁻⁶. Table 1 gives the detailed test results for the top marginally strong SNPs and their mapped genes. Table 2 gives the detailed test results for the significant marginally-weak SNPs and their mapped genes.
TABLE 1. Permutation p-values of selected marginally strong SNPs and their mapped genes.
TABLE 2. Permutation p-values of selected marginally weak SNPs and their mapped genes.
The majority of the detected SNPs and their mapped genes had been reported to be associated with AMD previously. However, five new genes have been identified in our study as the potentially novel susceptibility genes for late-stage AMD: DENND1B, PLK5, ARHGAP45/HMHA1, C6orf47, and BAG6.
DENND1B (differentially expressed in normal versus neoplastic domain containing 1B) is mapped by one marginally strong and one marginally weak SNP. Chronic inflammatory illnesses like asthma (Sleiman et al., 2010), inflammatory bowel disease (Lees et al., 2011), and primary biliary cirrhosis (Mells et al., 2011) have been reported associated with this gene. The disease pathogenesis involves the DENND1B encoded protein and its interaction with tumor necrosis factor α (TNF-α) (Sleiman et al., 2010). Although DENND1B has not been directly linked to AMD, it may play a similar role in AMD pathogenesis through inflammation related to TNF-α, which is a pro-inflammatory cytokine contributing to inflammation-associated angiogenesis and CNV (Jasielska et al., 2010; Khan et al., 2021). ARHGAP45 (rho GTPase activating protein 45) or HMHA1 (minor histocompatibility antigen 1) is mapped by one marginally strong SNP. It controls endothelial integrity, whereas endothelial barrier dysfunction can lead to uncontrolled leaks or edema (Amado-Azevedo et al., 2018). In CNV, aberrant blood vessels leak fluid or blood into the retina. ARHGAP45 may contribute to AMD by regulating the endothelial barrier function of blood vessels. PLK5 (polo-like kinase 5) is associated with two marginally strong SNPs. It can induce genotoxic stress and DNA damage (Andrysik et al., 2010), which is one of the underlying mechanisms of AMD. Additionally, PLK5 is specifically expressed in the eye (de Cárcer et al., 2011) and is a candidate gene modulating the proper development and function of mice eyes (Chiang et al., 2020).
BAG6 (BAG Cochaperone 6) and C6orf47 (chromosome 6 open reading frame 47) are mapped by one significant marginally weak SNP. BAG6 gene is found to be a component of a cluster of immune-relevant genes located within the human major histocompatibility complex class (MHC) III region (Banerji et al., 1990). BAG6 encodes a multifunctional protein. For instance, the protein is required for the acetylation of p53 in response to DNA damage (Binici and Koch, 2014), which is believed to be involved in the RPE cell death in AMD (Bhattacharya et al., 2012; Vuong et al., 2012). C6orf47 gene has been reported related to inflammatory diseases (Harney et al., 2008; Goudey et al., 2017). However, its biological functions remain unclear (Ren et al., 2015) and require further investigation.
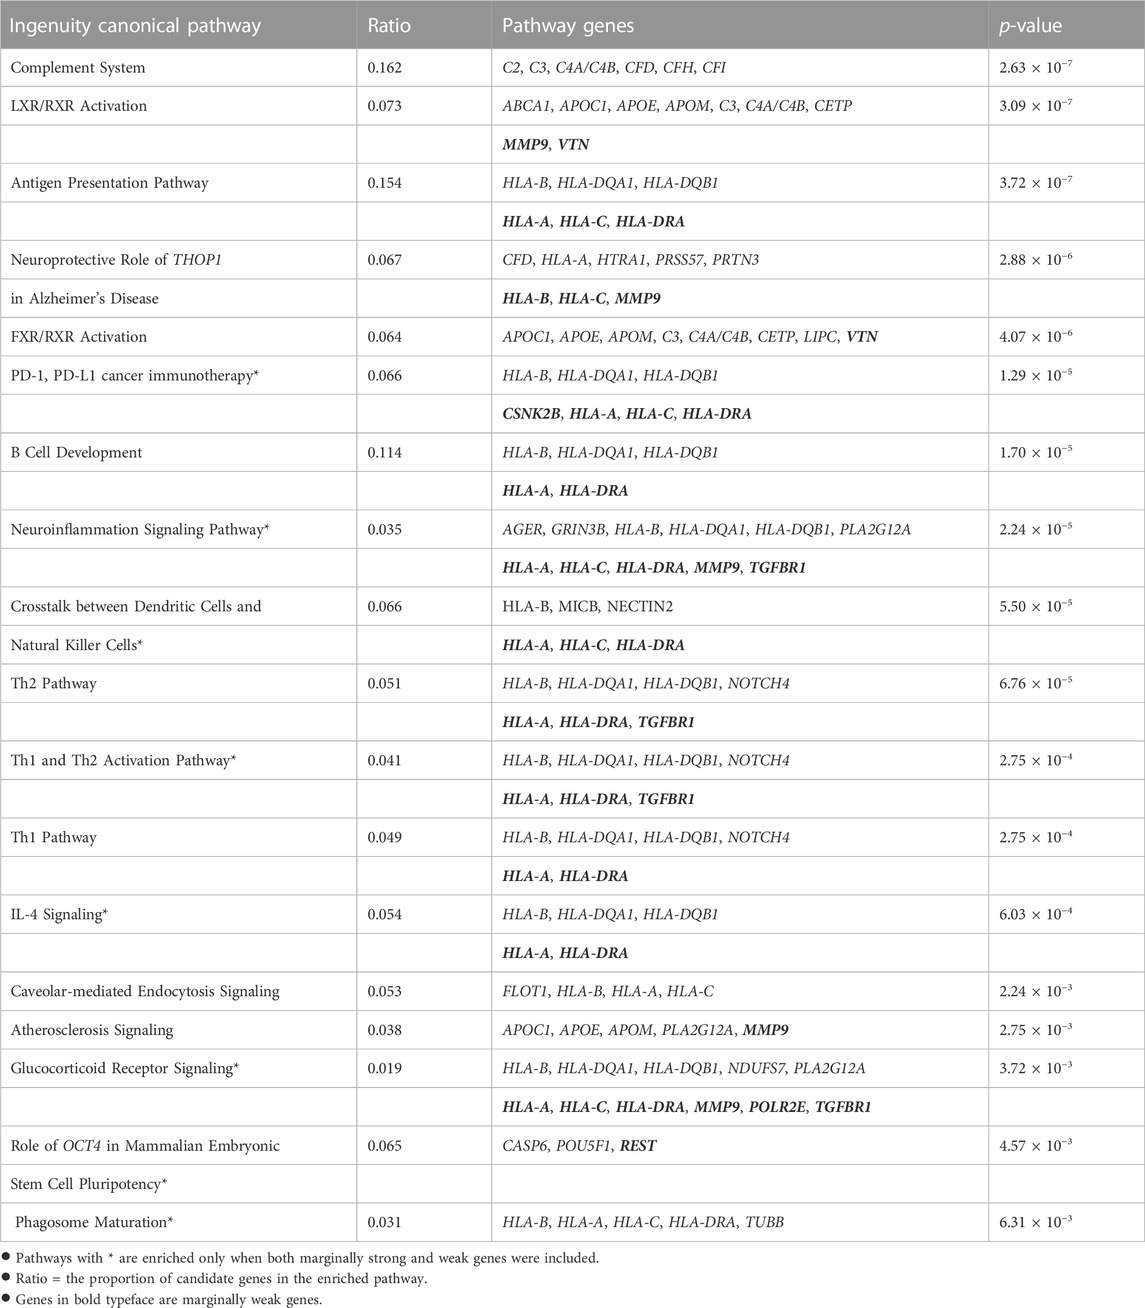
4.3 Functional enrichment analysesWe further conducted two functional enrichment analyses to verify the biological functions of the selected genes, especially the 35 genes mapped from marginally weak SNPs. We examined two candidate gene lists. One list consists of all the 197 genes mapped by both marginally strong and marginally weak SNPs. The other list consists of 162 genes mapped from marginally strong SNPs only. IPA software was used for the enrichment analyses. Any differences between the results from the two enrichment analyses should be due to the marginally weak genes and can help reveal the biological significance of these weak genes. Table 3 summarizes all enriched pathways identified by the two gene lists with a p-value of <0.01. Nine canonical pathways were significantly enriched by both candidate gene lists. Another nine canonical pathways were significantly enriched only when marginally weak genes were included.
TABLE 3. Enriched canonical pathways from Ingenuity Pathway Analysis (IPA).
All nine canonical pathways enriched by both gene lists had been reported in the AMD literature, including the complement system (Anderson et al., 2010; Ishikawa et al., 2016; Potilinski et al., 2021), the antigen presentation (Ambati et al., 2013; Potilinski et al., 2021), the LXR/RXR activation (Mukwaya et al., 2018; Choudhary et al., 2020) and the FXR/RXR activation (Kurji et al., 2010) pathways. These results agree with the current knowledge that AMD is associated with inflammatory response, which requires the accumulation of various immune cells and cytokines in the eye (Tan et al., 2020). Additionally, leading-edge gene THOP1 in the Alzheimer’s disease pathway, which is significantly enriched, is known to have a neuroprotective role. The elevated expression of thimet oligopeptidase (THOP1) is a neuroprotective response to amyloid-β (Aβ), a major component of Alzheimer’s disease plaques that may cause increased neuronal death (Pollio et al., 2008). This is consistent with the fact that Aβ also presents in the drusen of AMD patients (Pollio et al., 2008). Multiple studies indicated that atherosclerosis is a risk factor for AMD (Vingerling et al., 1995; van Leeuwen et al., 2003; Logue et al., 2014). The atherosclerosis signaling pathway was significantly enriched in our study and other studies (Fritsche et al., 2013; Zhang and Zhou, 2020). This supported the hypothesis that AMD and atherosclerosis may share common pathogenic pathways (Chau et al., 2008).
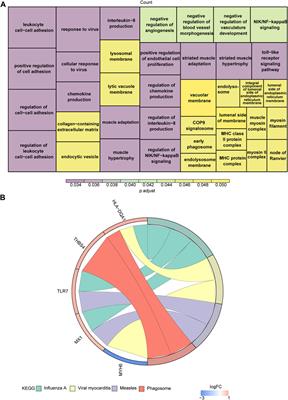
For the list with marginally weak genes, nine more canonical pathways were significantly enriched, including those involved in immune responses and inflammatory activities, in crosstalk between dendritic cells, Th1 and Th2 activation, and natural killer cells IL-4 Signaling. The neuroinflammation signaling pathway became significantly enriched by adding the marginally weak genes. Leading-edge genes in this pathway include HLA-A, HLA-C, HLA-DRA, MMP9, and TGFBR1. This finding is in line with earlier research that suggested neuroinflammation is involved in late-stage AMD (Buschini et al., 2011; Racic et al., 2021). By incorporating the weak genes CSNK2B, HLA-A, HLA-C, and HLA-DRA, the PD-1, PD-L1 cancer immunotherapy pathway was significantly enriched. This may be due to the fact that programmed death receptor-1 (PD-1) and its ligand PD-L1 play critical roles in the immune response and autoimmunity beyond cancer (Qin et al., 2019), including preserving the retinal immunosuppressive micro-environment (Chen et al., 2009). Marginally weak genes HLA-A, HLA-C, HLA-DRA, MMP9, POLR2E, TGFBR1 were responsible for the enrichment of the glucocorticoid receptor signaling pathway. Glucocorticoid receptor is associated with anti-inflammatory properties and may play a crucial role in late-stage AMD progression (Jin et al., 2017). A synthetic glucocorticoid called triamcinolone is used to treat people with CNV-type AMD, according to Becerra et al. (2011). With marginally weak gene REST, the Role of OCT4 in mammalian embryonic stem cell pluripotency pathway can be validated. OCT4, also known as Pou5f1, is important for maintaining and regaining stem cell pluripotency. According to a recent study, human embryonic stem cells (hESCs) can encourage the retro-differentiation of Müller cells in the retina into retinal progenitor cells by regulating the expression of OCT4 in these cells (Ke et al., 2021). This also indicates that stem cells may provide a new option for treating AMD (Parameswaran and Krishnakumar, 2017; Ke et al., 2021). The enriched phagosome maturation pathway is in concordance with the facts that efficient RPE phagosome maturation is crucial for retinal health and homeostasis, and that the delay in maturation is related to the accumulation of debris in the RPE and AMD (Gordiyenko et al., 2010; Wavre-Shapton et al., 2013; Kwon and Freeman, 2020).
We also conducted a gene set enrichment analysis (GSEA) using the curated gene sets in Molecular Signature Database (MSigDB v7.5.1 c2). Multiple gene sets linked to AMD-related phenotype changes or biological processes were enriched. They include extracellular matrix organization, complement system, lipid metabolism, immune, and inflammation responses (Supplementary Table S6). Marginally weak genes (REEP6, HLA-A, TGFBR1, POLDIP2, MMP9, and VTN) are confirmed as leading edge genes within the AMD-related gene sets, including “GOBP: activation of the immune response,” “GOCC: photoreceptor inner segment,” “HP: choroidal neovasularization,” “HP: macular degeneration” among others. These serve to further illustrate the role that marginally weak genes have significant co-regulatory effects, even no significant differentiating effects, in the onset and course of the disease. Identification of these weak signals could provide new insights into a better understanding of the underlying disease mechanisms.
4.4 Prediction model based on selected SNPsFor prediction, we applied a five-fold cross-validation, where the whole dataset was partitioned into five folds of sub-datasets with similar sample sizes. In each round of cross-validation, we aggregated four folds of data into a training set for model training. We used the remaining fold as the test set for AMD status prediction. Through the five rounds of cross-validations, each sample in the original dataset would have been predicted once. Prediction performance was evaluated by comparing the predicted labels to the observed ones.
Our method, which takes into account both weak and strong signals, has a prediction accuracy of 0.769 with an area under the receiver operating characteristic curve (AUC) of 0.768. With only the 4,679 marginally strong SNPs, it achieves a prediction accuracy of 0.732 and an AUC of 0.730. This demonstrated that marginally weak signals could help to improve the prediction performance.
5 DiscussionOur study employed a novel machine-learning method to detect marginally weak variants in a GWAS. By exploring and integrating the genome-wide LD spectrum into GWAS, we were able to detect novel susceptibility genes for AMD and explain more disease variability. The previously identified genes like BTBD16, C3, CFH, CFHR3, HTARA1) were confirmed in our study. Novel AMD-related genes DENND1B, PLK5, ARHGAP45, and BAG6 were detected as weak signals. More AMD-related biological pathways were enriched when marginally weak signals were considered.
For the effect size estimates of the selected SNPs, compared to the marginal approaches, the estimates from our approach would be closer to their oracle estimates, which are the estimates from fitting a joint model assuming one knew prior to the analysis the subset of true causal SNPs (Li et al., 2019b). It is possible that a marginally strong SNP turns out to have a weak joint effect. Such SNPs would be false positive findings in conventional GWA studies. Our approach diminishes such cases.
In our approach, each weak signal detected must have a high-LD path linking it to some marginally strong SNPs. It is cognizant that other than linking to strong signals, some weak signals work together by themselves as a group to exude their overall predictive effect on the outcomes, such as a group of rare variants (Li and Leal, 2008). Our approach would not detect such groups of weak signals. It is promising to combine our approach with the rare variant grouping methods in GWA studies. We will investigate this in future studies.
Our weak variants detection method can be directly applied to GWA studies with other types of trait variables: continuous, ordinal, counting, and survival outcomes. We envision its wide range of applications.
Data availability statementPublicly available datasets were analyzed in this study. Genotypes and phenotypes for the samples analyzed in this study can be accessed at https://www.ncbi.nlm.nih.gov/projects/gap/cgi-bin/study.cgi?study_id=phs001039.v1.p1. R codes for the analysis pipeline can be downloaded at https://github.com/XuepingZhou/mLDA_Pipeline.
Ethics statementEthical review and approval was not required for the study on human participants in accordance with the local legislation and institutional requirements. The patients/participants provided their written informed consent to participate in this study.
Author contributionsXZ, YD, YL, WC conceived and designed the study. JZ was responsible for data management and data preprocessing. XZ was responsible for data cleaning, data analysis, and interpretation. XZ wrote the paper. XZ, YL, WC, and HH contributed to the additional analysis in the revision of the paper. All authors read and approved the final article.
FundingThis study was supported by the National Institutes of Health (R01GM141076, R21EY030488, and R01EB034116) and National Science Foundation (Award number 2225775). This research is supported in part by the University of Pittsburgh Center for Research Computing through the resources provided. Specifically, this work used the HTC cluster, which is supported by NIH award number S10OD028483, and the H2P cluster, which is supported by NSF award number OAC-2117681.
AcknowledgmentsWe thank the participants of all the studies included for enabling this research and strengthening our understanding of AMD genetics through their participation. We appreciate the International AMD Genomics Consortium for aggregating genetic data from research groups around the world, performing quality checks, and making the data available on dbGAP.
Conflict of interestThe authors declare that the research was conducted in the absence of any commercial or financial relationships that could be construed as a potential conflict of interest.
Publisher’s noteAll claims expressed in this article are solely those of the authors and do not necessarily represent those of their affiliated organizations, or those of the publisher, the editors and the reviewers. Any product that may be evaluated in this article, or claim that may be made by its manufacturer, is not guaranteed or endorsed by the publisher.
Supplementary materialThe Supplementary Material for this article can be found online at: https://www.frontiersin.org/articles/10.3389/fgene.2023.1075824/full#supplementary-material
ReferencesAmado-Azevedo, J., Reinhard, N., van Bezu, J., van Nieuw Amerongen, G., van Hinsbergh, V., and Hordijk, P. (2018). The minor histocompatibility antigen 1 (hmha1)/arhgap45 is a racgap and a novel regulator of endothelial integrity. Vasc. Pharmacol. 101, 38–47. doi:10.1016/j.vph.2017.11.007
CrossRef Full Text | Google Scholar
Anderson, D. H., Radeke, M. J., Gallo, N. B., Chapin, E. A., Johnson, P. T., Curletti, C. R., et al. (2010). The pivotal role of the complement system in aging and age-related macular degeneration: Hypothesis re-visited. Prog. Retin. eye Res. 29, 95–112. doi:10.1016/j.preteyeres.2009.11.003
PubMed Abstract | CrossRef Full Text | Google Scholar
Andrysik, Z., Bernstein, W. Z., Deng, L., Myer, D. L., Li, Y.-Q., Tischfield, J. A., et al. (2010). The novel mouse polo-like kinase 5 responds to dna damage and localizes in the nucleolus. Nucleic acids Res. 38, 2931–2943. doi:10.1093/nar/gkq011
PubMed Abstract | CrossRef Full Text | Google Scholar
Arakawa, S., Takahashi, A., Ashikawa, K., Hosono, N., Aoi, T., Yasuda, M., et al. (2011). Genome-wide association study identifies two susceptibility loci for exudative age-related macular degeneration in the Japanese population. Nat. Genet. 43, 1001–1004. doi:10.1038/ng.938
PubMed Abstract | CrossRef Full Text | Google Scholar
Banerji, J., Sands, J., Strominger, J. L., and Spies, T. (1990). A gene pair from the human major histocompatibility complex encodes large proline-rich proteins with multiple repeated motifs and a single ubiquitin-like domain. Proc. Natl. Acad. Sci. 87, 2374–2378. doi:10.1073/pnas.87.6.2374
PubMed Abstract | CrossRef Full Text | Google Scholar
Becerra, E. M., Morescalchi, F., Gandolfo, F., Danzi, P., Nascimbeni, G., Arcidiacono, B., et al. (2011). Clinical evidence of intravitreal triamcinolone acetonide in the management of age-related macular degeneration. Curr. drug targets 12, 149–172. doi:10.2174/138945011794182746
PubMed Abstract | CrossRef Full Text | Google Scholar
Bhattacharya, S., Chaum, E., Johnson, D. A., and Johnson, L. R. (2012). Age-related susceptibility to apoptosis in human retinal pigment epithelial cells is triggered by disruption of p53–mdm2 association. Invest. Ophthalmol. Vis. Sci. 53, 8350–8366. doi:10.1167/iovs.12-10495
PubMed Abstract | CrossRef Full Text | Google Scholar
Budzinskaia, M., Pogoda, T., Generozov, É., Chikun, E., Shchegoleva, I., Kazarian, É., et al. (2011). Influence of genetic mutations on clinical presentation of subretinal neovascularization. report 1: The impact of cfh and il-8 genes polymorphism. Vestn. Oftalmol. 127, 3–8.
Buschini, E., Piras, A., Nuzzi, R., and Vercelli, A. (2011). Age related macular degeneration and drusen: Neuroinflammation in the retina. Prog. Neurobiol. 95, 14–25. doi:10.1016/j.pneurobio.2011.05.011
PubMed Abstract | CrossRef Full Text | Google Scholar
Carlson, C. S., Eberle, M. A., Rieder, M. J., Yi, Q., Kruglyak, L., and Nickerson, D. A. (2004). Selecting a maximally informative set of single-nucleotide polymorphisms for association analyses using linkage disequilibrium. Am. J. Hum. Genet. 74, 106–120. doi:10.1086/381000
PubMed Abstract | CrossRef Full Text | Google Scholar
Chau, K., Sivaprasad, S., Patel, N., Donaldson, T., Luthert, P., and Chong, N. (2008). Plasma levels of matrix metalloproteinase-2 and-9 (mmp-2 and mmp-9) in age-related macular degeneration. Eye 22, 855–859. doi:10.1038/sj.eye.6702722x
PubMed Abstract | CrossRef Full Text | Google Scholar
Chen, L., Pai, V., Levinson, R., Sharpe, A. H., Freeman, G. J., Braun, J., et al. (2009). Constitutive neuronal expression of the immune regulator, programmed death 1 (pd-1), identified during experimental autoimmune uveitis. Ocular Immunol. Inflamm. 17, 47–55. doi:10.1080/09273940802491884
CrossRef Full Text | Google Scholar
Chiang, C.-Y., Ching, Y.-H., Chang, T.-Y., Hu, L.-S., Yong, Y. S., Keak, P. Y., et al. (2020). Novel eye genes systematically discovered through an integrated analysis of mouse transcriptomes and phenome. Comput. Struct. Biotechnol. J. 18, 73–82. doi:10.1016/j.csbj.2019.12.009
PubMed Abstract | CrossRef Full Text | Google Scholar
Choudhary, M., Ismail, E. N., Yao, P.-L., Tayyari, F., Radu, R. A., Nusinowitz, S., et al. (2020). Lxrs regulate features of age-related macular degeneration and may be a potential therapeutic target. JCI insight 5, e131928. doi:10.1172/jci.insight.131928
PubMed Abstract | CrossRef Full Text | Google Scholar
Chuang, J.-Z., Yang, N., Nakajima, N., Otsu, W., Fu, C., Yang, H. H., et al. (2022). Retinal pigment epithelium-specific clic4 mutant is a mouse model of dry age-related macular degeneration. Nat. Commun. 13, 374–414. doi:10.1038/s41467-021-27935-9
PubMed Abstract | CrossRef Full Text | Google Scholar
de Cárcer, G., Escobar, B., Higuero, A. M., Garcia, L., Ansón, A., Pérez, G., et al. (2011). Plk5, a polo box domain-only protein with specific roles in neuron differentiation and glioblastoma suppression. Mol. Cell. Biol. 31, 1225–1239. doi:10.1128/MCB.00607-10
PubMed Abstract | CrossRef Full Text | Google Scholar
Durinck, S., Spellman, P. T., Birney, E., and Huber, W. (2009). Mapping identifiers for the integration of genomic datasets with the r/bioconductor package biomart. Nat. Protoc. 4, 1184–1191. doi:10.1038/nprot.2009.97
PubMed Abstract | CrossRef Full Text | Google Scholar
Ennis, S., Goverdhan, S., Cree, A., Hoh, J., Collins, A., and Lotery, A. (2007). Fine-scale linkage disequilibrium mapping of age-related macular degeneration in the complement factor h gene region. Br. J. Ophthalmol. 91, 966–970. doi:10.1136/bjo.2007.114090
PubMed Abstract | CrossRef Full Text | Google Scholar
Fletcher, E. L., Jobling, A. I., Greferath, U., Mills, S. A., Waugh, M., Ho, T., et al. (2014). Studying age-related macular degeneration using animal models. Optom. Vis. Sci. 91, 878–886. doi:10.1097/OPX.0000000000000322
PubMed Abstract | CrossRef Full Text | Google Scholar
Fritsche, L. G., Chen, W., Schu, M., Yaspan, B. L., Yu, Y., Thorleifsson, G., et al. (2013). Seven new loci associated with age-related macular degeneration. Nat. Genet. 45, 433–439, 439e1-2. doi:10.1038/ng.2578
PubMed Abstract | CrossRef Full Text | Google Scholar
Fritsche, L. G., Fariss, R. N., Stambolian, D., Abecasis, G. R., Curcio, C. A., and Swaroop, A. (2014). Age-related macular degeneration: Genetics and biology coming together. Annu. Rev. Genomics Hum. Genet. 15, 151–171. doi:10.1146/annurev-genom-090413-025610
PubMed Abstract | CrossRef Full Text | Google Scholar
Fritsche, L. G., Igl, W., Bailey, J. N. C., Grassmann, F., Sengupta, S., Bragg-Gresham, J. L., et al. (2016). A large genome-wide association study of age-related macular degeneration highlights contributions of rare and common variants. Nat. Genet. 48, 134–143. doi:10.1038/ng.3448
PubMed Abstract | CrossRef Full Text | Google Scholar
Gibbs, D., Yang, Z., Constantine, R., Ma, X., Camp, N. J., Yang, X., et al. (2008). Further mapping of 10q26 supports strong association of htra1 polymorphisms with age-related macular degeneration. Vis. Res. 48, 685–689. doi:10.1016/j.visres.2007.10.022
PubMed Abstract | CrossRef Full Text | Google Scholar
Gordiyenko, N. V., Fariss, R. N., Zhi, C., and MacDonald, I. M. (2010). Silencing of the chm gene alters phagocytic and secretory pathways in the retinal pigment epithelium. Invest. Ophthalmol. Vis. Sci. 51, 1143–1150. doi:10.1167/iovs.09-4117
PubMed Abstract | CrossRef Full Text | Google Scholar
Goto, A., Akahori, M., Okamoto, H., Minami, M., Terauchi, N., Haruhata, Y., et al. (2009). Genetic analysis of typical wet-type age-related macular degeneration and polypoidal choroidal vasculopathy in Japanese population. J. Ocular Biol. Dis. Inf
留言 (0)