
記住我


Aneurysmal subarachnoid hemorrhage (aSAH) is a fatal disease (1). Between 25 and 30% of patients with aSAH die within 3 months of onset (2), and 40% of aSAH patients do not regain independent function (3). Consequently, establishing an accurate and straightforward prediction model for the early prognosis of aSAH has always been a priority in aSAH clinical research.
Two externally validated predictive models, the SAFIRE model (4) and the SAHIT model (5), have been developed using data from prospective cohort studies. The derivation cohort of the SAFIRE model included 1,215 patients, while the validation cohort included 2,143; for the SAHIT model, 10,936 and 3,355 patients were included in the respective cohorts. The area under the receiver operating characteristic curve (AUC) for SAFIRE was 0.83 (95%CI 0.80–0.85), while AUC values for SAHIT remained between 0.76–0.81 in external validation. However, R2 in SAHIT was only 23–31%, signifying that the included predictors explained only 23–31% of the variability in outcome, whereas the SAFIRE model does not report its R2. As neither model incorporated laboratory tests, the potential of baseline biomarkers to enhance the model has yet to be explored.
Recent studies have confirmed that inflammation in the initial phase of aSAH is implicated in its pathological process (6). Several peripheral inflammatory markers, including the neutrophil-to-albumin ratio (NAR) (7), neutrophil-to-lymphocyte ratio (NLR) (8), platelet-to-lymphocyte ratio (PLR) (9), monocyte-to-lymphocyte ratio (MLR) (10), and systemic immune inflammation index (SII) (11), have been reported to be associated with short-term outcomes of aSAH, raising the possibility that they may serve as promising prognosticators. However, there has yet to be a systematic study on whether these markers can improve the predictive capabilities of existing models. This study sought to investigate if these validated inflammatory markers could bolster the predictive power of SAFIRE and SAHIT models, in addition to selecting the marker that conferred the greatest enhancement.
Methods Study design and source of dataPatient data were derived from a large observational cohort study at Sichuan University West China Hospital. Patients were divided into the derivation cohort (February 2009 to December 2017) and the validation cohort (January 2018 to July 2019). Treatment of patients was carried out according to standardized guidelines (12).
Patients were enrolled only when they were diagnosed with SAH by computed tomography, magnetic resonance imaging, angiography, or cerebrospinal fluid test, and aneurysm were identified precisely. Exclusion criteria included (1) aneurysms were caused by trauma or arteriovenous malformations and (2) aneurysms were treated before ictus. We also excluded patients whose personal identification numbers were wrong or whose household registrations were not found in the Household Registration Administration System. We used personal identification numbers to identify death records from this system.
The study was approved by the West China Hospital Institutional Review Board (No. 20211701), with a waiver of informed consent due to minimal risk to patients. Predictive models were reported according to the TRIPOD statement (Checklist in the Supplemental material) (11).
PredictorsAccording to the SAFIRE and SAHIT models, age, medical history of hypertension, aneurysm location, aneurysm size, World Federation of Neurological Surgeons (WFNS) grade on admission, Fisher grade on admission, and methods of treatment (clip, coil, or no treatment) were collected.
Aneurysm size and Fisher grade categories were defined separately as SAFIRE or SAHIT predictive tool. In the SAFIRE model, aneurysm sizes were categorized as <10 mm, 10–19.9 mm, or ≥ 20 mm, and Fisher grades were categorized into 1–3 or 4. In the SAHIT model, aneurysm sizes were categorized as ≤12 mm, 13–24 mm, or ≥ 25 mm, and original Fisher grades were enrolled. Similarly, age was treated as a continuous variable in the SAHIT model and a categorical variable in the SAFIRE model (≤50 y, 50–60 y, 60–70 y, or ≥ 70 y). Due to the limited data, locations of aneurysms were imputed as anterior or posterior circulation.
According to the current studies, we identified five markers to predict outcomes in aSAH patients, including the NAR, NLR, PLR, MLR, and SII. Their calculation methods were presented in Supplementary Figure S1. Considering the Practical clinical application, only laboratory examination results within 24 h were selected. Multicollinearity was assessed using the variance inflation factor (VIF). A VIF value >5 indicates severe collinearity (13).
OutcomeThe outcome was defined as mortality at 3 months. All death records were extracted through the Household Registration System, which documents Chinese citizens’ death dates. The system is based on self-reporting death by relatives and the Seventh National Census, with a missing registration rate of 5 per 10,000, which was reported by the National Bureau of Statistics (14). Therefore, this system has accurate death records and bind assessments (15).
Missing dataAll data were complete except aneurysm size and Fisher grade. In the derivation cohort, missing aneurysm size and Fisher grade values were filled using multiple imputation (16) with a predictive mean matching method to generate 5 imputations. Complete case analysis was adopted in the validation cohort.
Comparison of inflammatory markersConsidering the colinearity of the five inflammatory markers, we compared their predictive abilities before adding to the predictive models using binary logistic regression and area under the receiver operator characteristics curve (AUC). The DeLong test was employed to distinguish the difference between AUCs (17).
Model developmentFollowing the original SAFIRE predictive tool, binary logistic regression was adopted to establish the predictive model, and the same variables (age, aneurysm size, Fisher grade, and WFNS grade) were included. Similarly, we applied the same predictors (age, history of hypertension, aneurysm location, aneurysm size, Fisher grade, WFNS grade, and treatment) as the SAHIT model used to build a binary logistic regression model. The inflammation marker with the highest predictive value was added to these models for further development.
Model performanceThe modified models were compared with the original models. Performance between models was evaluated from different perspectives by a variety of approaches. AUC values with 95% CIs and integrated discrimination improvement (IDI) were reported to represent the discrimination significance of the modified models. Categorical net reclassification improvement (NRI) was employed to illustrate the reclassification, and decision-curve analysis (DCA) was used to show the net benefit and visualize the clinical usefulness. According to the previous study (18), we defined risk ratio < 0.1 as low, 0.1–0.6 as moderate, and > 0.6 as high risk of long-term mortality.
The R2 statistic was reported to identify the proportion of variance explained by the predictive models, and the contribution of each predictor to the predictive models was represented with the partial R2 statistic (19).
Model calibrationThe calibration plots (20) were used to evaluate the calibration of the prediction models, and the Brier score (21) was computed to measure the prediction accuracy. The Brier score ranges from 0 to 0.25. The closer the Brier score is to 0, the better the model calibration degree is. When the Brier score equals 0.25, the model has no prediction ability.
Model validationTwo parts of model validation were completed. A 400 times 10-fold cross-validation was adopted as the internal validation strategy, and mean AUC values and average error were reported.
We compared the derivation cohort (2009–2017) and the validation cohort (2018–2019) as a temporal validation, and the AUC, IDI, and NRI values of the temporal validation cohort were calculated.
Sample sizeThe sample size of this study was calculated using the formula developed by Riley et al. (22). The required minimum sample size was obtained for developing a new model using the SAFIRE predictive tool consisting of 323 patients. Using the SAHIT predictive tool, the minimum sample size was 458 patients.
Sensitivity analysisFor further sensitivity analysis, inflammatory markers were added as categorical variables using their cut-off values, and potentially meaningful interaction effects were reported.
All analyses were conducted using R software (version 4.2.1, R Foundation for Statistical Computing). Web-based nomograms were developed using the DynNom R package.
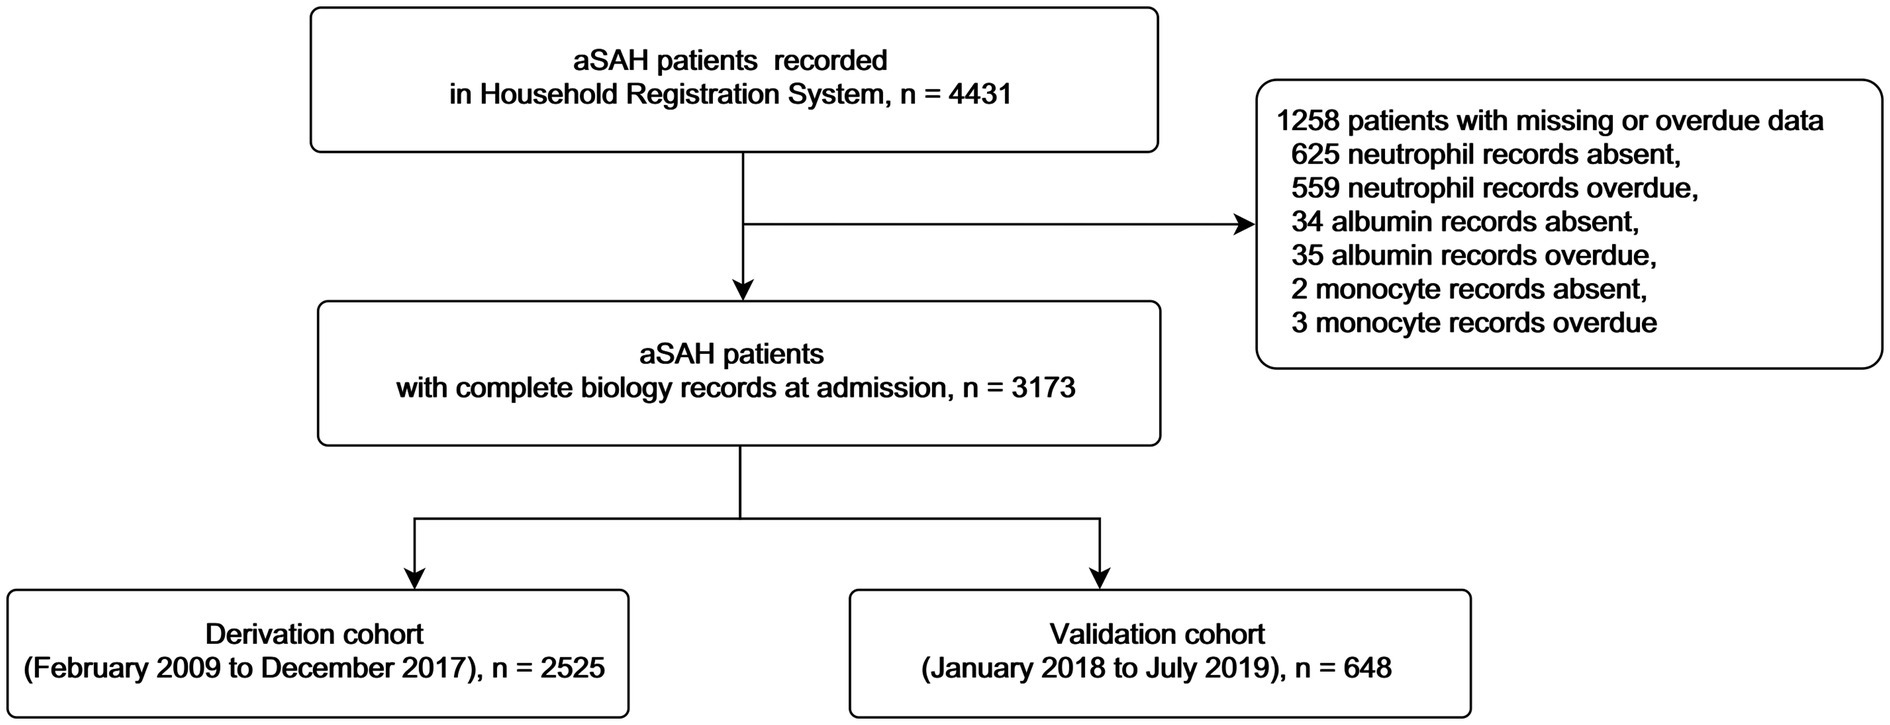
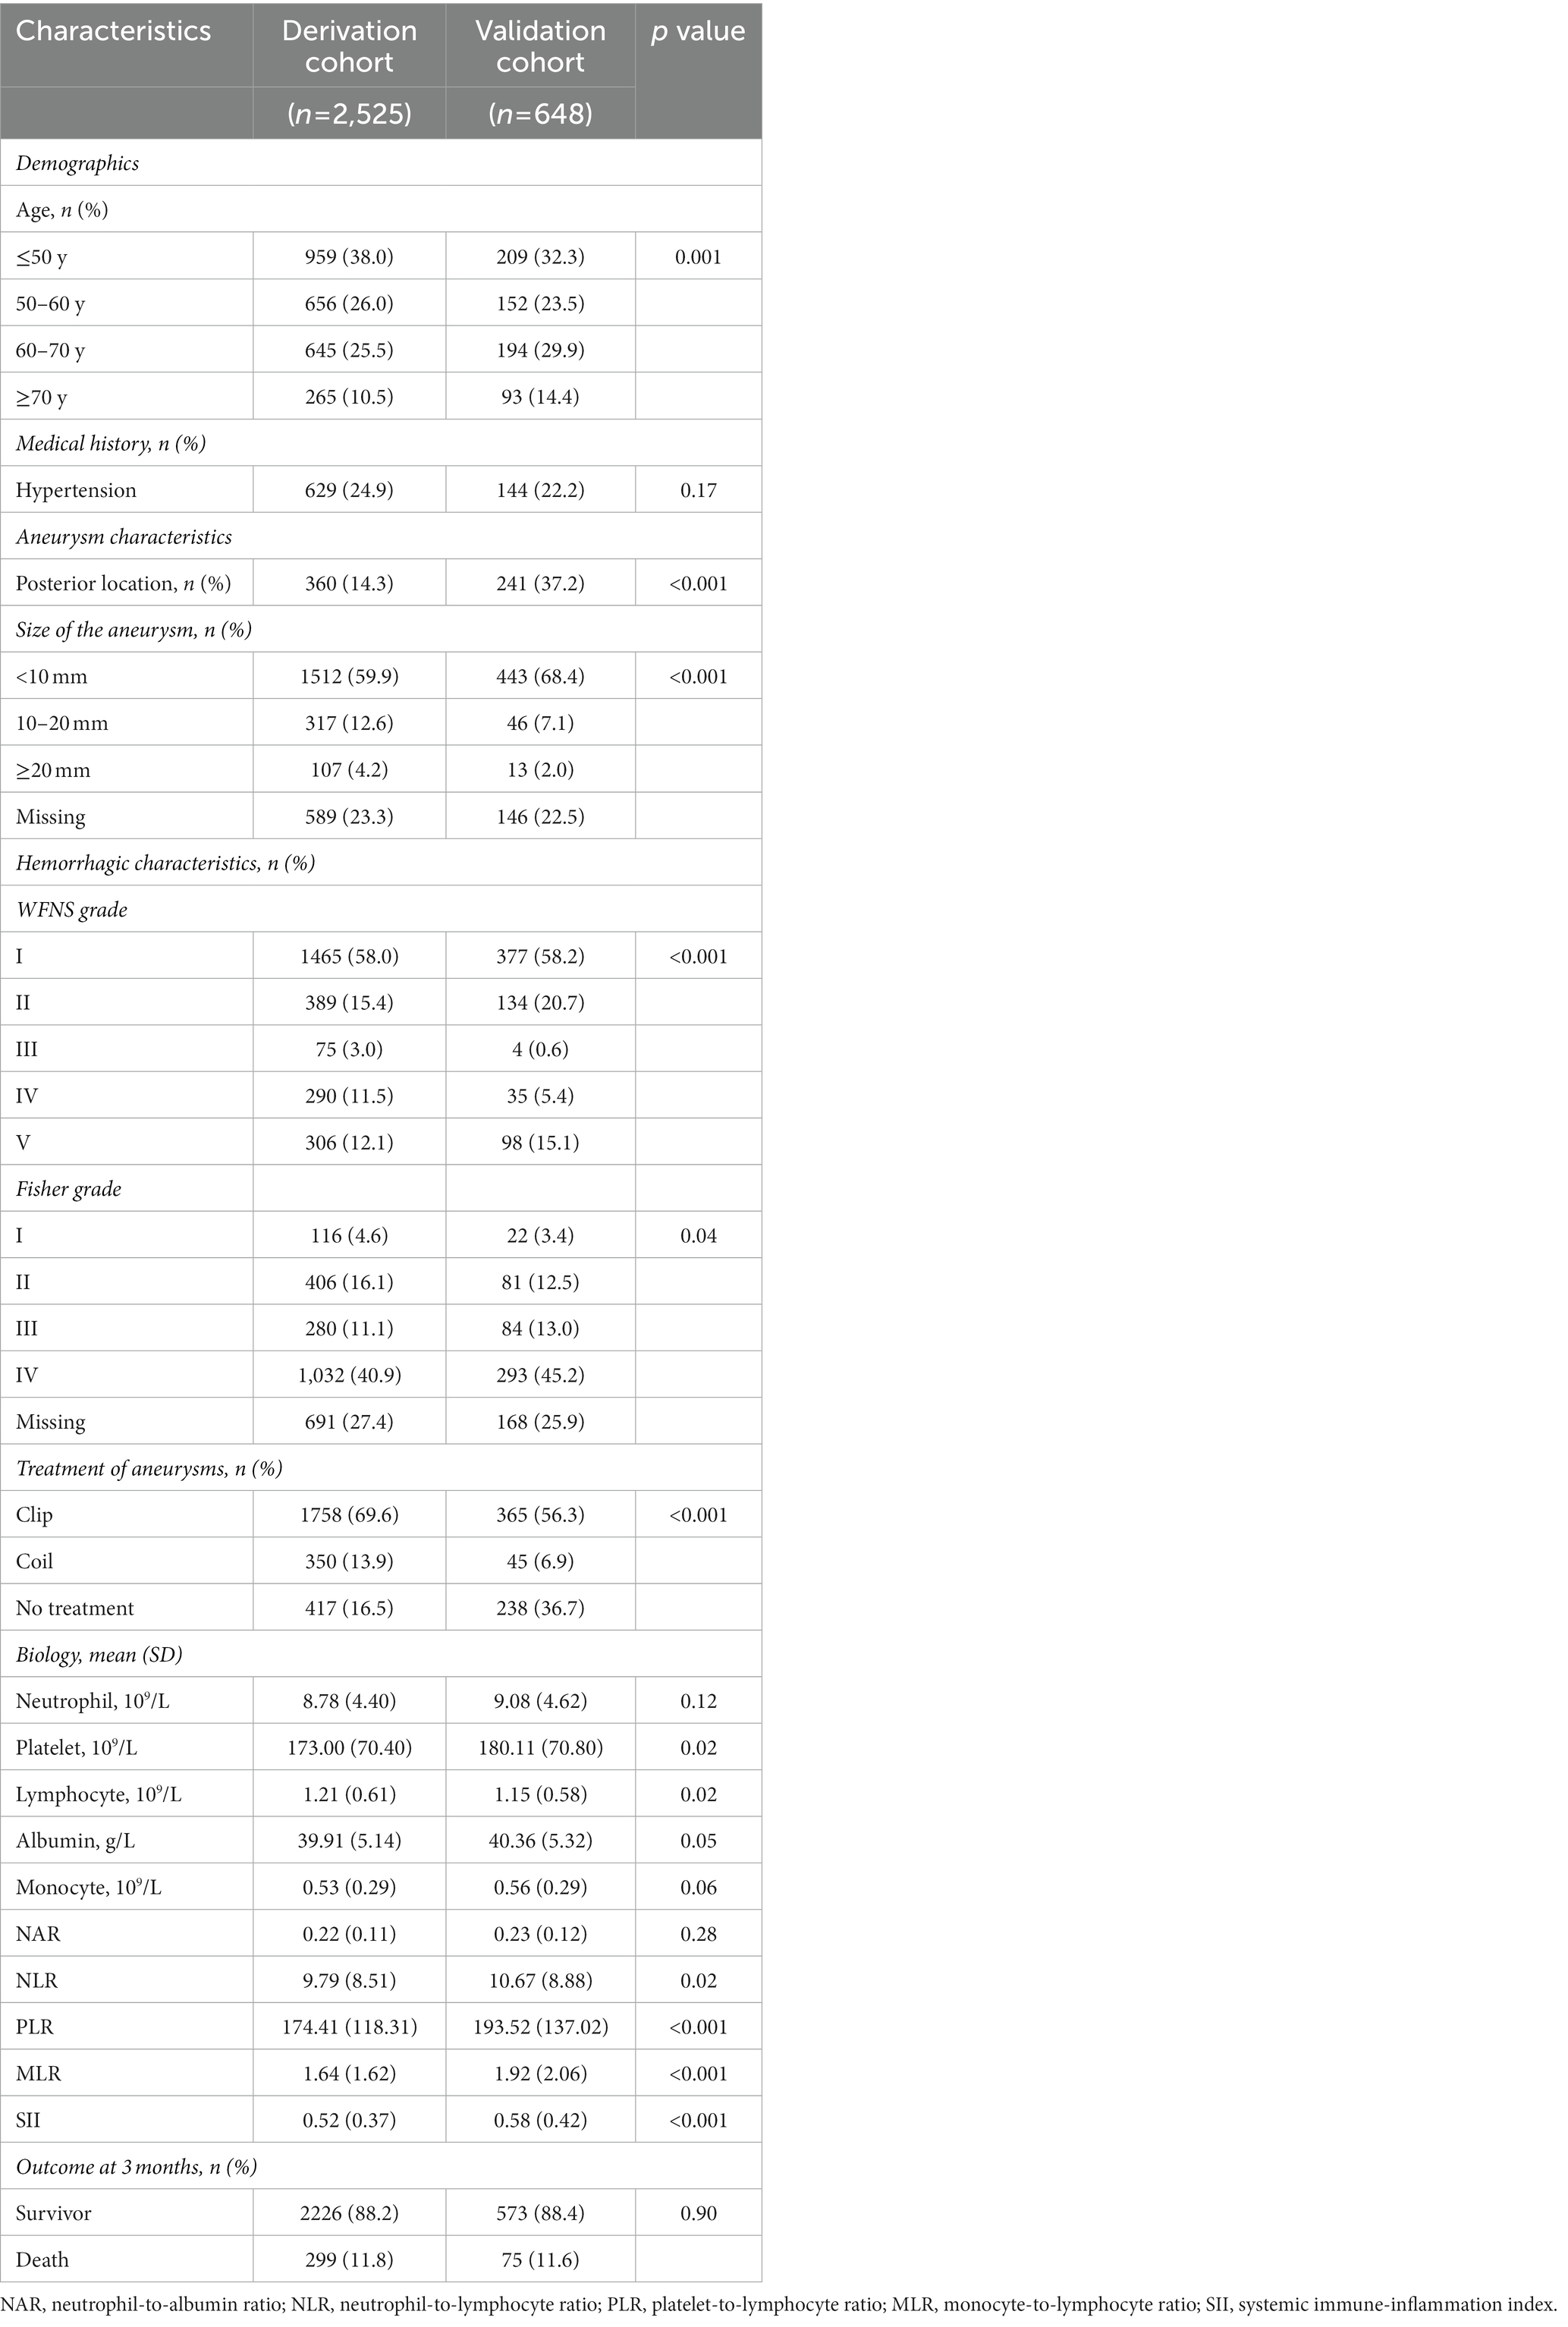
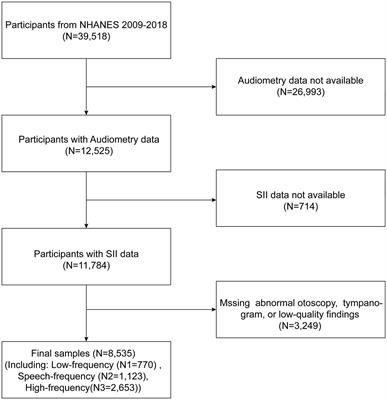
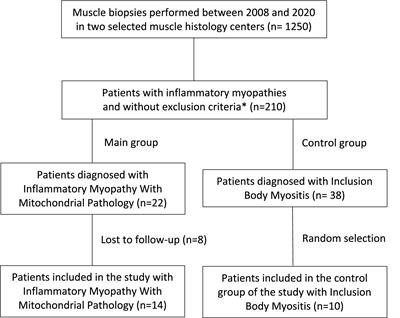
Results Patient demographics and missing dataA total of 3,173 patients were included in this study (Figure 1 details patient inclusion flow chart). Patients were divided into the derivation cohort (n = 2,525) and the validation cohort (n = 648). The median age was 55 (interquartile range 47–63) in the derivation cohort and 55 (48–66) in the validation cohort. Most patients were female (65.3% in the derivation cohort and 63.6% in the validation cohort). Mortalities at 3 months were similar in the two cohorts (11.8% and 11.6, respectively). Details of the characteristics were summarized in Table 1.
Figure 1. Flow chart for patients included in this study.
Table 1. Data of patients included in the study.
In the derivation cohort, 23.3% of patients were missing aneurysm size values, and 27.4% were missing Fisher grade values. Any missing data in the derivation cohort were imputed. The validation cohort included 423 patients with complete data in the final computation.
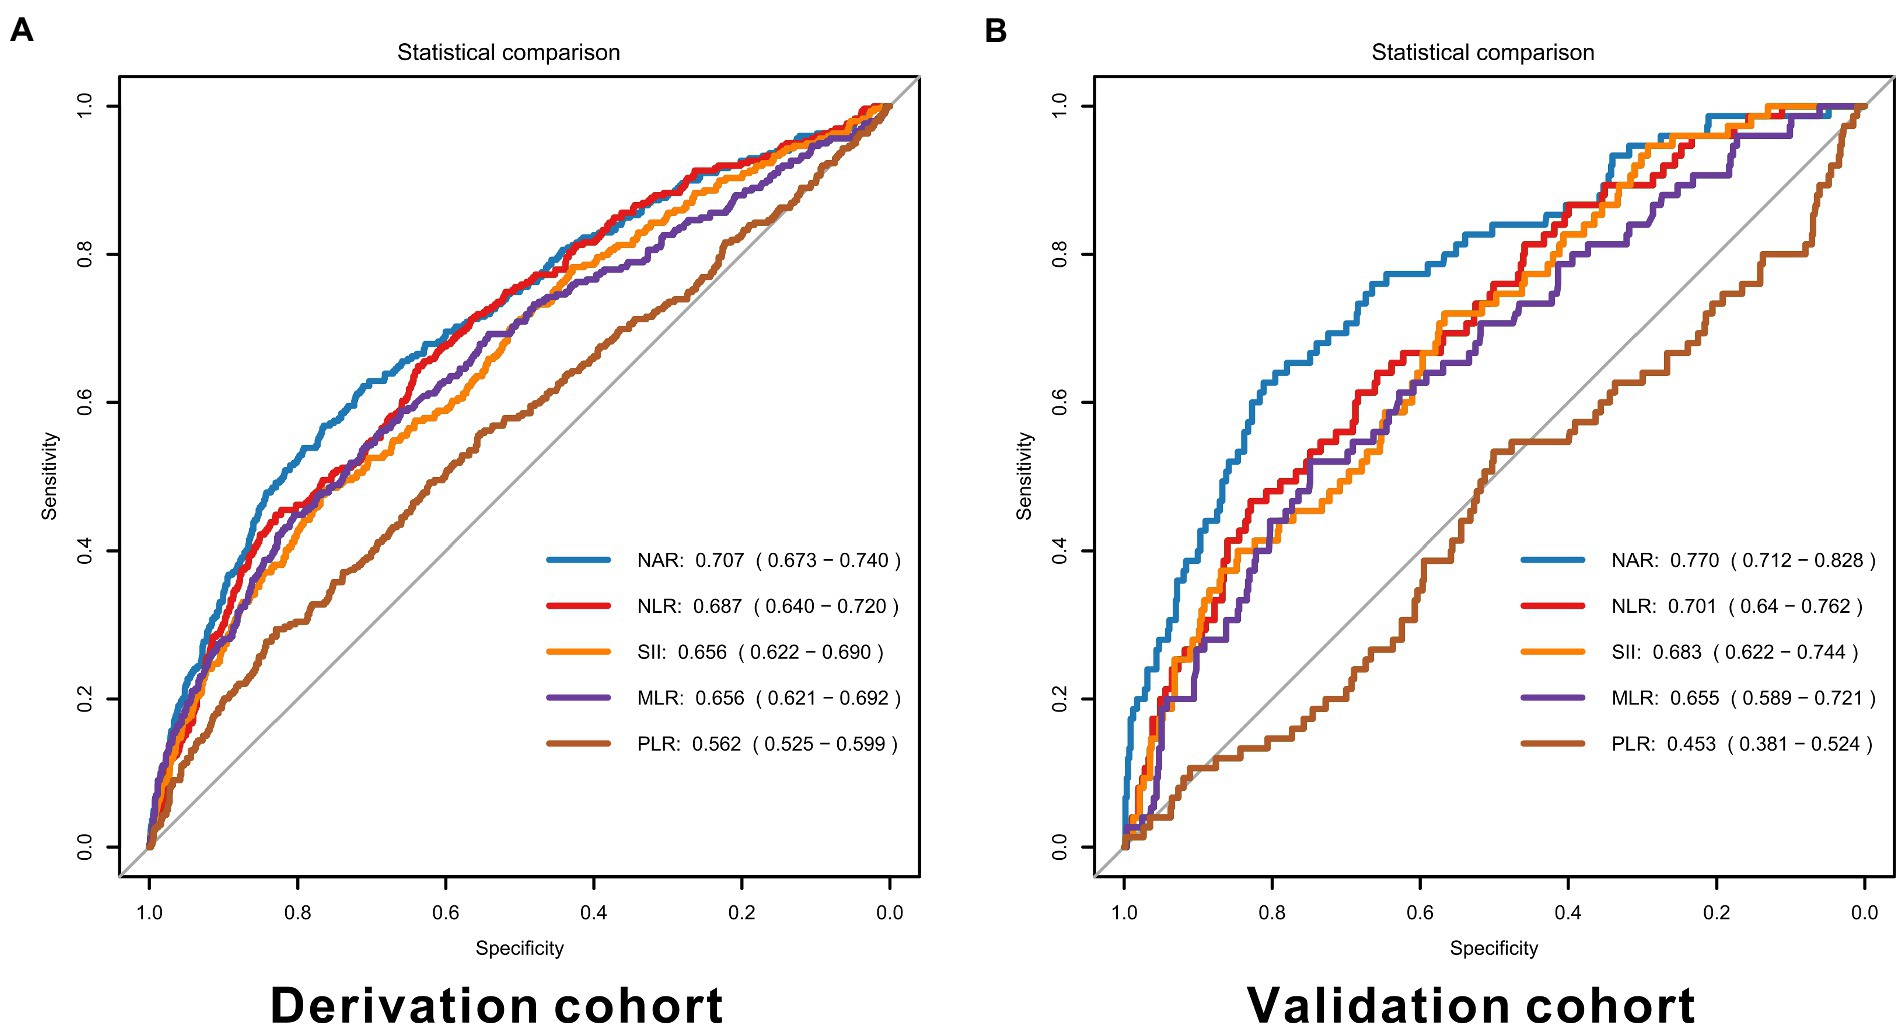
Model developmentIn the derivation cohort, NAR performed the best predictive ability with the highest AUC of 0.707 (95% CI 0.673–0.740), and PLR was the weakest with the lowest AUC of 0.562 (95%CI 0.525–0.599), as shown in Figure 2. Similar results were represented in the validation cohort (NAR: AUC = 0.770, 95% CI 0.712–0.828; PLR: AUC = 0.453, 95% CI 0.381–0.524). Details of each marker’s performance were reported in Supplementary Table S1. Considering the poor performance of PLR, we did not add it to the models furtherly.
Figure 2. ROC curves for inflammatory markers in the derivation (A) and validation cohorts (B). NAR, neutrophil-to-albumin ratio, NLR, neutrophil-to-lymphocyte ratio, PLR, platelet-to-lymphocyte ratio, MLR, monocyte-to-lymphocyte ratio, SII, systemic immune inflammation index.
Before adding to SAFIRE and SAHIT models, the collinearity of the original model predictors and the inflammatory markers was examined via VIF, as shown in Supplementary Tables S2, S3. There was no VIF value over 5.
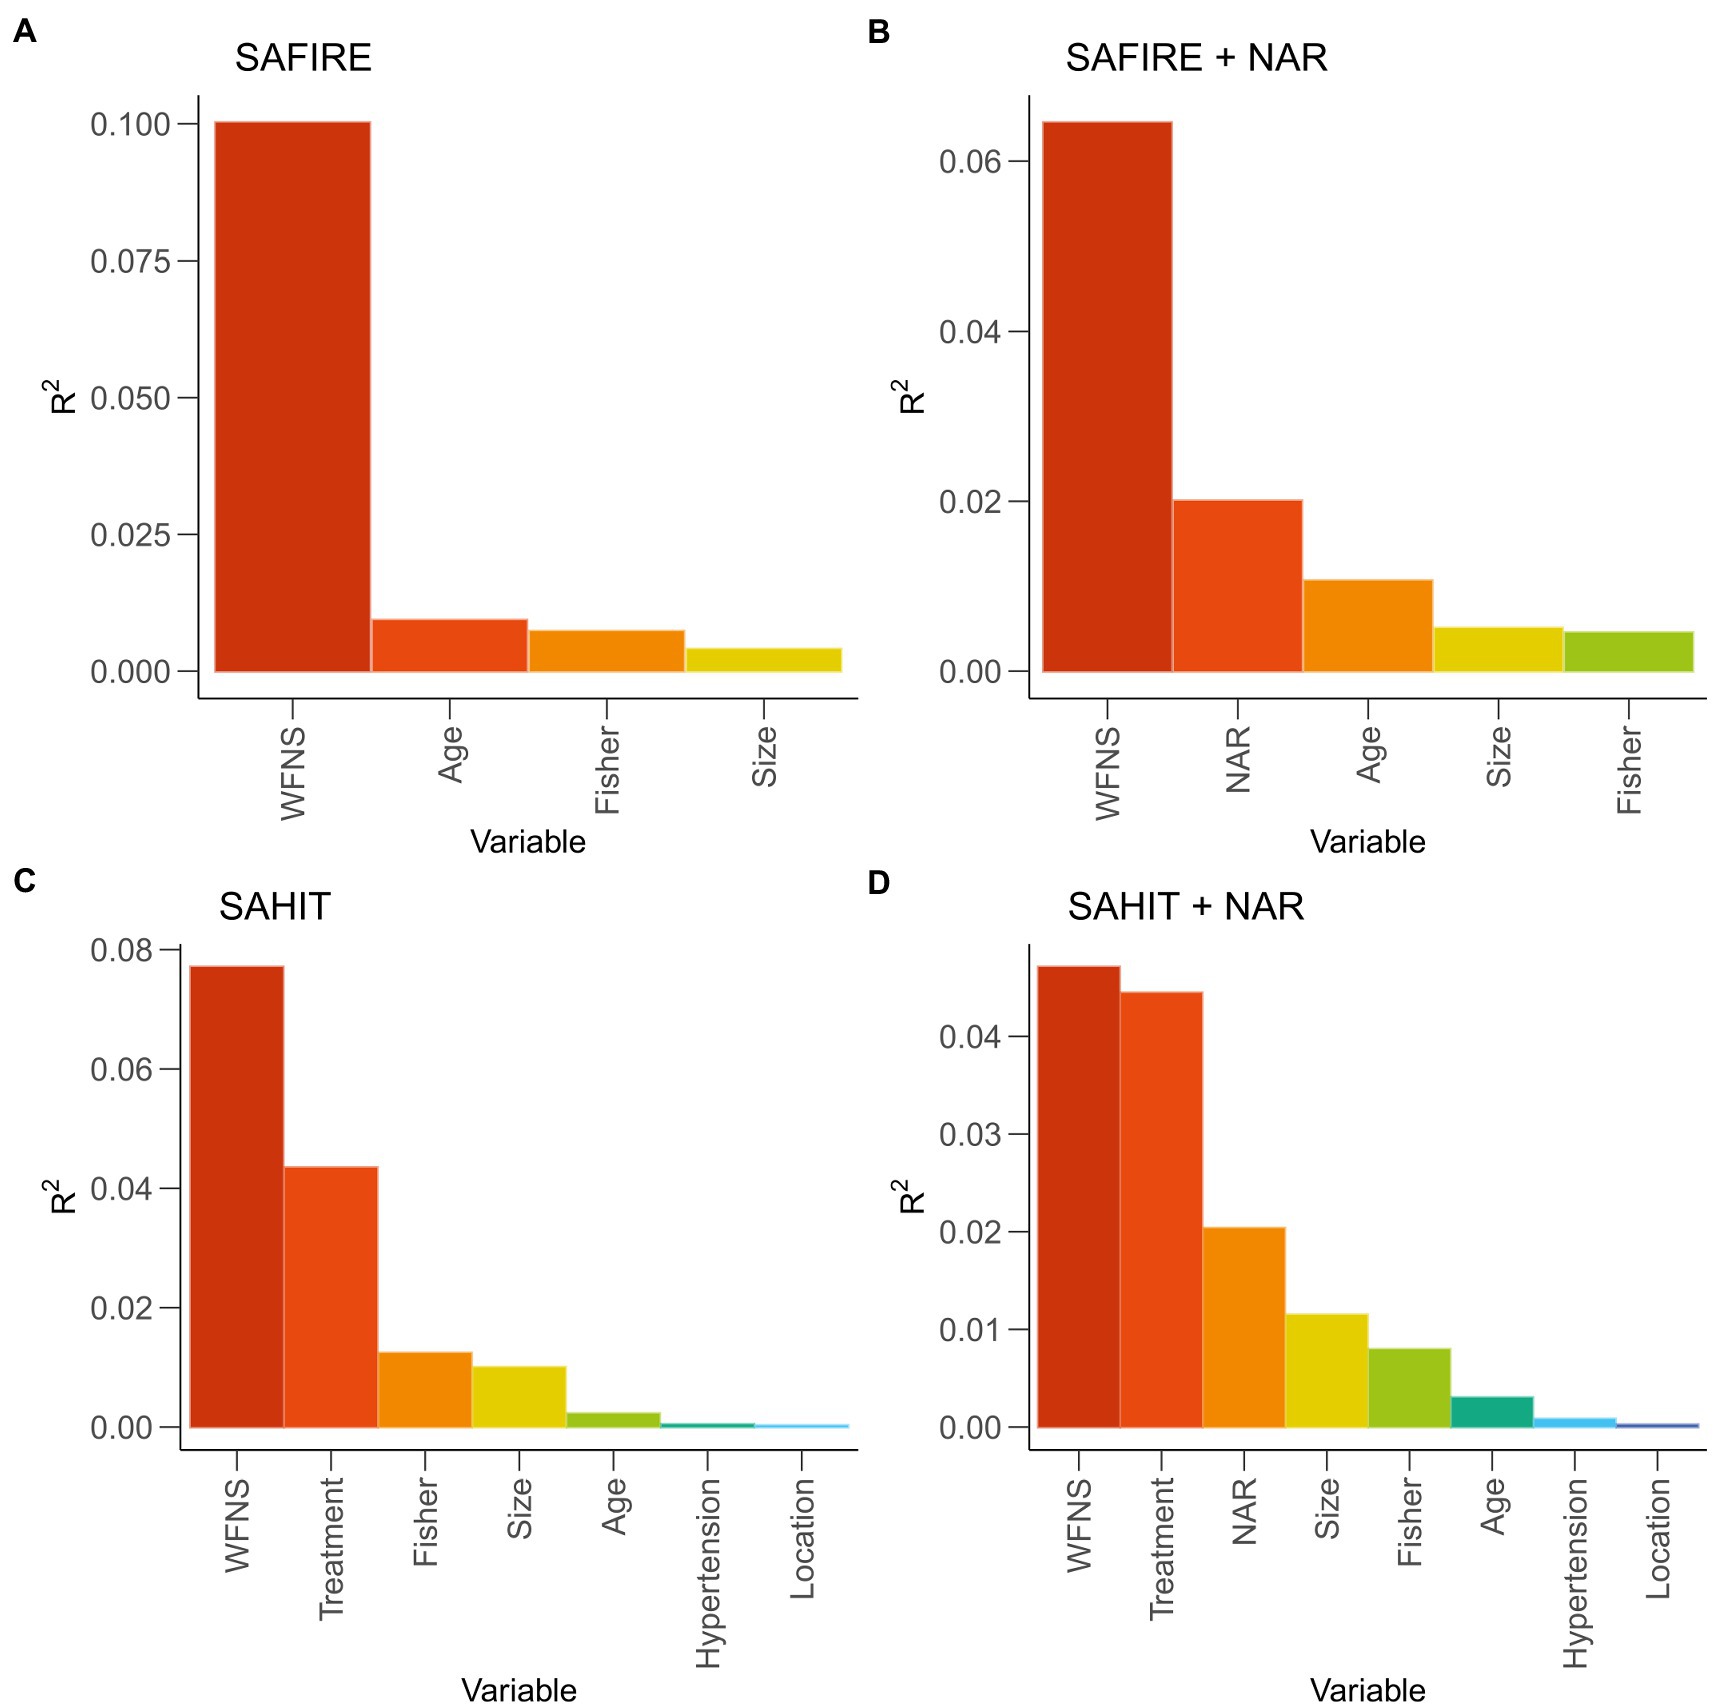
In the original SAFIRE model, the strongest predictor was WFNS grade (partial R2 = 10.02%), followed by age (partial R2 = 0.93%), Fisher grade (partial R2 = 0.73%), and aneurysm size (partial R2 = 0.40%). In the original SAHIT model, the strongest predictor was WFNS grade (partial R2 = 7.71%), followed by treatment (partial R2 = 4.35%), Fisher grade (partial R2 = 1.24%), aneurysm size (partial R2 = 1.00%), age (partial R2 = 0.23%), history of hypertension (partial R2 = 0.05%), and aneurysm location (partial R2 = 0.03%).
As shown in Figure 3, NAR was the second significant predictor in the modified SAFIRE model (partial R2 = 2.01%) and the third in the modified SAHIT model (partial R2 = 2.04%). The significance of other markers after adding to the predictive models was illustrated in Supplementary Figure S2. Details of the logistic regression models were reported in Supplementary Tables S4, S5.
Figure 3. General dominance of predictors reported as partial R2 statistic in original and modified models. SAHIT, original Subarachnoid Hemorrhage International Trialists’ model; SAFIRE, the SAFIRE grading scale indicates size of the aneurysm, age, fisher grade, World Federation of Neurological Surgeons; WFNS, World Federation of Neurological Surgeons; NAR, neutrophil-to-albumin ratio.
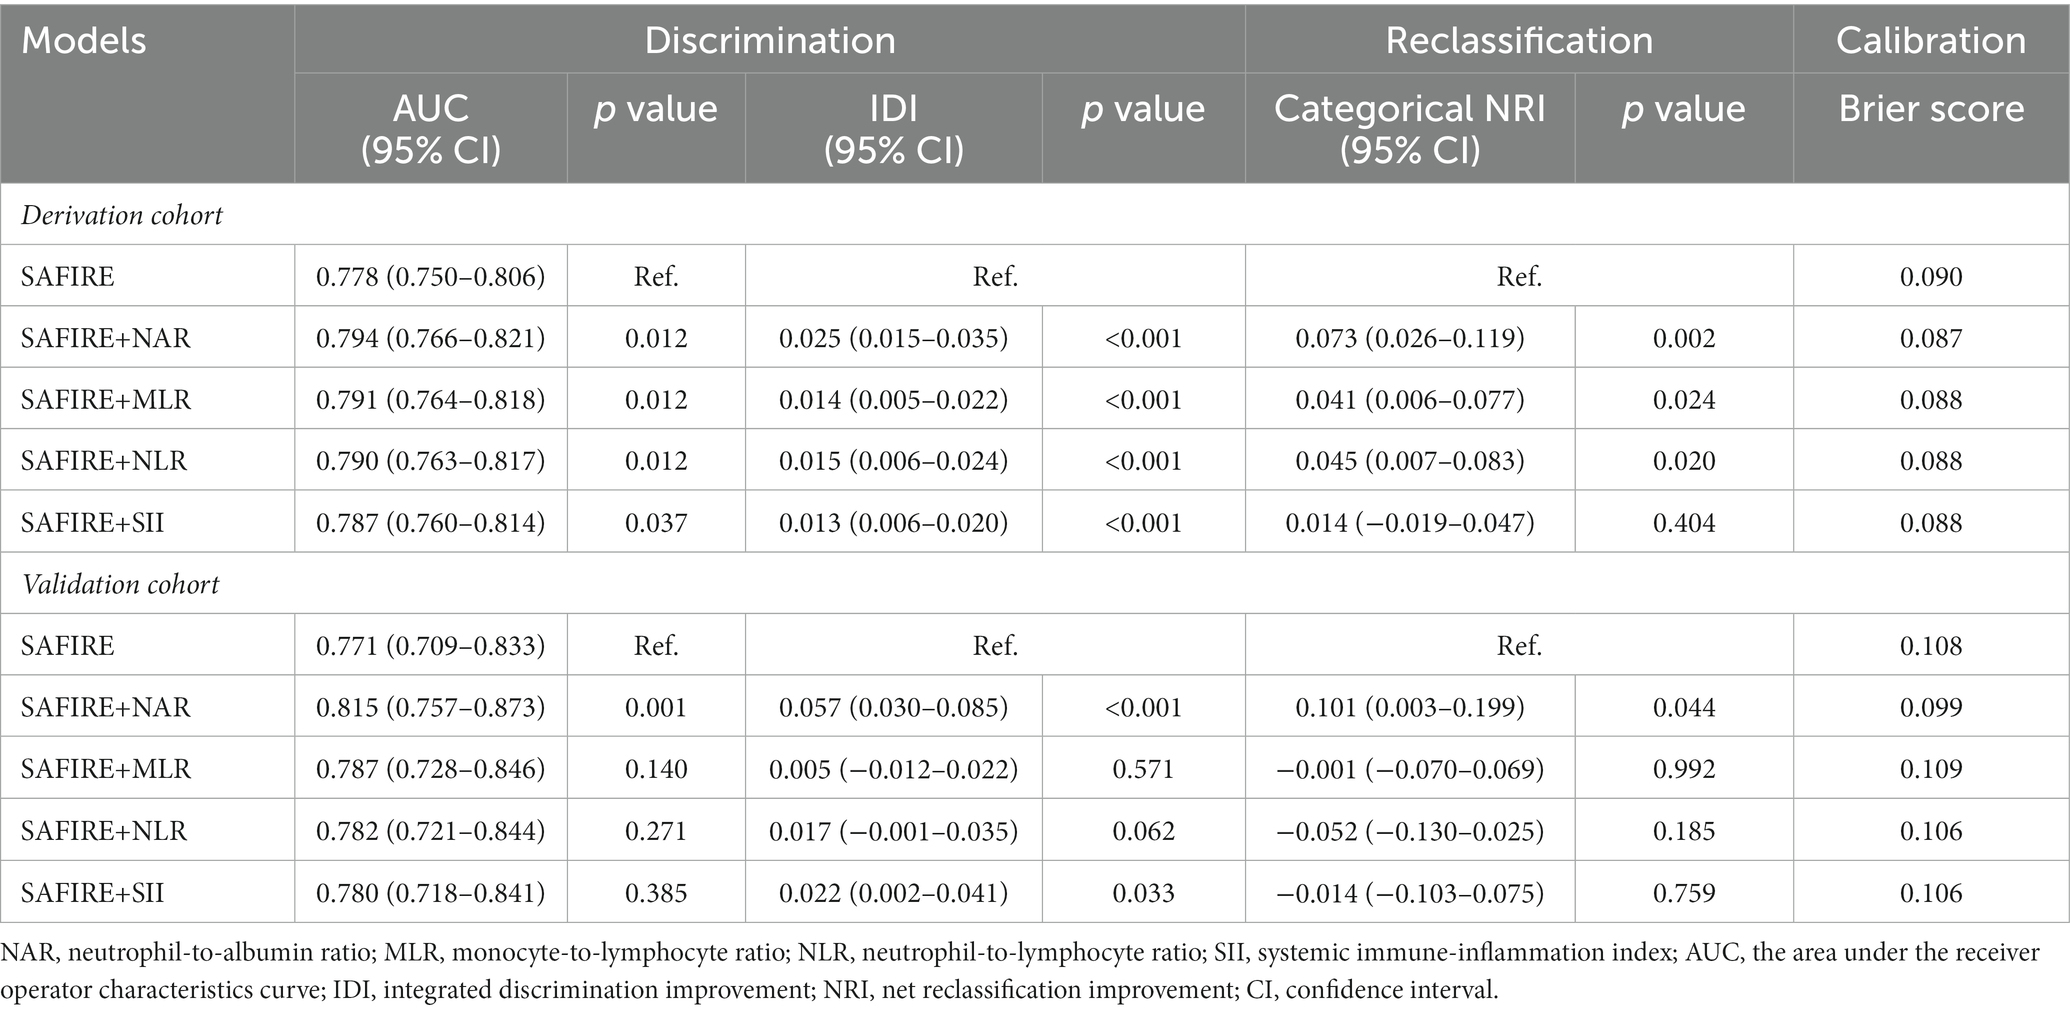
Model performance SAFIRE + inflammatory markersAs shown in Table 2, inputting the same predictors as the SAFIRE predictive tool generated a comparable AUC value in the derivation cohort (AUC = 0.778, 95% CI 0.750–0.906). After adding inflammatory markers, all modified predictive models achieved a better discriminative ability in the derivation cohort. Among the four markers, adding NAR to the original model acquired the highest AUC development (SAFIRE+NAR vs. SAFIRE: ∆AUC = 0.016, p = 0.012) and the highest IDI (SAFIRE+NAR vs. SAFIRE: IDI = 0.025, p < 0.001).
Table 2. Performance of SAFIRE and SAFIRE + inflammatory biomarkers models.
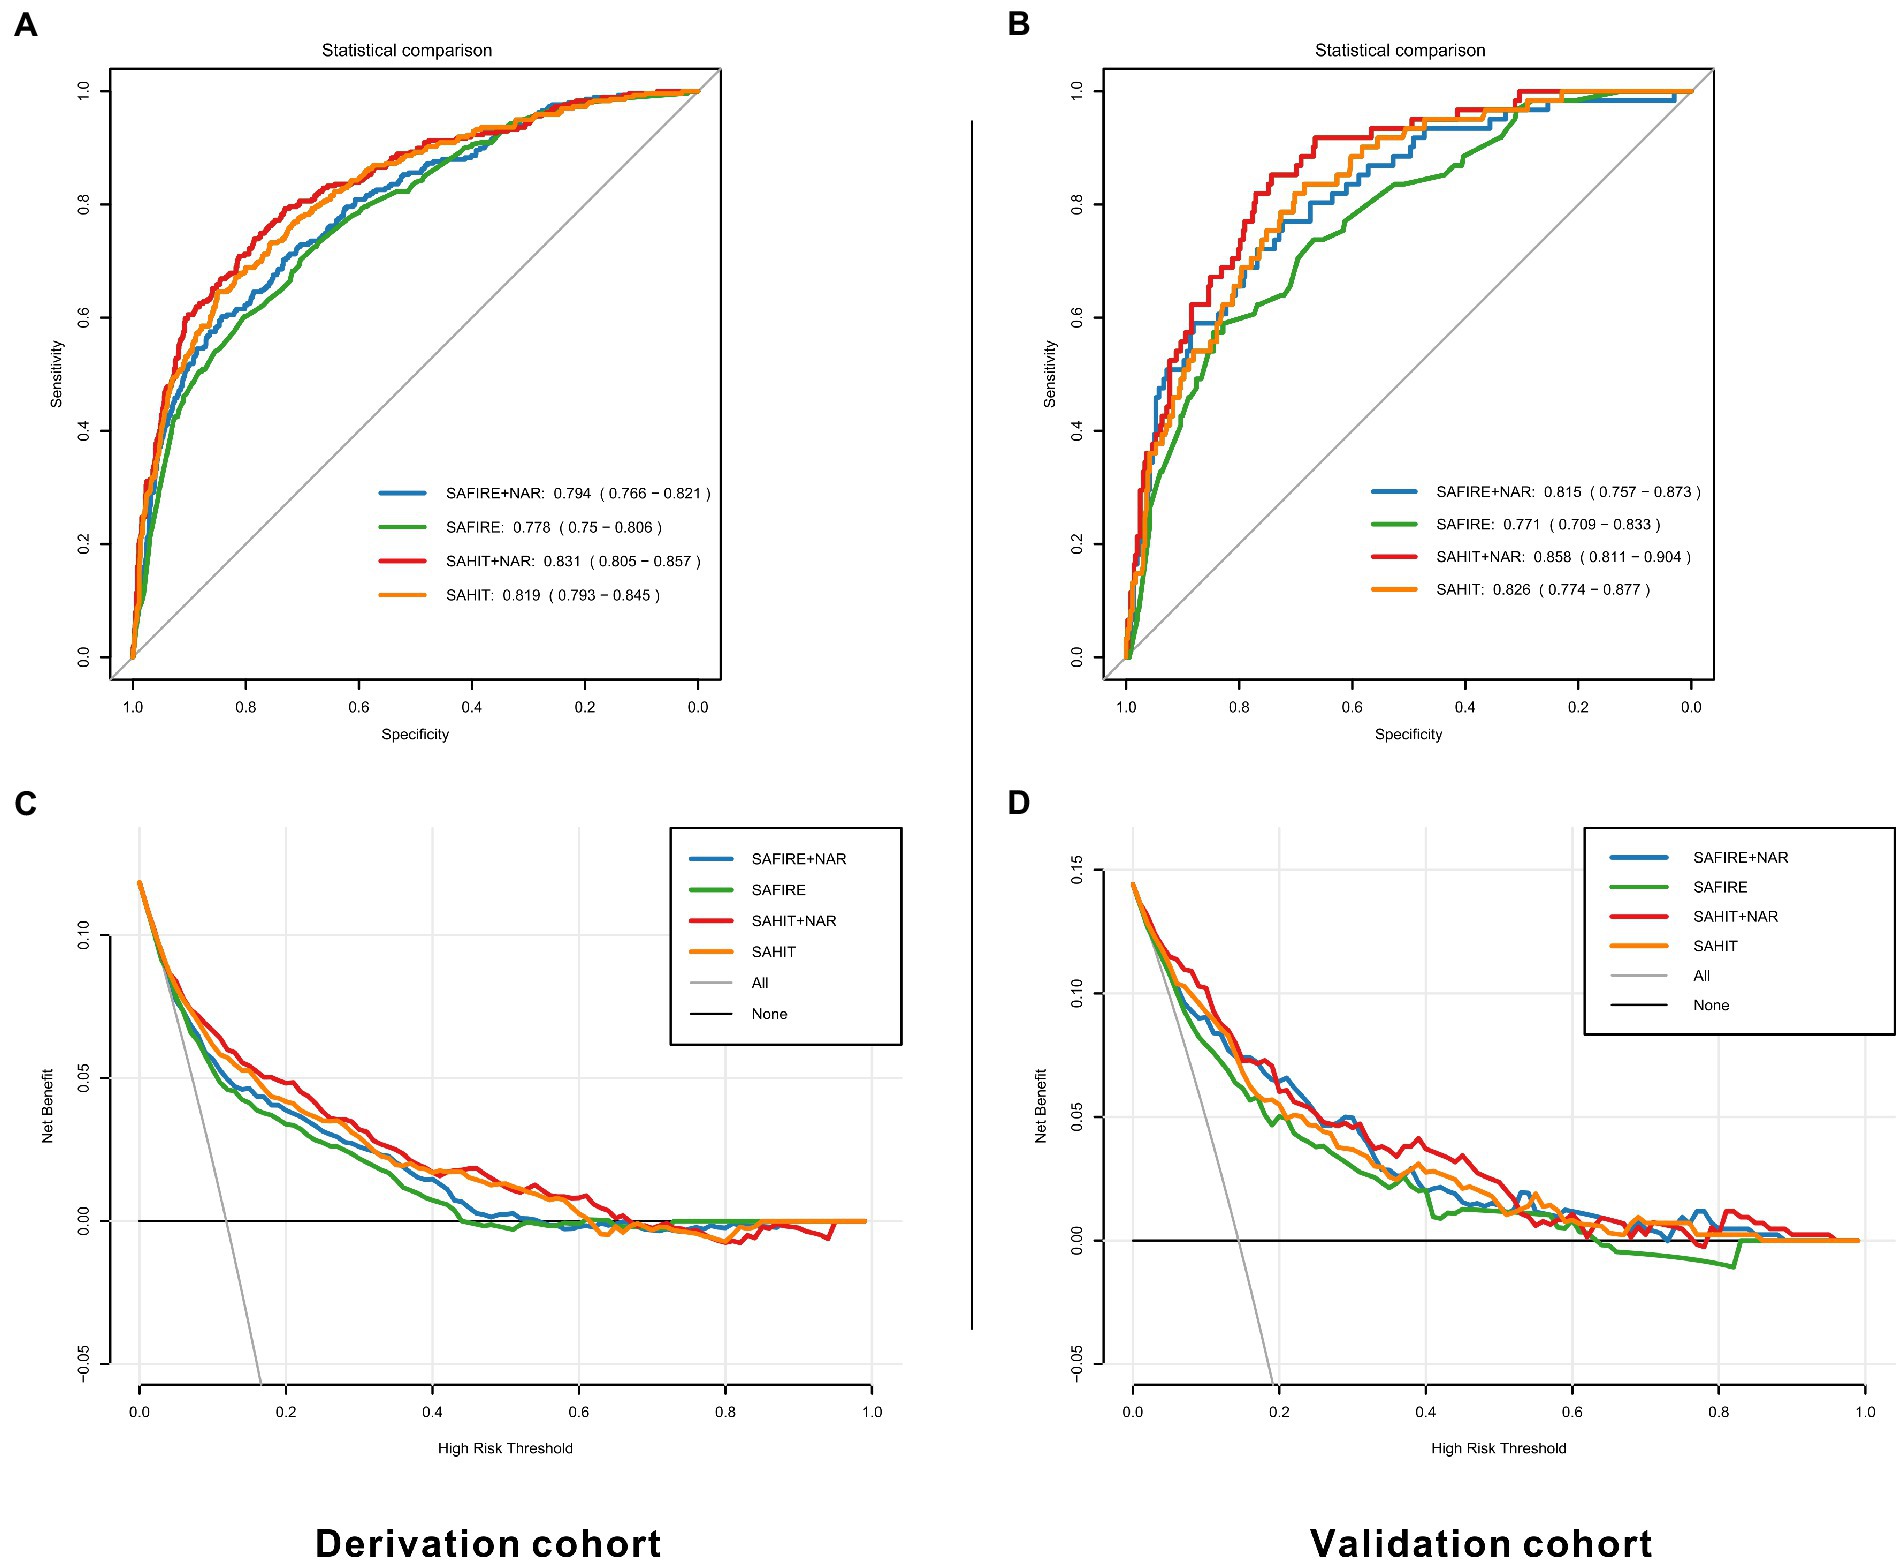
Compared with the original SAFIRE model, the addition of NAR (NRI = 0.073, p = 0.002), MLR (NRI = 0.041, p = 0.024), and NLR (NRI = 0.045, p = 0.020) could improve the reclassification and the addition of NAR showed the most remarkable reclassification improvement among them. Supplementary Table S6 shows that including NAR as an additional predictor led to 22 (7.36%) extra deaths being classified into a higher risk category, although 2 (0.09%) extra survivors were reclassified into a higher risk category. As shown in Figure 4C, SAFIRE+NAR showed a higher net benefit than the original model.
Figure 4. ROC curves and decision curves for original and modified models in the derivation (A,C) and validation cohorts (B,D). SAHIT, original Subarachnoid Hemorrhage International Trialists’ model; SAFIRE, the SAFIRE grading scale; NAR, neutrophil-to-albumin ratio.
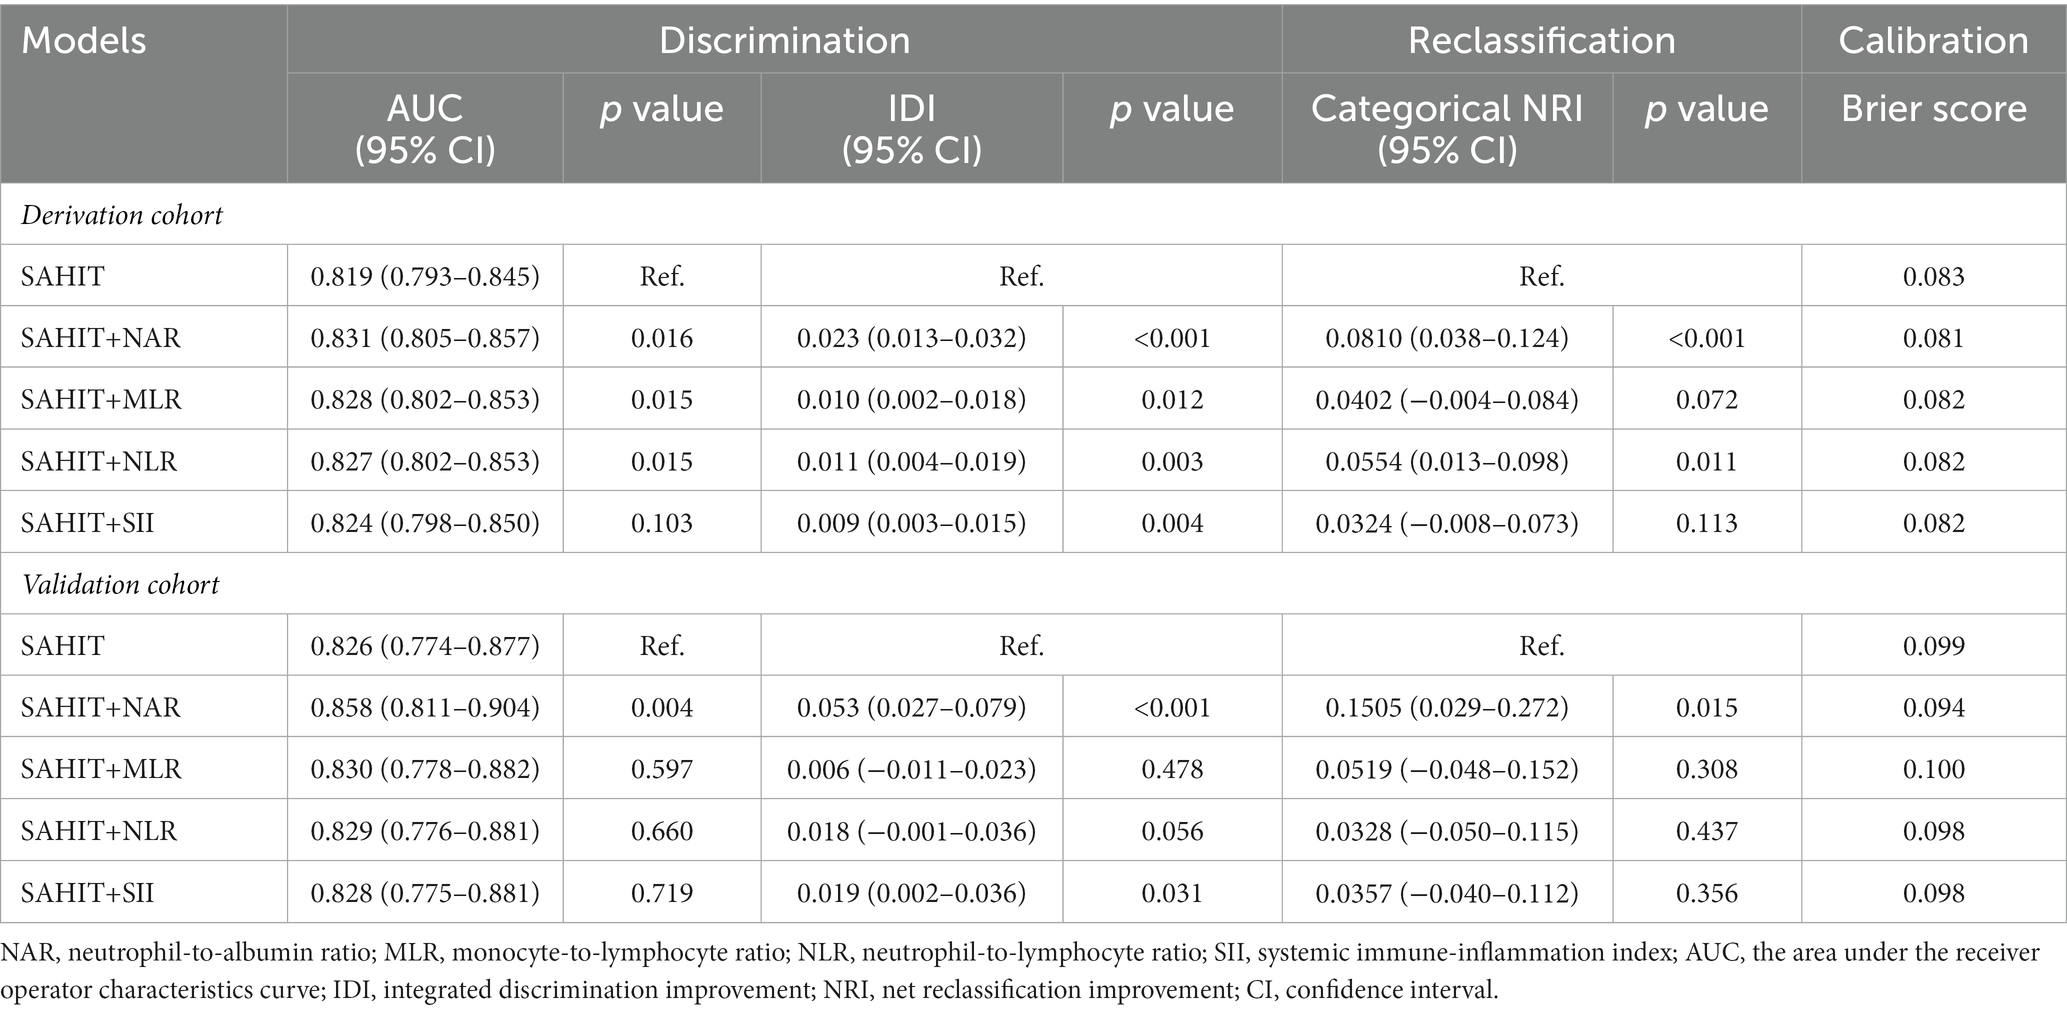
SAHIT + inflammatory markersAs shown in Table 3, the AUC value of the SAHIT model in the derivation cohort (AUC = 0.819, 95% CI 0.793–0.845) was also comparable with that previously reported. The addition of inflammatory markers all improved the modified predictive models. Among the four markers, adding NAR to the SAFIRE and SAHIT models acquired the highest AUC development (SAHIT+NAR vs. SAHIT: ∆AUC = 0.012, p = 0.016) and the highest IDI (SAHIT+NAR vs. SAHIT: IDI = 0.023, p < 0.001).
Table 3. Performance of SAHIT and SAHIT + inflammatory biomarkers models.
Compared with the original SAHIT model, only the addition of NAR (NRI = 0.081, p < 0.001) and NLR (NRI = 0.055, p = 0.011) could improve the reclassification, and the NRI of addition of NAR was still the highest. As shown in Supplementary Table S7, SAHIT+NAR reclassified 24 (1.08%) survivors into a lower risk category and 21 (7.02%) deaths into a higher risk category, which meant both specificity and sensitivity was enhanced. As shown in Figure 4C, including NAR enhanced the net benefit compared with the original SAHIT model, which meant greater clinical usefulness.
Model validation SAFIRE + inflammatory markersIn the internal validation, for all SAFIRE+NAR models using the derivation cohort data, the mean AUC was 0.785, and the average error was 11.8%. In the temporal validation, the performances of the developed models using the validation cohort data were comparable to those using the derivation cohort data. As shown in Table 2, only the addition of NAR improved the discrimination ability of the SAFIRE model (SAFIRE+NAR vs. SAFIRE: ∆AUC = 0.044, p = 0.001; IDI = 0.057, p < 0.001). Moreover, including NAR as an additional predictor improved the reclassification ability of the SAFIRE model (NRI = 0.101, p = 0.044), and details of the reclassification improvement were shown in Supplementary Table S8. Net benefit was also improved, as shown in Figure 4D.
SAHIT + inflammatory markersIn the internal validation, for all SAHIT+NAR models, the mean AUC was 0.820, and the average error was 10.7%. In the temporal validation, the performances of the developed models using the validation cohort data were comparable to those using the derivation cohort data. As shown in Table 3, only the addition of NAR improved the discrimination ability of the SAHIT model (SAHIT+NAR vs. SAHIT: ∆AUC = 0.032, p = 0.004; IDI = 0.053, p < 0.001). Moreover, including NAR as an additional predictor improved the reclassification ability of the SAHIT model (NRI = 0.151, p = 0.015), and details of the reclassification improvement were shown in Supplementary Table S9. According to the DCA in Figure 4D, SAHIT+NAR also showed higher clinical usefulness in the validation cohort.
Model calibrationWe demonstrate the calibration plot in Supplementary Figures S3, S4, and there was no significant evidence of miscalibration. None of the original and developed models got a brier score over 0.25, where lower scores signify better calibration.
Sensitivity analysisIn the sensitivity analysis, as shown in Supplementary Tables S10, S11, adding markers as categorical variables reduced the improvement of the predictive ability. Meanwhile, the addition of the interaction terms, including NAR and age, WFNS grade, Fisher grade, or treatment, failed to develop the SAFIRE+NAR or SAHIT+NAR model (Supplementary Table S12).
Model presentationTo better use the developed SAFIRE and SAHIT model, we developed two web-based nomograms, accessible at https://sahit-nar.shinyapps.io/SAHIT-NAR/ and https://sahit-nar.shinyapps.io/SAFIRE-NAR/. The presentation of the webs was presented in Supplementary Figures S5, S6.
DiscussionThis study demonstrated that inflammatory markers could improve the predictive effectiveness of existing models, including discrimination, reclassification, and clinical usefulness. The predictive ability of various inflammatory markers was compared through temporal validation, and it was found that NAR had the best predictive improvement ability. An online calculator was developed for the improved models to facilitate further validation and application.
The involvement of inflammatory response in the acute phase of aSAH may be the source of the ability of inflammatory indicators to predict short-term outcomes of aSAH (23). Studies have reported a peak of inflammatory cytokines within 48 h after the onset of aSAH (24). An excessive inflammatory response leads to a poor prognosis for aSAH (25). Due to the destruction of BBB, peripheral immune cells and their products will also affect the central nervous system. Neutrophils produce oxygen-free radicals and proteolytic enzymes that damage neurons and endothelial cells (26). In recent studies, albumin has been suggested to have a possible protective effect on BBB (27). Many clinical studies have also shown that high neutrophils are associated with prognosis in patients with aSAH (28), while hypoproteinemia is associated with infection during hospitalization (29, 30). This may be the NAR’s mechanism for predicting the outcome of aSAH.
Many previous studies have compared the predictive effects of inflammatory factors alone instead of included in a complete model (31, 32). As shown in Figure 2, Tables 2, 3, we found that the predictive power of inflammatory markers alone was not parallel to their ability to improve the predictive models. In a prediction model proposed by Lai et al. (33), although NLR was included, it was not reported how the inclusion of NLR improved the prediction efficiency of the model. Similarly, in the TAPS model presented by Li et al. (34), the contribution of white blood cells (WBC) to the model was not reported. Moreover, the same predictors (NLR and WBC) presented different predictive performances in the two studies. When demographic information, imaging information, clinical status, laboratory examination, and other indicators of different dimensions are combined, it was unknown whether inflammatory factors could improve the prediction effect of the original model. Therefore, it was necessary to quantify the predictive value of inflammatory factors in the same basic model. Figure 3 showed that in the SAFIRE and SAHIT models, WFNS always had the highest predictive ability. In contrast, the contribution of variables including age, aneurysm location, and size to the model lagged far behind that of WFNS. As shown in Supplementary Figure S2, after adding inflammatory markers to the models and comparing their partial R2, we found that the contribution of all inflammatory markers except SII ranked in the top three, and NAR had the highest contribution among them.
At the same time, we compared the differentiation ability of inflammatory factors and, furtherly, their reclassification ability. NRI can reflect the degree to which the improved model differentiates patients at different risk levels. Although NRI has been used in previous studies (35, 36), these studies reported continuous NRI, which is less explanatory than categorical NRI. We found 7–8% NRI for including NAR in the derivation cohort and 10–15% NRI in the validation cohort. Further reclassification analysis found that NAR was better able to identify high-risk (>65%) aSAH patients, which can help to distinguish early and intervene early in clinical practice. In addition, we demonstrated that NAR is a stable and reliable predictor across periods.
Apart from the outstanding discriminative and reclassification ability, NAR also had a significant value in clinical application in other aspects. First, NAR is an inexpensive and easy-to-use inflammatory marker. Neutrophil and albumin levels are routine in-hospital tests for aSAH patients, and the calculation is simple. Moreover, neutrophil and albumin levels are easy targets for clinical intervention. Human albumin treatment can be used to treat hypoalbuminemia. The 1.25 g/kg/day albumin therapy for SAH patients was reported to be tolerable without major complications and might be neuroprotective (37). Furthermore, neutrophil depletion following SAH was suggested to increase memory via NMDA receptors (38). However, this biomarker ratio still could not be directly applied in clinical practice. It should be furtherly proven beneficial in the laboratory and then carefully verified in the clinical trials.
This study has numerous strengths. Our study was based on a 10 year large cohort study, supporting our temporal validation. In addition, we obtained the accurate survival status of the enrolled patients at 3 months through the household registration system. Third, we used various methods to quantify how inflammatory factors improved the prediction model. The web-based prognostic calculator can also improve the clinical application value of this study.
However, our study had some limitations. This study was a single-center retrospective study, which could not support us in conducting geographical validation. Further multi-center studies could overcome the limitations of single-center temporal validation. In addition, due to retrospective collection, part of the data was lost. Although multiple imputations were carried out, the feasibility of the research conclusion was reduced. Third, we did not obtain the functional outcome of patients, which prevented us from proving that inflammatory factors were equally good at predicting the functional outcome of aSAH patients.
This study suggested that more attention should be paid to inflammatory indicators when establishing aSAH prediction models. We also preliminarily demonstrated that the combined use of NAR improved the predictive performance of existing prediction models. NAR was an inexpensive and convenient early laboratory index that deserves further clinical validation in more prospective multicenter studies.
ConclusionThis study illustrated that among the inflammatory markers associated with aSAH prognosis, NAR could improve the SAFIRE and SAHIT models for the 3-month mortality of aSAH.
Data availability statementThe original contributions presented in the study are included in the article/Supplementary material, further inquiries can be directed to the corresponding author.
Ethics statementThe studies involving human participants were reviewed and approved by the ethics committee of West China Hospital (No. 20211701). Written informed consent for participation was not required for this study in accordance with the national legislation and the institutional requirements.
Author contributionsRZ, YZ, CY, LM, and FF: study concept and design. RZ, YZ, ZL, YP, YH, and JY: acquisition, analysis, or interpretation of data. RZ, YZ, and ZL: statistical analysis. RZ: drafting of the manuscript. RZ, YZ, ZL, YP, YH, JY, CY, LM, and FF: critical revision of the manuscript for important intellectual content. All authors contributed to the article and approved the submitted version.
FundingThis work is supported by National Key R&D Program of China (2018YFA0108604) (LM), National Natural Science Foundation of China (82271364) (YZ), the innovation team project of Affiliated Hospital of Clinical Medicine College of Chengdu University (CDFYCX202202) (YZ), the project of Sichuan Science and Technology Bureau (22ZDYF0798) (FF), and Clinical Incubation Program of West China Hospital, SCU (2018HXFU008) (LM).
Conflict of interestThe authors declare that the research was conducted in the absence of any commercial or financial relationships that could be construed as a potential conflict of interest.
Publisher’s noteAll claims expressed in this article are solely those of the authors and do not necessarily represent those of their affiliated organizations, or those of the publisher, the editors and the reviewers. Any product that may be evaluated in this article, or claim that may be made by its manufacturer, is not guaranteed or endorsed by the publisher.
Supplementary materialThe Supplementary material for this article can be found online at: https://www.frontiersin.org/articles/10.3389/fneur.2023.1078926/full#supplementary-material
AbbreviationsaSAH, aneurysmal subarachnoid hemorrhage; NAR, neutrophil-to-albumin ratio; SII, systemic immune-inflammation index; WFNS, World Federation of Neurological Surgeons; AUC, area under the receiver operator characteristics curve; IDI, integrated discrimination improvement; NRI, net reclassification improvement; DCA, decision-curve analysis; VIF, variance inflation factor.
References1.Feigin, VL, Lawes, CMM, Bennett, DA, Barker-Collo, SL, and Parag, V. Worldwide stroke incidence and early case fatality reported in 56 population-based studies: a systematic review. Lancet Neurol. (2009) 8:355–69. doi: 10.1016/S1474-4422(09)70025-0
PubMed Abstract | CrossRef Full Text | Google Scholar
2.Galea, JP, Dulhanty, L, and Patel, HC, Uk, Ireland Subarachnoid Hemorrhage Database C. Predictors of outcome in aneurysmal subarachnoid hemorrhage patients: observations from a multicenter data set. Stroke. (2017) 48:2958–63. doi: 10.1161/STROKEAHA.117.017777
CrossRef Full Text | Google Scholar
3.Al-Khindi, T, Macdonald, RL, and Schweizer, TA. Cognitive and functional outcome after aneurysmal subarachnoid hemorrhage. Stroke. (2010) 41:e519–36. doi: 10.1161/STROKEAHA.110.581975
PubMed Abstract | CrossRef Full Text | Google Scholar
4.van Donkelaar, CE, Bakker, NA, Birks, J, Veeger, N, Metzemaekers, JDM, Molyneux, AJ, et al. Prediction of outcome after aneurysmal subarachnoid hemorrhage. Stroke. (2019) 50:837–44. doi: 10.1161/STROKEAHA.118.023902
CrossRef Full Text | Google Scholar
5.Jaja, BNR, Saposnik, G, Lingsma, HF, Macdonald, E, Thorpe, KE, Mamdani, M, et al. Development and validation of outcome prediction models for aneurysmal subarachnoid haemorrhage: the sahit multinational cohort study. BMJ. (2018) 360:j5745. doi: 10.1136/bmj.j5745
CrossRef Full Text | Google Scholar
6.Muroi, C, Hugelshofer, M, Seule, M, Tastan, I, Fujioka, M, Mishima, K, et al. Correlation among systemic inflammatory parameter, occurrence of delayed neurological deficits, and outcome after aneurysmal subarachnoid hemorrhage. Neurosurgery. (2013) 72:367-375; discussion 375. doi: 10.1227/NEU.0b013e31828048ce
PubMed Abstract | CrossRef Full Text | Google Scholar
7.Zhang, X, Zhang, S, Wang, C, and Li, A. Neutrophil-to-albumin ratio as a novel marker predicting unfavorable outcome in aneurysmal subarachnoid hemorrhage. J Clin Neurosci. (2022) 99:282–8. doi: 10.1016/j.jocn.2022.03.027
PubMed Abstract | CrossRef Full Text | Google Scholar
8.Giede-Jeppe, A, Reichl, J, Sprügel, MI, Lücking, H, Hoelter, P, Eyüpoglu, IY, et al. Neutrophil-to-lymphocyte ratio as an independent predictor for unfavorable functional outcome in aneurysmal subarachnoid hemorrhage. J Neurosurg. (2019) 132:400–7. doi: 10.3171/2018.9.JNS181975
PubMed Abstract | CrossRef Full Text | Google Scholar
9.Tao, C, Wang, J, Hu, X, Ma, J, Li, H, and You, C. Clinical value of neutrophil to lymphocyte and platelet to lymphocyte ratio after aneurysmal subarachnoid hemorrhage. Neurocrit Care. (2017) 26:393–401. doi: 10.1007/s12028-016-0332-0
PubMed Abstract | CrossRef Full Text | Google Scholar
10.Feghali, J, Kim, J, Gami, A, Rapaport, S, Caplan, JM, McDougall, CG, et al. Monocyte-based inflammatory indices predict outcomes following aneurysmal subarachnoid hemorrhage. Neurosurg Rev. (2021) 44:3499–507. doi: 10.1007/s10143-021-01525-1
PubMed Abstract | CrossRef Full Text | Google Scholar
11.Li, Y, Wen, D, Cui, W, Chen, Y, Zhang, F, Yuan, M, et al. The prognostic value of the acute phase systemic immune-inflammation index in patients with intracerebral hemorrhage. Front Neurol. (2021) 12:628557. doi: 10.3389/fneur.2021.628557
PubMed Abstract | CrossRef Full Text | Google Scholar
12.Connolly, ES Jr, Rabinstein, AA, Carhuapoma, JR, Derdeyn, CP, Dion, J, Higashida, RT, et al. Guidelines for the management of aneurysmal subarachnoid hemorrhage: a guideline for healthcare professionals from the american heart association/american stroke association. Stroke. (2012) 43:1711–37. doi: 10.1161/STR.0b013e3182587839
CrossRef Full Text | Google Scholar
13.Salmerón Gómez, R, Rodríguez Sánchez, A, García, CG, and García, PJ. The vif and mse in raise regression. Mathematics. (2020) 8:605. doi: 10.3390/math8040605
CrossRef Full Text | Google Scholar
15.Sun, J, Guo, X, Lu, Z, Fu, Z, Li, X, Chu, J, et al. The gap between cause-of-death statistics and household registration reports in Shandong, China during 2011-2013: evaluation and adjustment for underreporting in the mortality data for 262 subcounty level populations. PLoS One. (2018) 13:e0199133. doi: 10.1371/journal.pone.0199133
PubMed Abstract | CrossRef Full Text | Google Scholar
16.Van Buuren, S, and Groothuis-Oudshoorn, K. Mice: multivariate imputation by chained equations in R. J Stat Softw. (2011) 45:1–67. doi: 10.18637/jss.v045.i03
CrossRef Full Text | Google Scholar
17.DeLong, ER, DeLong, DM, and Clarke-Pearson, DL. Comparing the areas under two or more correlated receiver operating characteristic curves: a nonparametric approach. Biometrics. (1988) 44:837–45. doi: 10.2307/2531595
CrossRef Full Text | Google Scholar
18.Macdonald, RL, and Schweizer, TA. Spontaneous subarachnoid haemorrhage. Lancet. (2017) 389:655–66. doi: 10.1016/S0140-6736(16)30668-7
CrossRef Full Text | Google Scholar
21.Ikeda, M, Itoh, S, Ishigaki, T, and Yamauchi, K. Application of resampling techniques to the statistical analysis of the brier score. Methods Inf Med. (2001) 40:259–64. doi: 10.1055/s-0038-1634163
PubMed Abstract | CrossRef Full Text | Google Scholar
22.Riley, RD, Ensor, J, Snell, KIE, Harrell, FE Jr, Martin, GP, Reitsma, JB, et al. Calculating the sample size required for developing a clinical prediction model. BMJ. (2020) 368:m441. doi: 10.1136/bmj.m441
CrossRef Full Text | Google Scholar
23.Savarraj, JPJ, Parsha, K, Hergenroeder, GW, Zhu, L, Bajgur, SS, Ahn, S, et al. Systematic model of peripheral inflammation after subarachnoid hemorrhage. Neurology. (2017) 88:1535–45. doi: 10.1212/WNL.0000000000003842
PubMed Abstract | CrossRef Full Text | Google Scholar
24.Helbok, R, Schiefecker, AJ, Beer, R, Dietmann, A, Antunes, AP, Sohm, F, et al. Early brain injury after aneurysmal subarachnoid hemorrhage: a multimodal neuromonitoring study. Crit Care. (2015) 19:75. doi: 10.1186/s13054-015-0809-9
PubMed Abstract | CrossRef Full Text | Google Scholar
25.Ahn, SH, Savarraj, JPJ, Parsha, K, Hergenroeder, GW, Chang, TR, Kim, DH, et al. Inflammation in delayed ischemia and functional outcomes after subarachnoid hemorrhage. J Neuroinflammation. (2019) 16:213. doi: 10.1186/s12974-019-1578-1
PubMed Abstract | CrossRef Full Text | Google Scholar
26.Manda-Handzlik, A, and Demkow, U. The brain entangled: the contribution of neutrophil extracellular traps to the diseases of the central nervous system. Cells. (2019) 8:8. doi: 10.3390/cells8121477
CrossRef Full Text | Google Scholar
27.Xie, Y, Guo, H, Wang, L, Xu, L, Zhang, X, Yu, L, et al. Human albumin attenuates excessive innate immunity via inhibition of microglial mincle/syk signaling in subarachnoid hemorrhage. Brain Behav Immun. (2017) 60:346–60. doi: 10.1016/j.bbi.2016.11.004
PubMed Abstract | CrossRef Full Text | Google Scholar
28.Zhang, Y, Li, L, Jia, L, Li, T, Di, Y, Wang, P, et al. Neutrophil counts as promising marker for predicting in-hospital mortality in aneurysmal subarachnoid hemorrhage. Stroke. (2021) 52:3266–75. doi: 10.1161/STROKEAHA.120.034024
CrossRef Full Text | Google Scholar
29.Wang, P, Zhang, Y, Wang, X, Peng, L, Jia, L, Li, T, et al. Association between serum albumin and hospital-acquired infections after aneurysmal subarachnoid hemorrhage. Neurocrit Care. (2021) 37:424–34. doi: 10.1007/s12028-021-01421-y
CrossRef Full Text | Google Scholar
30.Shang, F, Zhao, H, Cheng, W, Qi, M, Wang, N, and Qu, X. Predictive value of the serum albumin level on admission in patients with spontaneous subarachnoid hemorrhage. Front Surg. (2021) 8:719226. doi: 10.3389/fsurg.2021.719226
PubMed Abstract | CrossRef Full Text | Google Scholar
31.Trifan, G, and Testai, FD. Systemic immune-inflammation (sii) index predicts poor outcome after spontaneous supratentorial intracerebral hemorrhage. J Stroke Cerebrovasc Dis. (2020) 29:105057. doi: 10.1016/j.jstrokecerebrovasdis.2020.105057
PubMed Abstract | CrossRef Full Text | Google Scholar
32.Bolton, WS, Gharial, PK, Akhunbay-Fudge, C, Chumas, P, Mathew, RK, and Anderson, IA. Day 2 neutrophil-to-lymphocyte and platelet-to-lymphocyte ratios for prediction of delayed cerebral ischemia in subarachnoid hemorrhage. Neurosurg Focus. (2022) 52:E4. doi: 10.3171/2021.12.FOCUS21642
PubMed Abstract | CrossRef Full Text | Google Scholar
33.Lai, X, Zhang, W, Ye, M, Liu, X, and Luo, X. Development and validation of a predictive model for the prognosis in aneurysmal subarachnoid hemorrhage. J Clin Lab Anal. (2020) 34:e23542. doi: 10.1002/jcla.23542
CrossRef Full Text | Google Scholar
34.Li, R, Lin, F, Chen, Y, Lu, J, Han, H, Ma, L, et al. A 90-day prognostic model based on the early brain injury indicators after aneurysmal subarachnoid hemorrhage: the taps score. Transl Stroke Res. (2022) 14:200–10. doi: 10.1007/s12975-022-01033-4
CrossRef Full Text | Google Scholar
35.Yang, X, Peng, J, Pang, J, Wan, W, Zhong, C, Peng, T, et al. The association between serum macrophage migration inhibitory factor and delayed cerebral ischemia after aneurysmal subarachnoid hemorrhage. Neurotox Res. (2020) 37:397–405. doi: 10.1007/s12640-019-00072-4
PubMed Abstract | CrossRef Full Text | Google Scholar
36.Fukuda, H, Lo, B, Yamamoto, Y, Handa, A, Yamamoto, Y, Kurosaki, Y, et al. Plasma d-dimer may predict poor functional outcomes through systemic complications after aneurysmal subarachnoid hemorrhage. J Neurosurg. (2017) 127:284–90. doi: 10.3171/2016.5.JNS16767
PubMed Abstract | CrossRef Full Text | Google Scholar
37.Suarez, JI, Martin, RH, Calvillo, E, Dillon, C, Bershad, EM, Macdonald, RL, et al. The albumin in subarachnoid hemorrhage (alisah) multicenter pilot clinical trial: safety and neurologic outcomes. Stroke. (2012) 43:683–90. doi: 10.1161/STROKEAHA.111.633958
PubMed Abstract | CrossRef Full Text | Google Scholar
38.Provencio, JJ, Swank, V, Lu, H, Brunet, S, Baltan, S, Khapre, RV, et al. Neutrophil depletion after subarachnoid hemorrhage improves memory via nmda receptors. Brain Behav Immun. (2016) 54:233–42. doi: 10.1016/j.bbi.2016.02.007
留言 (0)