
記住我


Magnocellular neurosecretory neurons (MNNs) in the supraoptic (SON) and paraventricular (PVN) hypothalamic nuclei synthesize and secrete the neuropeptides oxytocin (OT) and vasopressin (VP). In addition to being released from axonal terminals in the posterior pituitary, both neuropeptides are also released from somato-dendritic compartments (Brown et al., 2013, 2020; Ludwig and Stern, 2015). Dendritic release subserves distinct functions from those involved in systemic release, and these include autoregulation of MNNs activity, modulation of local synaptic efficacy, and interpopulation communication (Gouzènes et al., 1998; Hermes et al., 2000; Hirasawa et al., 2004; Son et al., 2013). A large body of evidence supports dendritic release to occur in an activity-dependent manner and in response to physiologically relevant stimuli, such as the release of VP triggered by an increase in plasma osmolality (Sato et al., 2011), and the release of OT induced by suckling or by the increase of melanocyte stimulating hormone (aMSH) (Bealer and Crowley, 1998; Sabatier et al., 2003; Sabatier and Leng, 2006). Still, there is conflicting information in the literature regarding whether dendritic release depends on action potentials invading retrogradely dendritic compartments (e.g., action potential backpropagating), as shown for other neurons in the brain (Bergquist and Ludwig, 2008). For example, neuropeptide dendritic release can occur in the absence of action potentials (Son et al., 2013; Pitra et al., 2019) and independently of axonal release (Ludwig et al., 2002; Sabatier et al., 2003). Moreover, a study by Ludwig et al. showed that antidromic stimulation of axons in the pituitary failed to evoke dendritic release of VP unless the SON was primed with thapsigargin (Ludwig et al., 2005). This is functionally important because it further supports the notion that in MNNs, release from dendritic and axonal compartments can be evoked and regulated independently (Ludwig and Leng, 2006). The most striking example of this is represented by aMSH actions on oxytocin MNNs, which acting on MC4 receptors, it evokes dendritic release of oxytocin, while simultaneously inhibiting their firing activity, thus reducing systemic axonal release of the same neuropeptide (Sabatier et al., 2003). In addition, we recently showed that during pregnancy and lactation, aMSH-evoked axonal (but not dendritic) release of oxytocin was affected (Perkinson et al., 2022), further supporting a differential regulation dendritic vs. axonal release of the same peptide in the same neuron. Finally, action potential-independent dendritic release suggests that dendritic release in MNNs may occur in response to signals generated locally within the dendrites themselves.
One possible explanation for these inconsistent results is that under a basal physiological state, spikes fail to invade dendritic compartments, indicative of an electrical decoupling of SON dendrites from the spike initiation zone in the soma/axonal hillock.
Compared to other hypothalamic neurons including preautonomic (Stern, 2001), perinuclear zone (Armstrong and Stern, 1997) and GnRH neurons (Campbell et al., 2005; Herbison, 2021), MNNs have unique and distinctive morphological features, including a relatively large soma [dimensions up to 25–30 μm by 16–17 μm, membrane area ∼1,100–1,500 μm2 (Stern and Armstrong, 1998; Chen et al., 2022)] from where a relatively simple dendritic arborization emerges. MNNs have typically 1–3 primary dendrites (Stern and Armstrong, 1998; Chen et al., 2022) that ramified on average to no more than six levels (Stern and Armstrong, 1998) and have path lengths up to 300–500 μm (Stern and Armstrong, 1998). Moreover, MNNs contain specialized enlargements or swellings named varicosities (Stern, 2001; Ludwig and Stern, 2015), in which most of the neuropeptide cargo is stored, and from where release is believed to occur (Ludwig and Leng, 2006). These varicosities can often reach diameters up to 15 μm as shown both in fixed tissue (Ludwig and Leng, 2006) and more recently in vivo (Roy et al., 2021). Still, whether dendritic varicosities have an impact on electrotonic properties, and to what extent they could affect the ability of electrical signals to propagate between neuronal compartments is largely unknown.
Using computer modeling and the theory of electric circuits, we aimed in this study to explore possible and unique morphological aspect of SON MNNs, in particular the presence of dendritic varicosities, to assess their impact on the ability of electrical signals to propagate from the soma to dendritic compartments of MNNs.
In neurons, including MNNs, structural elements (axon, soma, dendrites) are electrically coupled by lateral currents, which flow in the intracellular and extracellular spaces (ICS and ECS, respectively) through conductive fluids having purely passive, linear ohmic properties (Jack et al., 1975; Segev and London, 2000). The ICS and ECS are shaped by the microgeometry of the neuron under study and surrounding neuronal and non-neuronal cells, including different type glial cells (Syková, 2004; Theodosis et al., 2008). Among the latter, the astrocytes, the most abundant type in the adult brain (Kettenmann and Ransom, 2005; Jäkel and Dimou, 2017), are of particular interest being as they are known for “wrapping” hypothalamic neurons by their processes, and this micromorphological feature changes depending on physiological and pathological conditions (Hatton, 1999; Langle et al., 2002; Theodosis et al., 2008). Consequences of such remodeling of neuron-glia microgeometry for neurons functioning remain poorly understood and thus attracted our attention in this study referring exclusively to astrocytes (and using general term “glia” as a synonym). Based on available data describing MNN microgeometry (Smith and Armstrong, 1990; Stern and Armstrong, 1998; Chen et al., 2022), we built biologically inspired cell models and explored geometry-related features of the somato-dendritic passive transfer of voltages and currents. To derive and solve model equations, we used methods of the theory of electro-geometrical coupling and parametric sensitivity of the dendritic transfer functions, which were systematically described earlier (Korogod and Kaspirzhny, 2008, 2011; Korogod and Tyc-Dumont, 2009). Using this approach, we specify how key cellular parameters, individually and collectively, influence the ability of electrical signals to backpropagate from the soma to dendritic compartments. These include dendritic stem diameter, varicosities, and size of the peri-dendritic space limited by astrocytic sheaths.
Under physiological conditions, MNN are tightly enwrapped by astrocyte processes to make the under-wrap peri-dendritic space very small. The obvious biophysical consequences of that are an increased resistance of a thinner extracellular fluid volume conductor and the correspondingly reduced electrotonic length constant for the dendritic attenuation (Rall, 1977). Importantly, the degree of astrocytic neuronal enwrapping changes in an activity- and state-dependent manner during physiological challenges such as lactation and dehydration (Hatton, 1999; Langle et al., 2002; Theodosis et al., 2008; Panatier, 2009). Thus, we considered this a physiologically relevant biophysical parameter that can also influence somato-dendritic electrical coupling.
Overall, our results predict electrical compartmentalization or decoupling between MNN soma and dendrites, in which the presence of a varicosity, along with thinner dendritic stem diameters and restricted peri-dendritic space due to insulating glial wrapping, may restrict backpropagating of action potentials in these neurons.
2. Materials and methods 2.1. General approachOur approach to the problem of electrical compartmentalization (decoupling) in MNNs was based on the theory of electro-geometrical coupling (Korogod and Tyc-Dumont, 2009) and its parametric sensitivity (Korogod and Kaspirzhny, 2008, 2011) in biophysically complex dendrites. For that, we represented MNNs by linear mathematical models comprising of cylinder-shaped passive soma and dendrites (Figure 1).
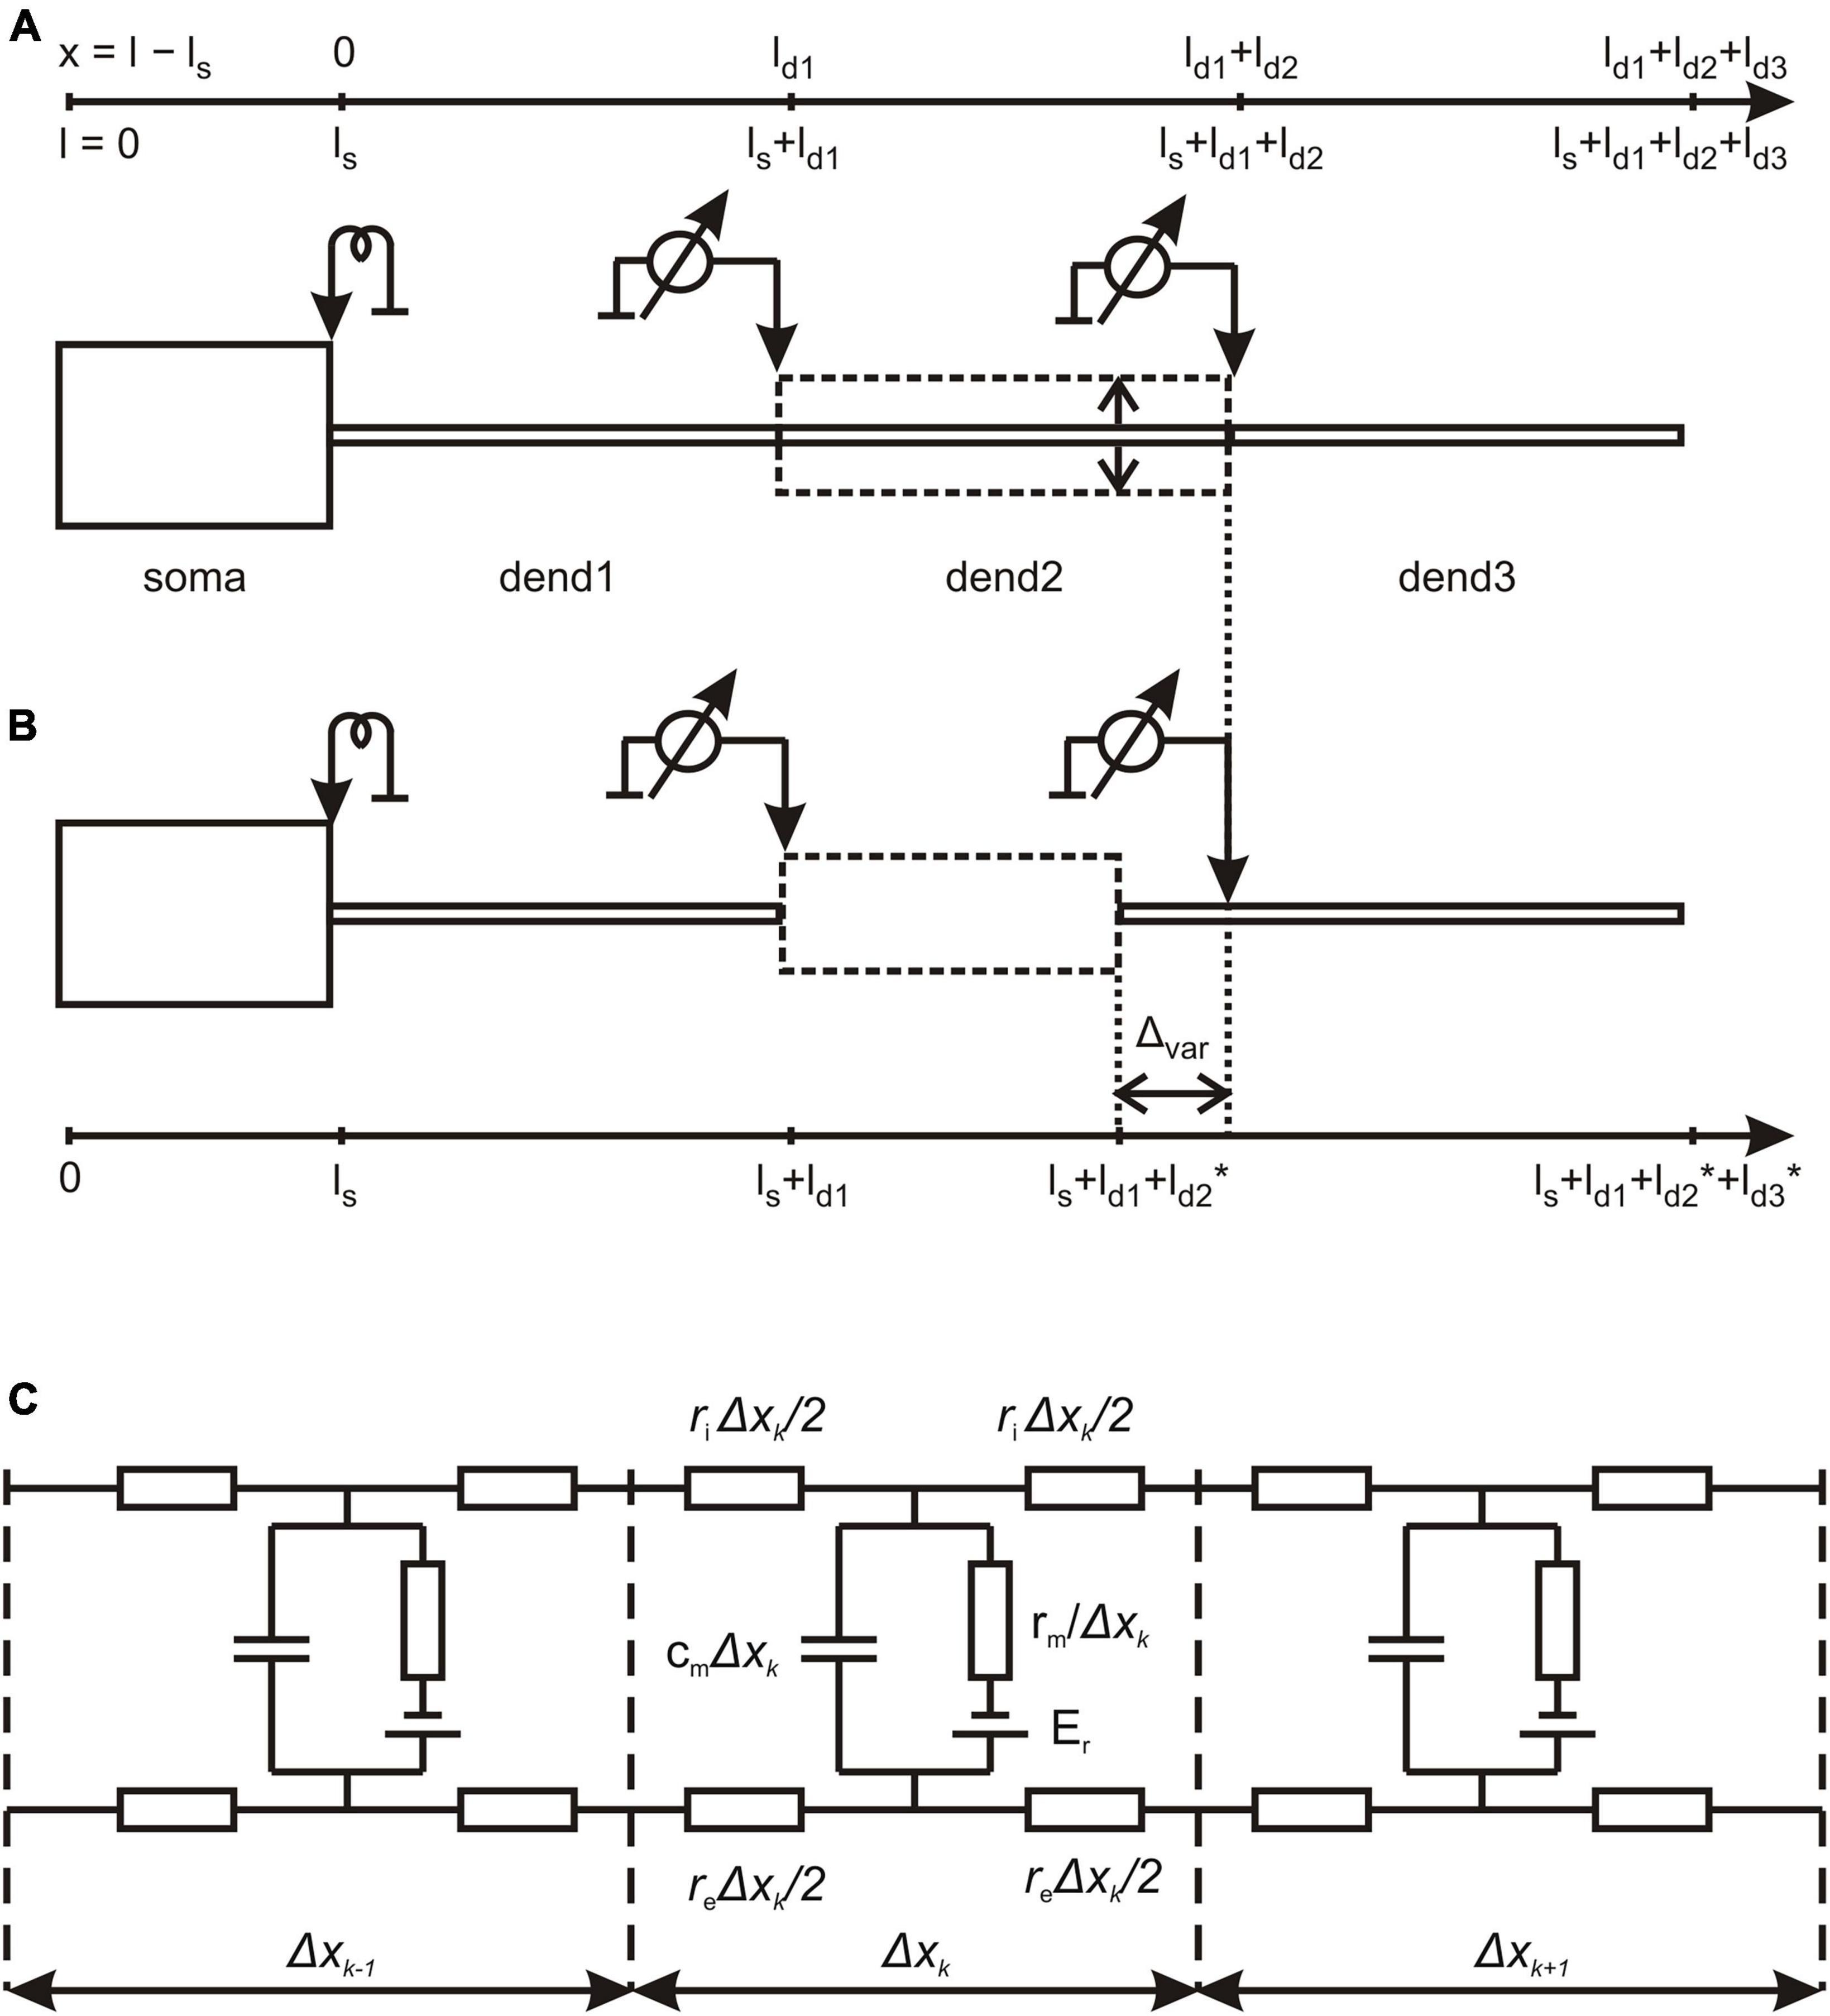
Figure 1. Structure of magnocellular neurosecretory neurons (MNN) models. (A) The reference configuration with dendritic compartments dend1, dend2, and dend3 of equal lengths and stem diameter (solid lines); dashed line indicates variation of dend2 diameter representing the varicosity. (B) The configuration, in which the varicose compartment dend2 has a varying length and the distal compartment dend3 has a co-varying length so that the total length of the three-compartment dendrite remains unchanged (see also Table 1). (C) The lamped equivalent electric circuit of dendritic cable with parameters per unit path length. Detailed explanations are given in the text.
The linear model is appropriate because (1) the linearization is a conventional first step in the analysis of non-linear systems, including neurons (Jack et al., 1975; Segev and London, 2000), and (2) electrical coupling between constituting parts of a neuron is performed via lateral currents flowing in passive conductive intra- and extra-cellular media (Jack et al., 1975; Korogod and Tyc-Dumont, 2009). The strength of electrical coupling between the soma and dendrite was quantified by the attenuation factor (AF) that is the ratio of the output voltage at a given dendritic site to the input (source) voltage at the soma: AF = Voutput/Vinput. Consequently, the output voltage is defined by the product of the input voltage and attenuation factor Voutput = AF⋅Vinput. The smaller AF the smaller Voutput and the greater attenuation. An alternative characteristic is the attenuation ratio that is the inverse value to the attenuation factor AR = 1/AF = Vinput/Voutput. The greater AR the smaller the output voltage and greater attenuation Voutput = Vinput/AR.
In the linear model framework, we first characterized the general biophysical mechanisms that underlie the decoupling effects of MNN-specific micro geometry of the dendrites and peri-dendritic space and then estimated the domains of parameters, which promoted the decoupling. The voltage transfer from the somatic source to dendritic sites was represented by the longitudinal path profiles of the membrane potential. The transfers of steady voltages were defined as stationary (steady state) solutions to the MNN model equations. In general, these were piecewise uniform linear cable equations, for which the definitional domain comprised of 1D space and time intervals, xk ∈ [0,lk] and t ∈ [0,τ], respectively, where lk is the length of k-th section of somatic or dendritic cylinder and τ is the observation time. In each section of a uniform diameter Dk, the membrane potential E(xk, t) was described by the equation (index k is omitted).
(1/(ri+re))⋅∂2E(x,t)/∂x2=cm⋅∂E(x,t)/∂t+gm⋅(E(x,t)-Er)(1)
where Er is the resting membrane potential; cm and gm are, respectively, the membrane capacitance and conductance per unit cable length; ri and re are, respectively, resistances of intracellular and extracellular media per unit cable length. These equations are supplemented by the initial conditions and boundary or coupling conditions. The initial condition was uniform rest potential E(x,0) = Er. At the junctions of consecutive k-th and (k+1)-th uniform sections, the coupling conditions were the membrane potential continuity E(lk, t) = E(xk+1 = 0, t) and the axial (core) current conservation Icore(lk, t) = Icore(xk+1 = 0, t). The latter equality is equivalent to setting the “leaky end” boundary condition at the end of k-th section such that its axial leak conductance equaled to the input conductance of (k+1)-th section: GLk = Ginp,k+1. The most distal dendrite terminated with the “sealed end” boundary condition assuming zero axial current and therefore the voltage gradient: ∂E(l,t)/∂x = 0. The solutions E(xk, t) to the model equations were obtained either numerically in NEURON simulation environment (Carnevale and Hines, 2006) or derived analytically in terms of deviation from the rest potential: V(xk, t) = E(xk, t) - Er. The attenuation factors were computed as the ratio of steady voltages.
AF(x)=V(x)/V(0)=(E(x)-E)r/(E(0)-E)r(2)
In this approximation, two values of the attenuation factor AF100 measured at a path distance of 100 μm from soma were chosen as possible landmarks of the decoupling. The values of AF100 ≤ 0.1 and AF100 ≤ 0.01 corresponded to one- and two-order attenuated voltages, which were considered, respectively, insufficient for triggering dendritic spikes and undistinguishable from noise. 100 μm path distance from soma was chosen as characteristic recording location that is approximately 1/3 to 1/5 of typical 300–500 μm path lengths of the prototype MNN dendrites (Stern and Armstrong, 1998). This approach was implemented in multicompartment linear cable models to explore the decoupling roles of MNN-specific micro-geometrical features of the dendrites (stem diameters, varicosities) and peri-dendritic space (glia sheath).
2.2. ModelsMagnocellular neurosecretory neurons models comprised of cylindrical soma and three-compartment dendrite (Figure 1A; Table 1).
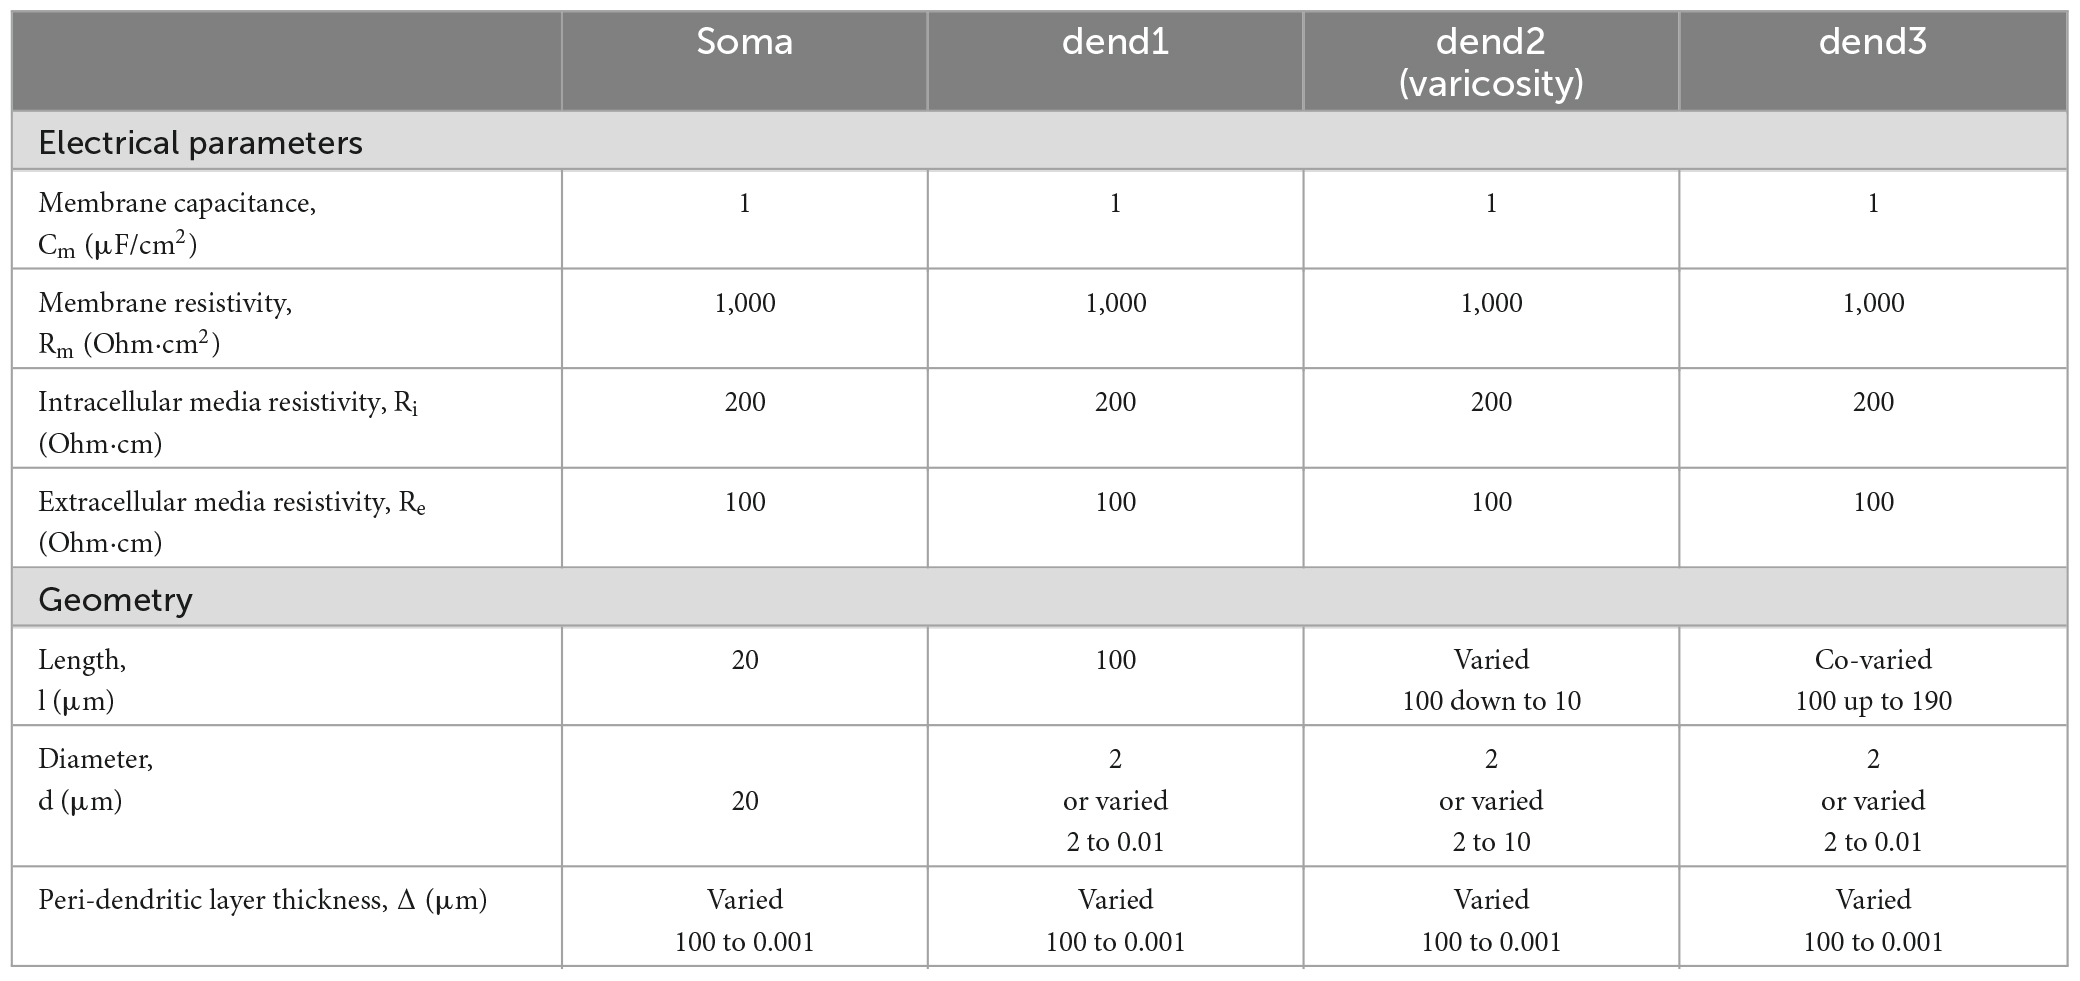
Table 1. Electrical and geometrical parameters of the modeled magnocellular neurosecretory neuron (MNN) in Figure 1.
2.2.1. GeometryThe length ls = 20 μm and diameter ds = 20 μm of the soma were fixed. In the basic (reference) configuration (Figure 1A, solid lines), the dendritic compartments (dend1, dend2, and dend3) had equal lengths ld1 = ld2 = ld3 = 100 μm and diameters d1 = d2 = d3 = 2 μm that made a uniform 300 μm long dendrite. In other configurations, the middle compartment dend2 represented the varicosity of a greater diameter d2 > d1 = d3 than those of equally thin proximal and distal compartments dend1 and dend3 representing the dendrite stem. In configurations with the varicosity length reduced by a decrement (ld2* = ld2–Δvar), the distal compartment length was incremented by the same value (ld3* = ld3+Δvar), whereas the proximal compartment remained unchanged and so did the total dendrite length (Figure 1B). The above configurations were extended by adding a cylindrical layer of thickness (width) Δ representing peri-dendritic space between dendrite and glia sheath filled with conductive fluid.
2.2.2. Electrical parametersThe model was characterized by a reference set of spatially uniform passive (linear) electrical parameters per unit membrane area, the capacitance Cm = 1 μF/cm2 and conductivity Gm = 1 mS/cm2 (or resistivity Rm = 1/Gm) associated with the resting membrane potential Er = -70 mV and the resistivity per unit volume of intracellular and extracellular conductive media, Ri = 200 Ohm⋅cm and Re = 100 Ohm⋅cm, respectively. Corresponding parameters per unit length of uniform cable compartment were cm = Cm⋅π⋅d, gm = Gm⋅π⋅d or rm = Rm/(π⋅d), ri = Ri/(π⋅d2/4), and re = Re/(π⋅(Δ⋅d+Δ2)), where d is the compartment diameter. Noteworthy, re is negligibly small so that re < < ri for Re≈Ri in case of excessively big Δ (large peri-dendritic space). Figure 1C shows the lamped equivalent electric circuit on example of three consecutive compartments of length Δxk with parameters per unit path length.
2.3. Protocols of simulationAn input steady voltage V0 is applied at the origin x1 = 0 of the proximal dendritic compartment dend1 and the output steady voltages V(x) are computed at different path distances x along the whole dendrite (x = xk ∈ [0,ldk], k = 1, 2, and 3 along, respectively, dend1, dend2, and dend3).
2.4. Analytical steady-state solutions to the model equations 2.4.1. Steady voltage transfer along non-uniform dendrite without glia wrappingEquation (1) rewritten in terms of the transmembrane voltage as the deviation of the membrane potential from its resting value V(x, t) = E(x, t)–Er is
(1/(ri+re))⋅∂2V(x,t)/∂x2=cm⋅∂V(x,t)/∂t+gm⋅V(x,t)(3)
In the steady state and in the absence of glia sheath (large peri-dendritic space), re < < ri it is reduced to
(1/ri)⋅(∂2V(x))/(∂x2)=V(x)/rm(4)
The membrane potentials along dend1 and dend2 (varicose) compartments are the solutions for leaky-end finite cables:
V(x1)=V(x1=0)⋅(cosh((l1−x1)/λ1)+(GL1/G∞1)⋅sinh((l1−x1)/λ1)))/
(cosh(l1/λ1)+(GL1/G∞1)⋅sinh(l1/λ1)),
V(x2)=V(x2=0)⋅(cosh((l2−x2)/λ2)+(GL2/G∞2)⋅sinh((l2−x2)))/
(cosh(l2/λ2)+(GL2/G∞2)⋅sinh(l2/λ2)),
whereas those along dend3 are the solutions for a sealed-end cable.
V(x3)=V(x3=0)⋅cosh((l3−x3)/λ3)/cosh(l3/λ3).
These solutions are coupled at the inter-compartment junctions according to the voltage continuity conditions:
V(x1=0)=V(xs=ls)=V0
V(x2=0)=V(x1=l1)⋅1/(cosh (l1/λ1)+(GL1/G∞1)
⋅sinh(l1/λ1)),
V(x3=0)=V(x2=l2)⋅1/(cosh (l2/λ2)+(GL2/G∞2)
⋅sinh(l2/λ)2).
The leak conductance at the end of each preceding compartment equals to the input conductance of the following compartment, which is either “leaky-end” (dend1 and dend2) or “sealed-end” cable:
Ginp1=G∞1⋅(tanh(l1/λ1)+GL1/G∞1)/(1+(GL1/G∞1)
⋅tanh(l1/λ1)),
Ginp2=G∞2⋅(tanh(l2/λ2)+GL2/G∞2)/(1+(GL2/G∞2)
⋅tanh(l2/λ2)),
Ginp3=G∞3⋅tanh(l3/λ3),
where characteristic conductances are
G∞s=(π/2)ds32Gms/Ris12,
G∞1=(π/2)d132Gm1/Ri112,
G∞2=(π/2)d232Gm2/Ri212,
G∞3=(π/2)d332Gm3/Ri312,
and space constants are
λs=rms/ris=(Rms⋅ds)/(4⋅Ris),
λ1=rm1/ri1=(Rm1⋅d1)/(4⋅Ri1),
λ2=rm2/ri2=(Rm2⋅d2)/(4⋅Ri2),
λ3=rm3/ri3=(Rm3⋅d3)/(4⋅Ri3).
The attenuation factor at a characteristic 100-μm distance from soma is
AF100=AF(x1=l1)=V(x1=l1)/V0=1/(cosh (l1/λ1)+
(GL1/G1)⋅sinh(l1/λ1)),
2.4.2. Accounting for glia wrappingIn case of small peri-dendritic space (small Δ thickness/width of an interstitial layer of conductive fluid between the outer membrane of MNN and glia), the condition re < < ri does not hold and the length constants for corresponding compartments are expressed [see e. g., Equation 2.18 in Rall (1977)] as:
λk=rmk/(rik+rek),
where rmk = Rm/(π⋅dk), rik=Ri/(π⋅dk2/4), and rek=Re/(π⋅(Δk⋅dk+Δk2)), k = s, 1, 2, 3 is the compartment index.
3. ResultsThe electrical compactness of a dendrite is estimated in terms of electrotonic length that is the ratio of its geometric path length l to the electrotonic length constant λ: L = l/λ. The greater λ the smaller the ratio l/λ, the smaller L and the more compact is the dendrite electrically. The latter also means smaller voltage attenuation with distance along the dendrite. Varicosed dendrites have sections of noticeably increased diameter that exemplify geometrical non-uniformity. In mathematical models, such non-uniform structures are represented by a sequence of uniform cylindrical sections with abrupt changes in diameter at their junctions and are called piecewise uniform. In a piecewise uniform dendrite, each uniform “piece” (section) is characterized by its own λ. The length constant λ generally includes micro-geometrical parameters of both the dendrite (diameter d) and the peri-dendritic space (thickness of conductive layer between the dendrite and glia sheath Δ; provided that Δ is essentially small). Therefore, we first explored the de-compacting effects of uniform and non-uniform (varicose) dendritic diameters and then those of peri-dendritic layer Δ.
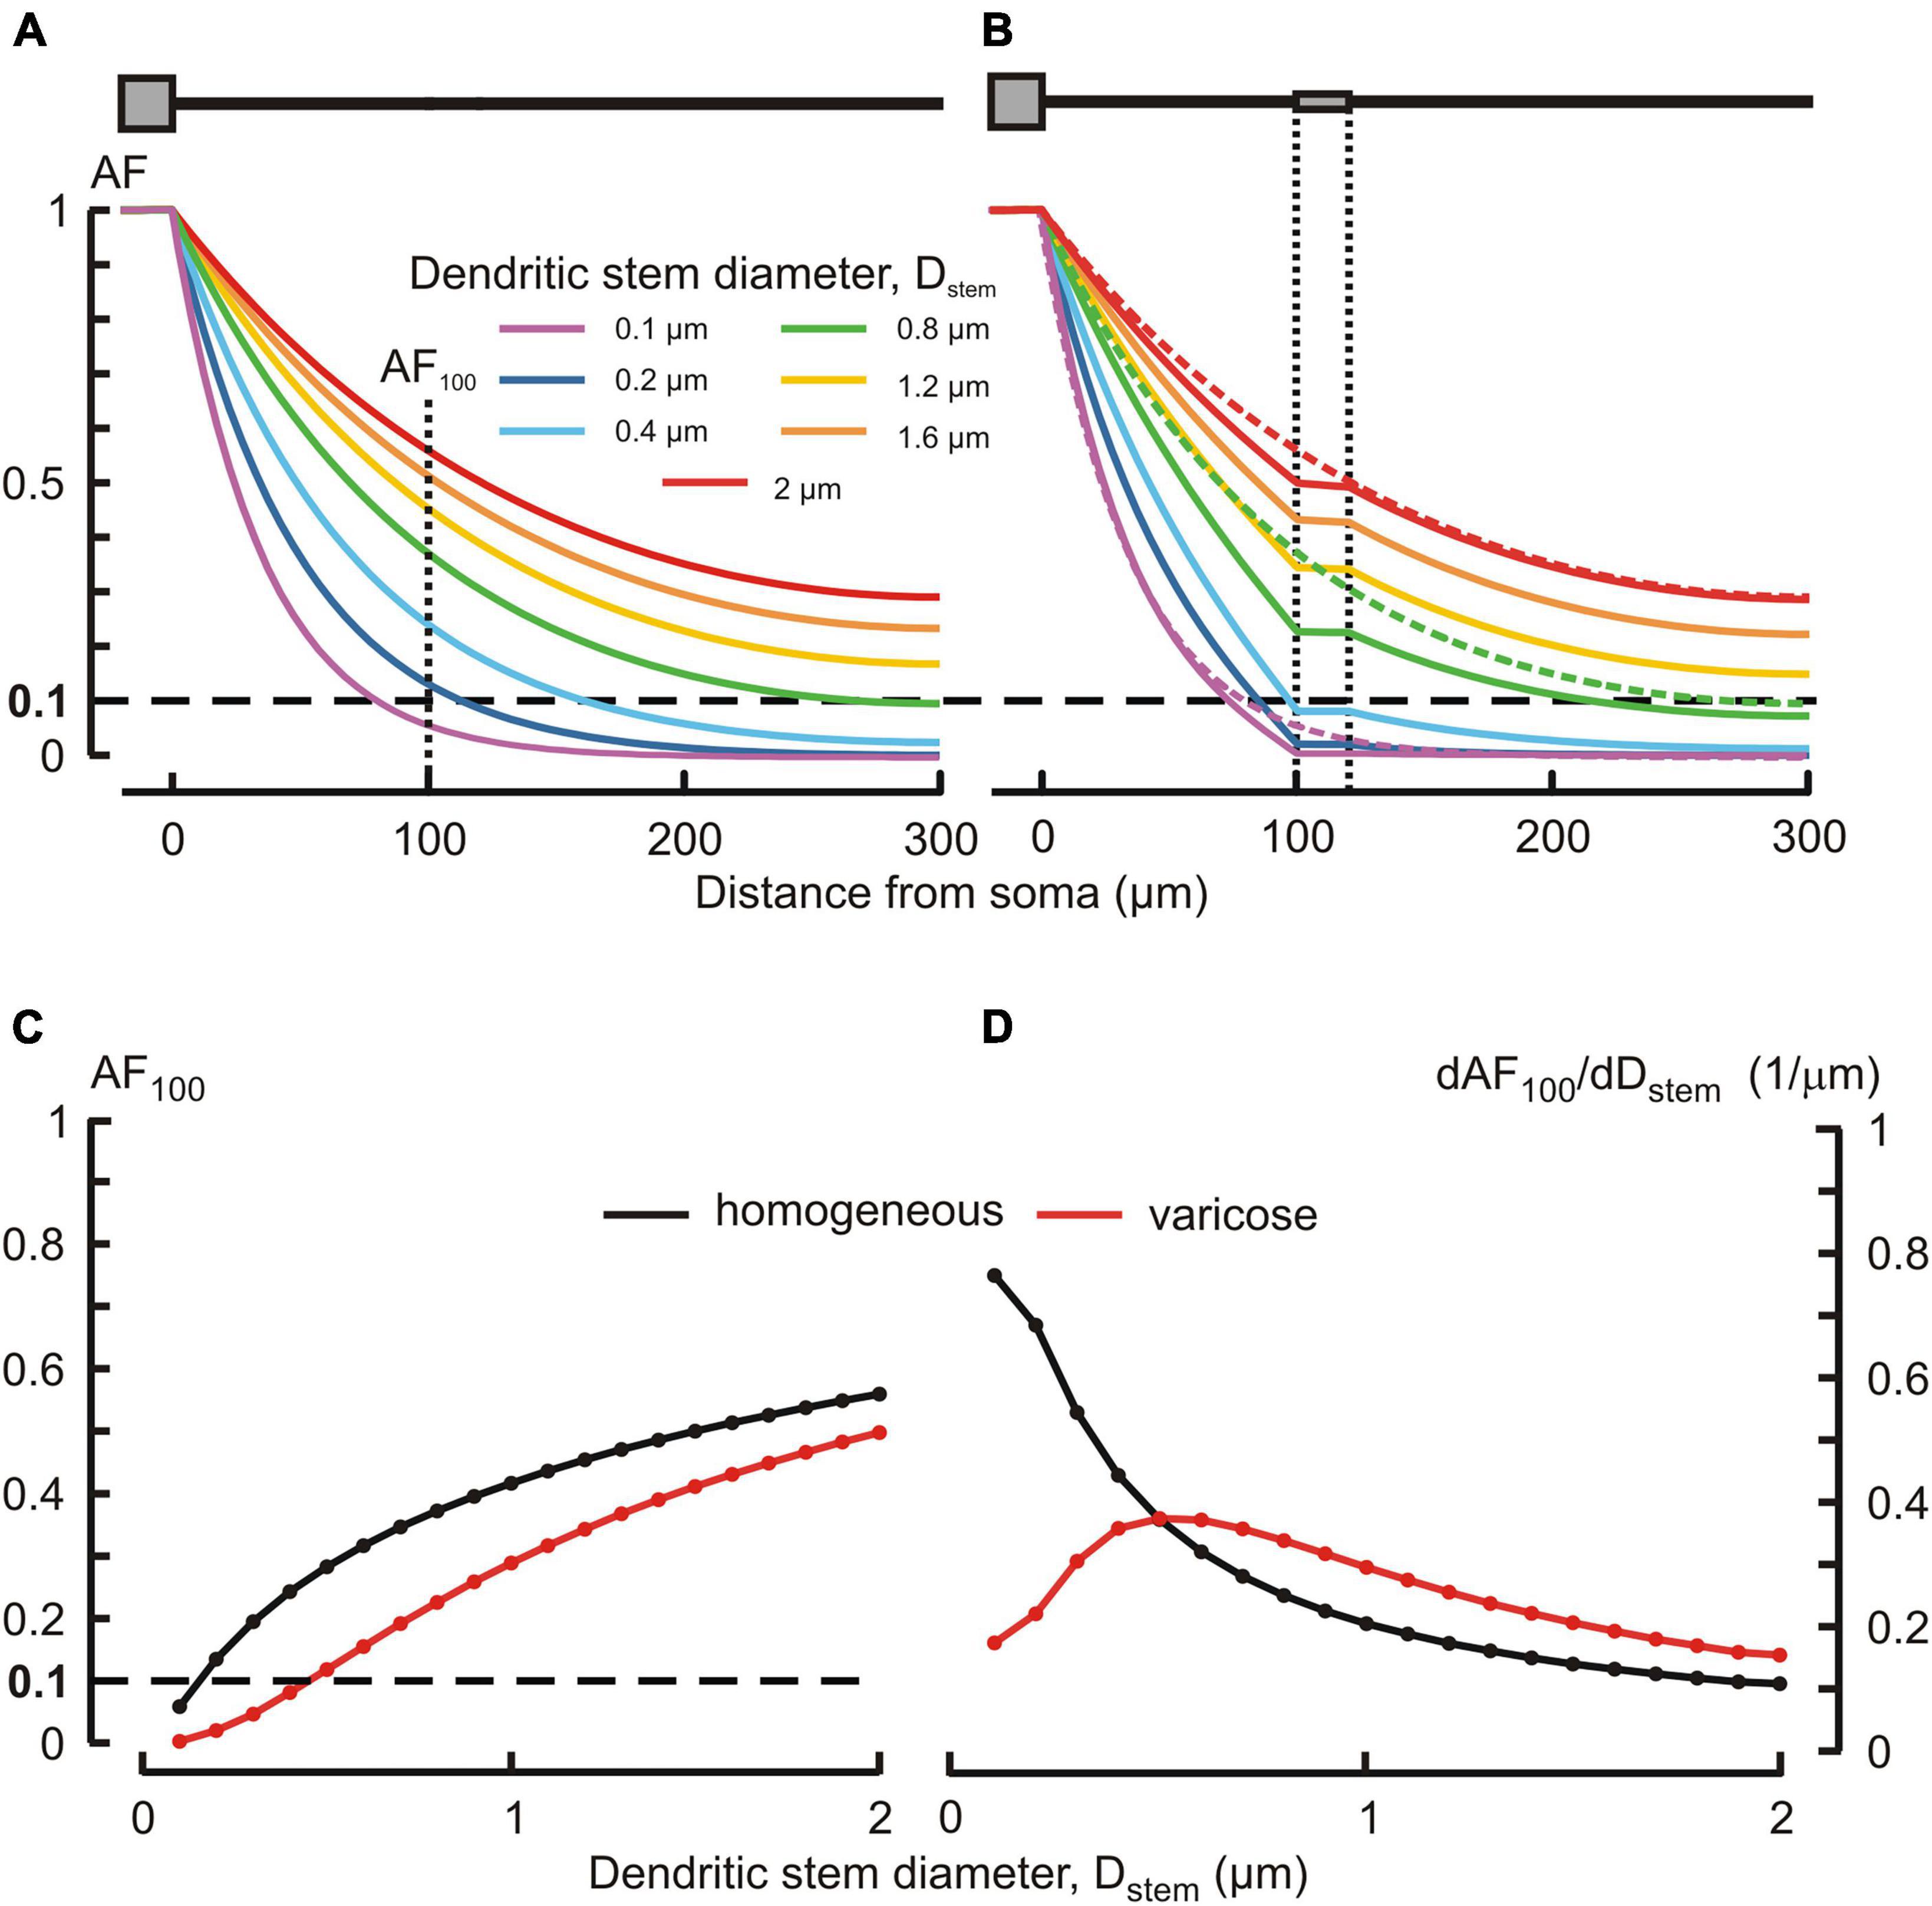
3.1. Effects of stem diameter and presence of a varicosity on dendritic voltage attenuationTypically, MNN dendrites are about 300–500 μm long, may have diameters of ∼2–3 μm at the origin from soma and are thinning to the limit of light microscope resolution (∼0.1 μm) at the distal ends. According open data on reconstructed dendritic morphology of mouse OT-ergic PV (Chen et al., 2022) and that of other hypothalamic neuron type (Scharbarg et al., 2016), the dendritic diameter at the origin can be as thin as ∼1 μm. Varicose extensions several times thicker than the stem are characteristic of MNN dendrites (Stern, 2001; Ludwig and Stern, 2015). In our simulated three-compartmental dendrite (Figure 1), the proximal and distal compartments (dend1 and dend3, respectively) corresponded to the stem and the middle one (dend2) corresponded to the varicosity. As a reference case, we considered somatofugal steady voltage attenuation along a uniform dendrite of total length ltot = l1+ l2+ l3 = 300 μm with all compartments equally thick d1 = d2 = d3 = Dstem = 2 μm and with the uniform membrane and intracellular media resistivity of 1 kOhm⋅cm2 and 200 Ohm⋅cm, respectively (Figure 2A, red line). Reducing the diameter Dstem from 2 to 0.1 μm reduced the length constant λ from 158.11 to 35.36 μm and correspondingly increased the steepness of steady voltage attenuation (same figure, color-coded lines). Consequently, the attenuation with a factor of 0.1 (i.e., more voltage attenuation) was reached at progressively shorter path distances from the input (soma) (Figure 2A, color lines, and Figure 2C). For instance, at 100 μm from soma (end of the proximal compartment of interest) such attenuation occurred if Dstem was reduced to 0.15 μm, and in case of the thinnest tested Dstem = 0.1 μm the most proximal site of 0.1 attenuation was x = 81 μm (Figure 2A, line “0.1 μm” and Figure 2C).
Figure 2. Effects of the dendritic stem diameter and presence of varicosity on the voltage attenuation along the dendrite. (A,B) Attenuation factor AF(x) (ordinate, dimensionless) as a function of the path distance from soma x (abscissa, μm) for different dendritic stem diameters Dstem (color-coded) in, respectively, the absence and presence of a varicosity of 20 μm length and μm diameter. Dotted lines in (B) represent plots of corresponding color in (A). (C) Attenuation factor at 100 μm from soma AF100 (ordinate, dimensionless) as a function of the dendrite stem diameter d1 = d3 = Dstem (abscissa, μm). (D) Sensitivity function of the attenuation factor dAF100/dDstem (ordinate, 1/μm) to changes in the Dstem (abscissa, μm) of homogeneous (black) and varicose (red) dendrite.
Introducing a 20 μm long 6 μm thick varicosity in the middle compartment (top insert in Figure 2B) led to noticeably greater voltage attenuations than observed along uniform dendrites of corresponding stem diameters (cf. Figures 2A, B, plots of same color). In the proximal compartment, the attenuation factor AF100 monotonously decreased with decreasing Dstem in both uniform and varicose cases (Figure 2C, black and red plots, respectively), being always smaller (i.e., greater voltage attenuation) in the latter case. Introducing the varicosity in the thinnest tested dendrite (Dstem = 0.1 μm) shifted the most proximal site of 0.1 attenuation closer to soma, from x = 81 to x = 72.5 μm (Figure 2B, line “0.1 μm”). The biophysical reason for that is explained by the “leaky-end” boundary condition for the proximal compartment. Greater attenuation is due to smaller current through the proximal compartment membrane and correspondingly greater core current leak into the varicose compartment as compared to that into uniform continuation. Increased leak at the proximal compartment end is provided by a greater input conductance (smaller input resistance) of the varicosity because the cross-section area of the latter is greater than that of the dendritic stem. The AF100 sensitivity to monotonous decrease of Dstem was monotonously increasing in case of the uniform dendrite, but in the varicose case it was bell-shaped with the maximum near Dstem = 0.5 μm (Figure 2D, black and red plots, respectively).
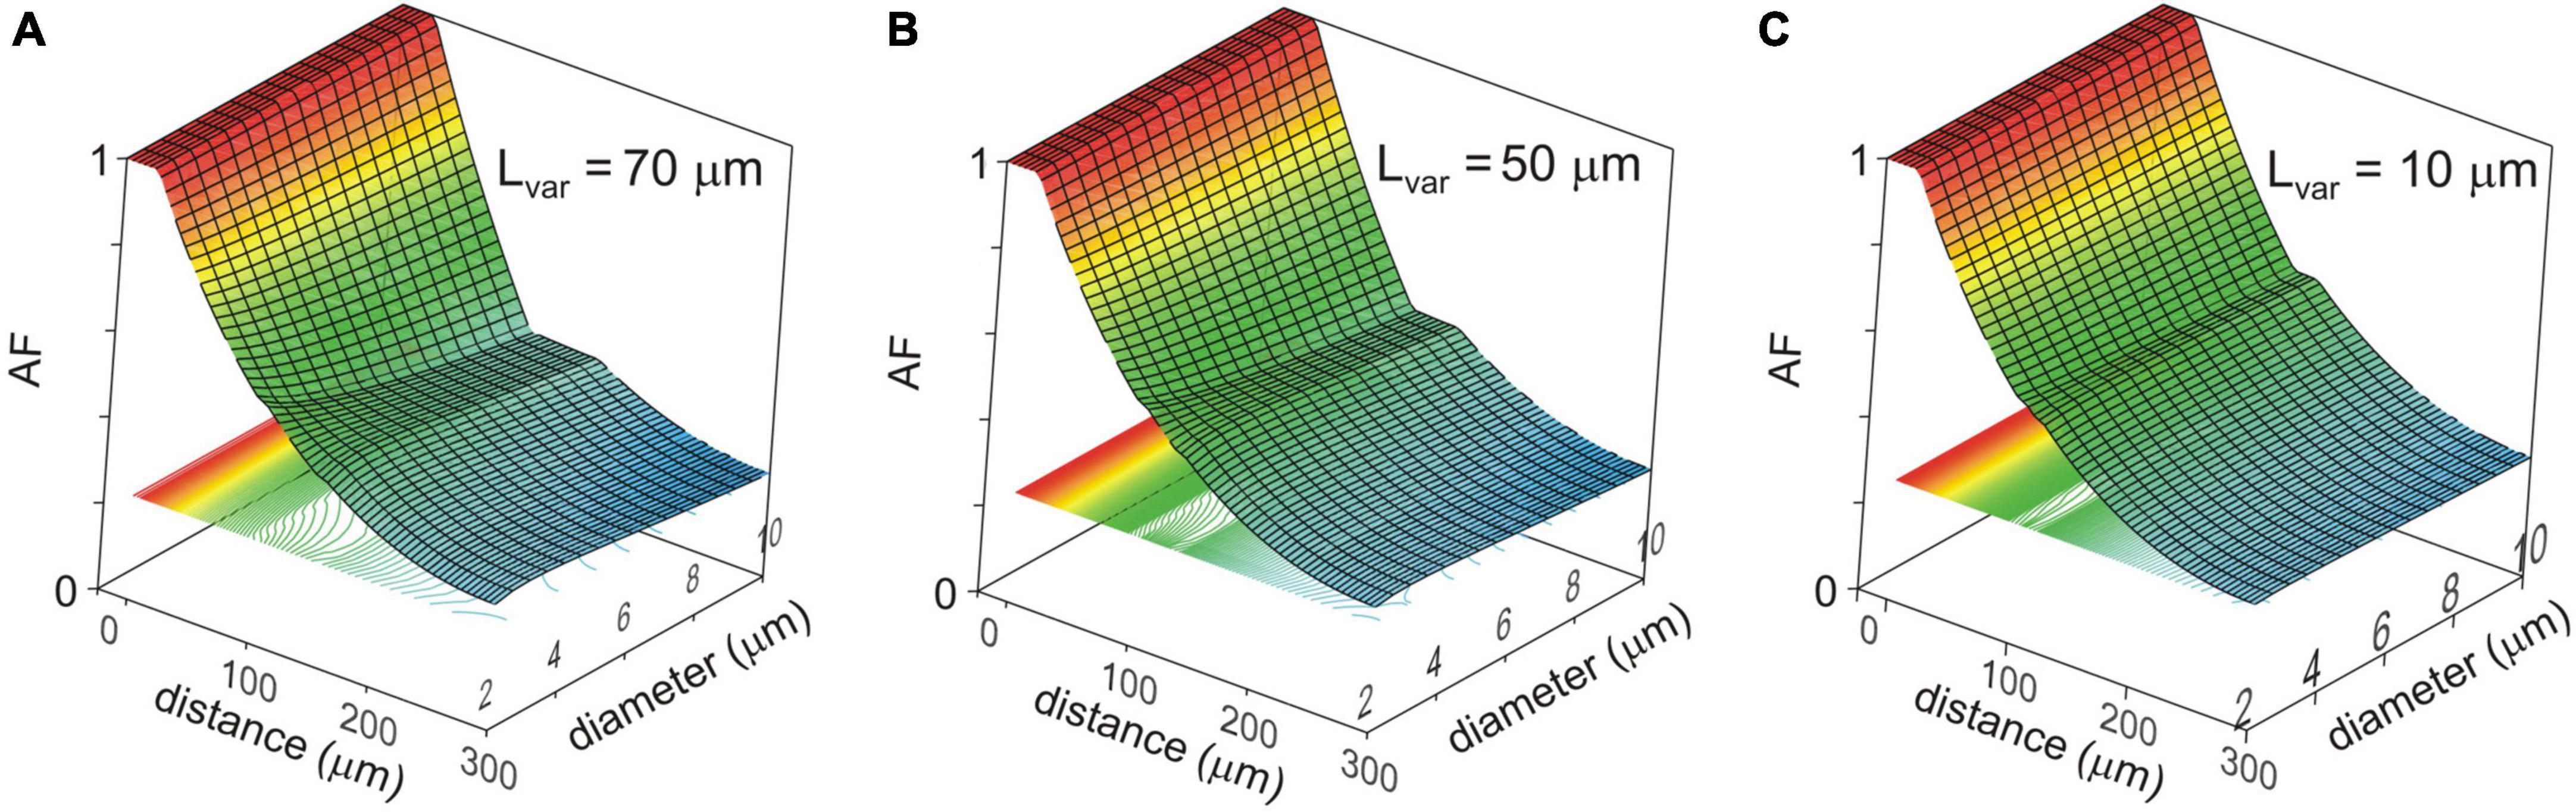
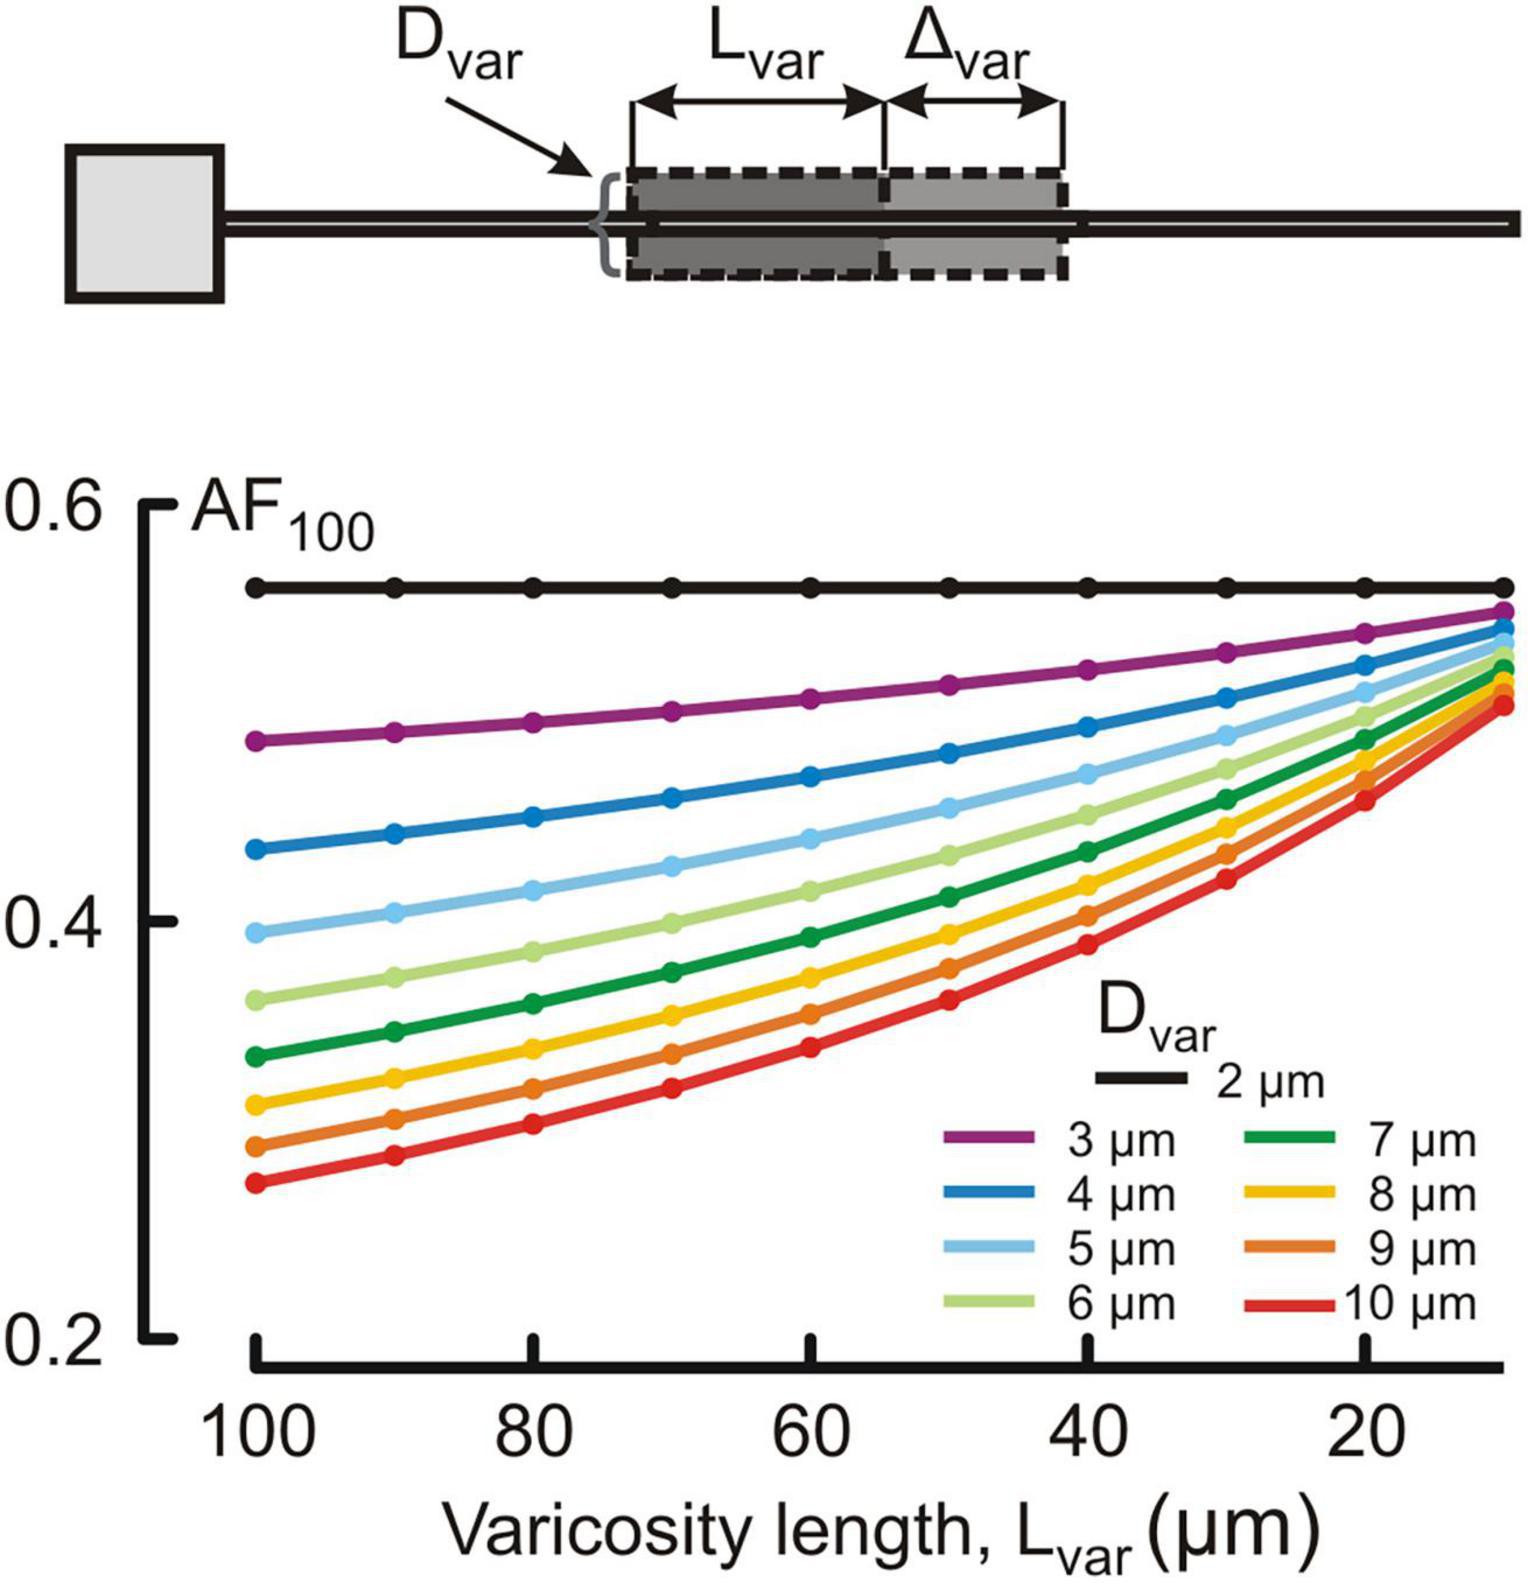
3.2. Combined effects of varicosity diameter and length on dendritic voltage attenuationChanges in the attenuation factors AF(x) with the path distance x along the non-uniform dendrite (fixed reference stem diameter Dstem = 2 μm) were computed for various combinations of the length Lvar and diameter Dvar of the varicose compartment. Lvar and Dvar varied in the ranges of 10–100 μm and 2–10 μm, respectively. Typical relations are shown in Figures 3A–C for the varicosity lengths Lvar = 70, 50, and 10 μm. The same relationships are represented in finer details by the attenuation factors computed at the end of the proximal compartment in 100 μm from soma AF(x = 100 μm) = AF100 in Figure 4. From Figures 3, 4, the following combined effects of varicosity diameter and length (dimensions) on the voltage attenuation in the proximal dendritic domain can be observed. On the one hand, for a given varicosity length, the thicker the varicosity the greater the voltage attenuation along the dendrite. On the other hand, for a given varicosity diameter, the shorter the varicosity the smaller the voltage attenuation. Biophysical explanations for these phenomena are provided below in the Discussion section.
Figure 3. Surface and contour plots of the color-coded attenuation factor (AF) (applicate, dimensionless) in function of the path distance from soma x (abscissa, μm) and varicosity diameter Dvar (ordinate, μm) for different varicose section lengths Lvar = 70, 50, and 10 μm (A–C). The AF range is subdivided into approximately 100 levels represented by the correspondingly colored contour plots in XY plane.
Figure 4. Dependence of the voltage attenuation factor at 100 μm from soma AF100 (ordinate, dimensionless) on the length Lvar of the varicose section dend2 (abscissa, μm) for different varicosity diameters Dvar (μm, color coded).
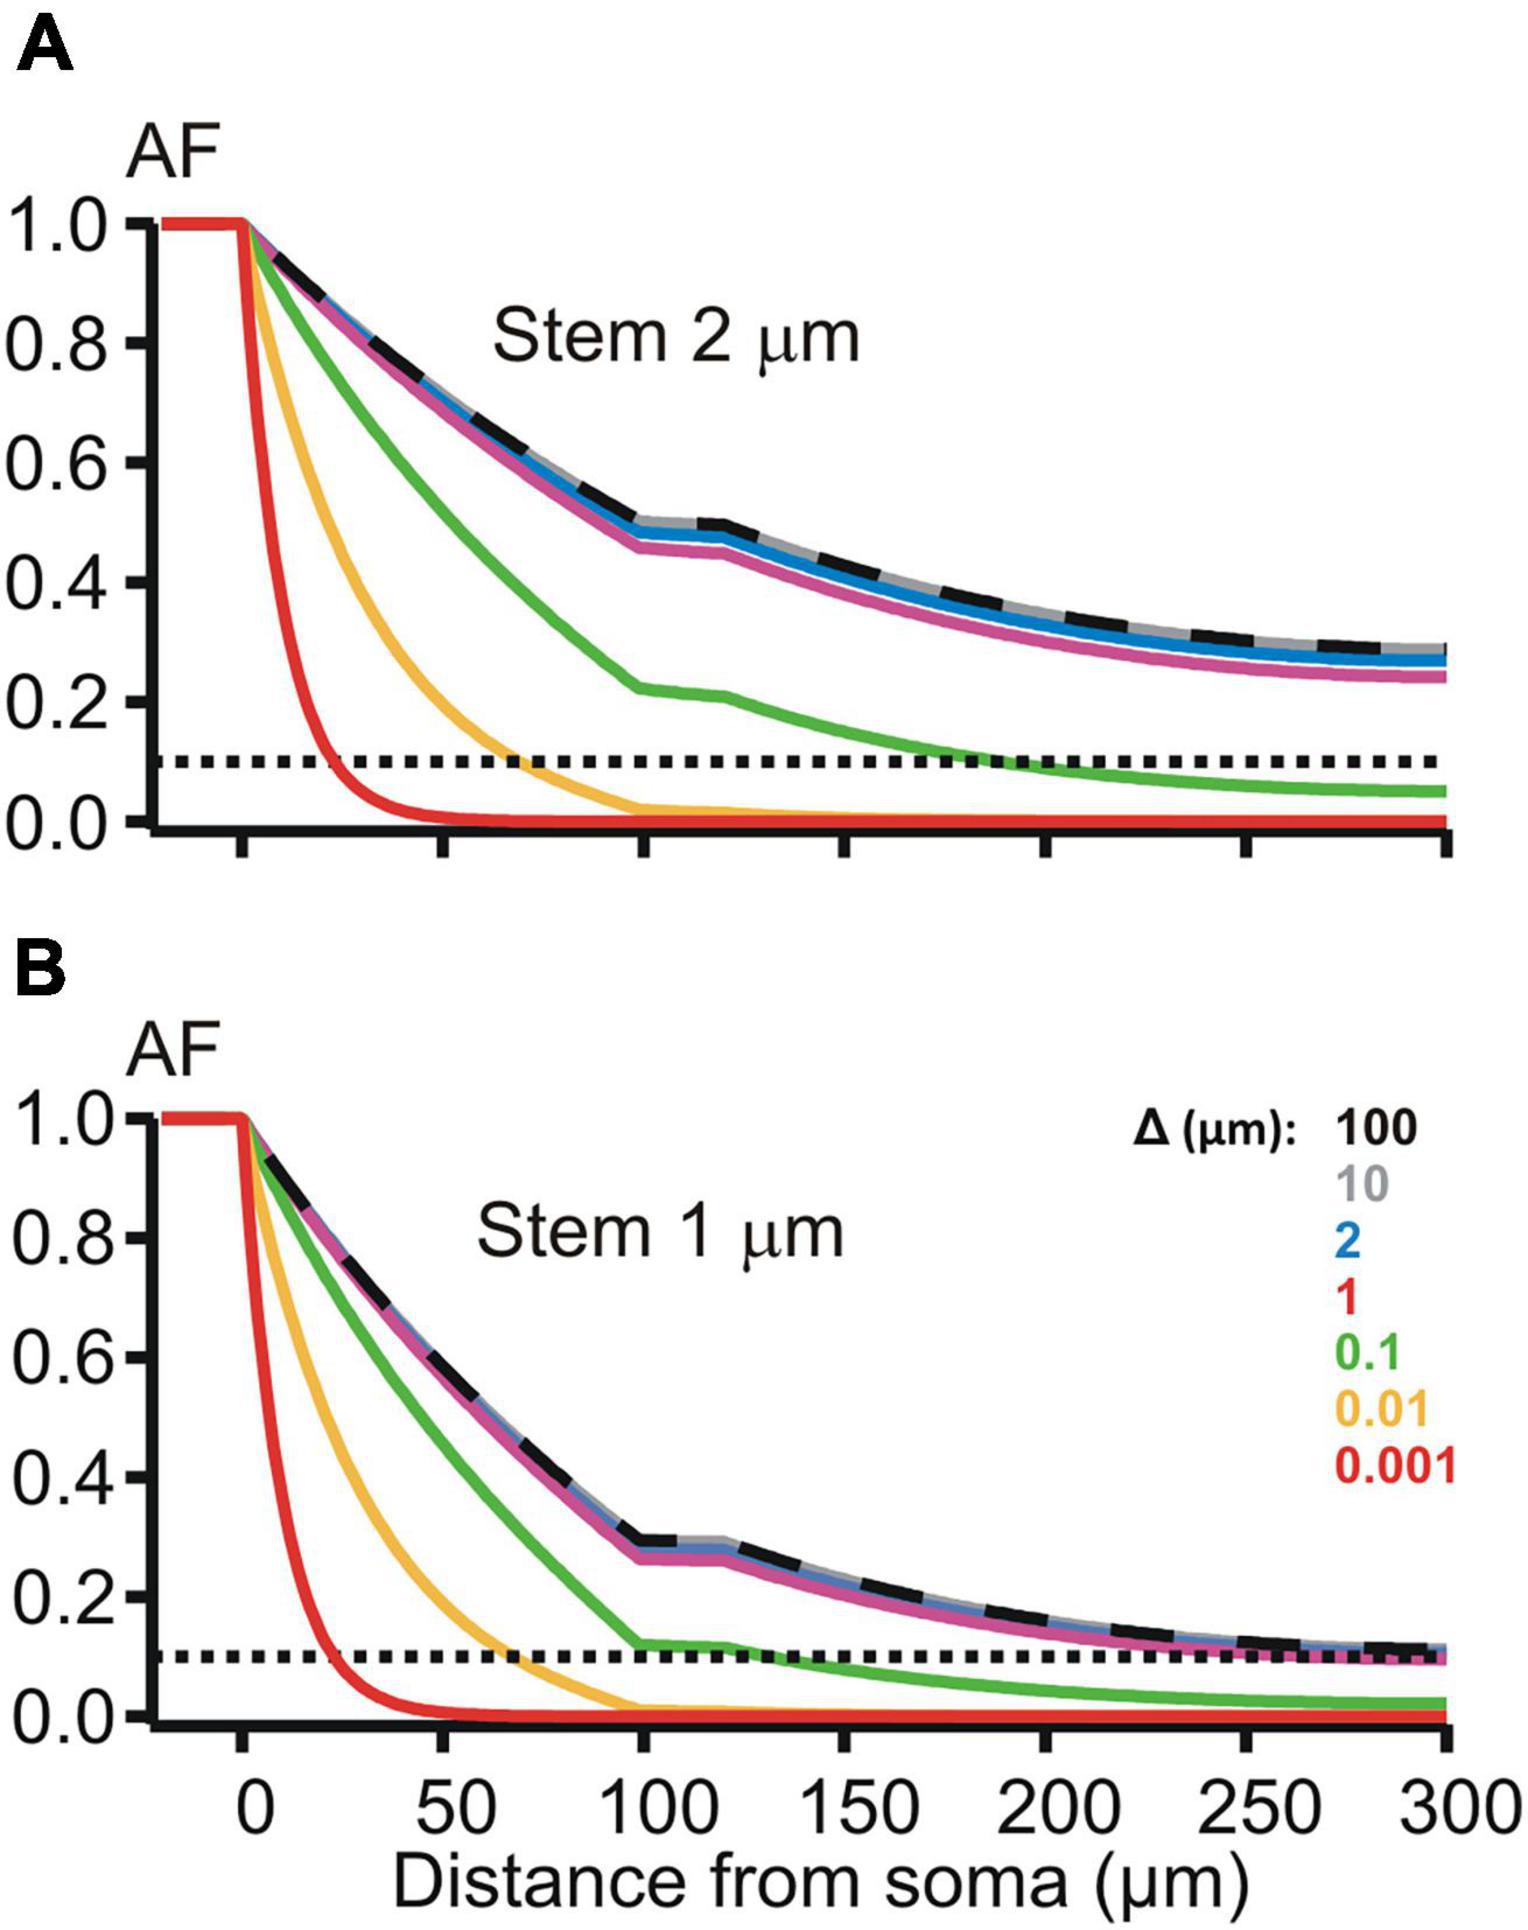
3.3. Effects of peri-dendritic microgeometryThe de-compacting effect of restricted peri-dendritic interstitial space between outer membrane of the dendrite and adjacent glial filaments (wrapping by glia) was explored on MNN models of the same geometry as that used in the previous experiments (Figure 2B), but with different expression for the length constant λk=rmk/(rik+rek), k = s, 1, 2, 3 is the compartment index (see above). λk now included the extracellular (peri-dendritic) resistance per unit cable length rek=Re/(π⋅(Δk⋅dk+Δk2)), which depended on the thickness Δk of cylindrical layer of the peri-dendritic fluid (specific resistivity Re) surrounding each k-th compartment. Here we assumed the same layer thickness for all compartments Δk = Δ. Path distance profiles of the attenuation factor AF(x) along such glia-wrapped 2 μm thick dendrite for Δ = 100 and 10 μm (Figure 5, top panel, dashed black and solid gray lines) practically did not differ from each other and from that in case of non-wrapped dendrite surrounded by infinitely large peri-dendritic space (cf. Figure 2B, red line). Noticeable increase in the somatofugal voltage attenuation began when Δ reduced below 1 μm as illustrated in Figure 5 by increasing sag of green, yellow, and red lines (Δ = 0.1, 0.01, and 0.001 μm, respectively). At given Δ-s, the attenuation effects were stronger when the stem diameter was thinned from 2 to 1 μm (cf. top and bottom panels in Figure 5). The difference in the attenuation between thick and thin dendrites became small or almost indiscernible when the thickness Δ reduced to 0.01 μm and below (cf. yellow and red lines on the top and bottom panels of Figure 5). These observations indicate different sensitivity of the attenuation factor to changes of the peri-dendritic space thickness in different ranges.
Figure 5. Attenuation factor AF(x) (ordinate, dimensionless) in function of the path distance coordinate x (abscissa, μm) for different width/thickness Δ (μm, color-coded) of the peri-dendritic layer of the interstitial conductive fluid between non-uniform dendrite and adjacent glia. (A,B) Plots for dendrites, which had the stem diameter of 2 and 1 μm, respectively, and contained a varicosity (length 20 μm, diameter 6 μm) starting at 100 μm from the soma.
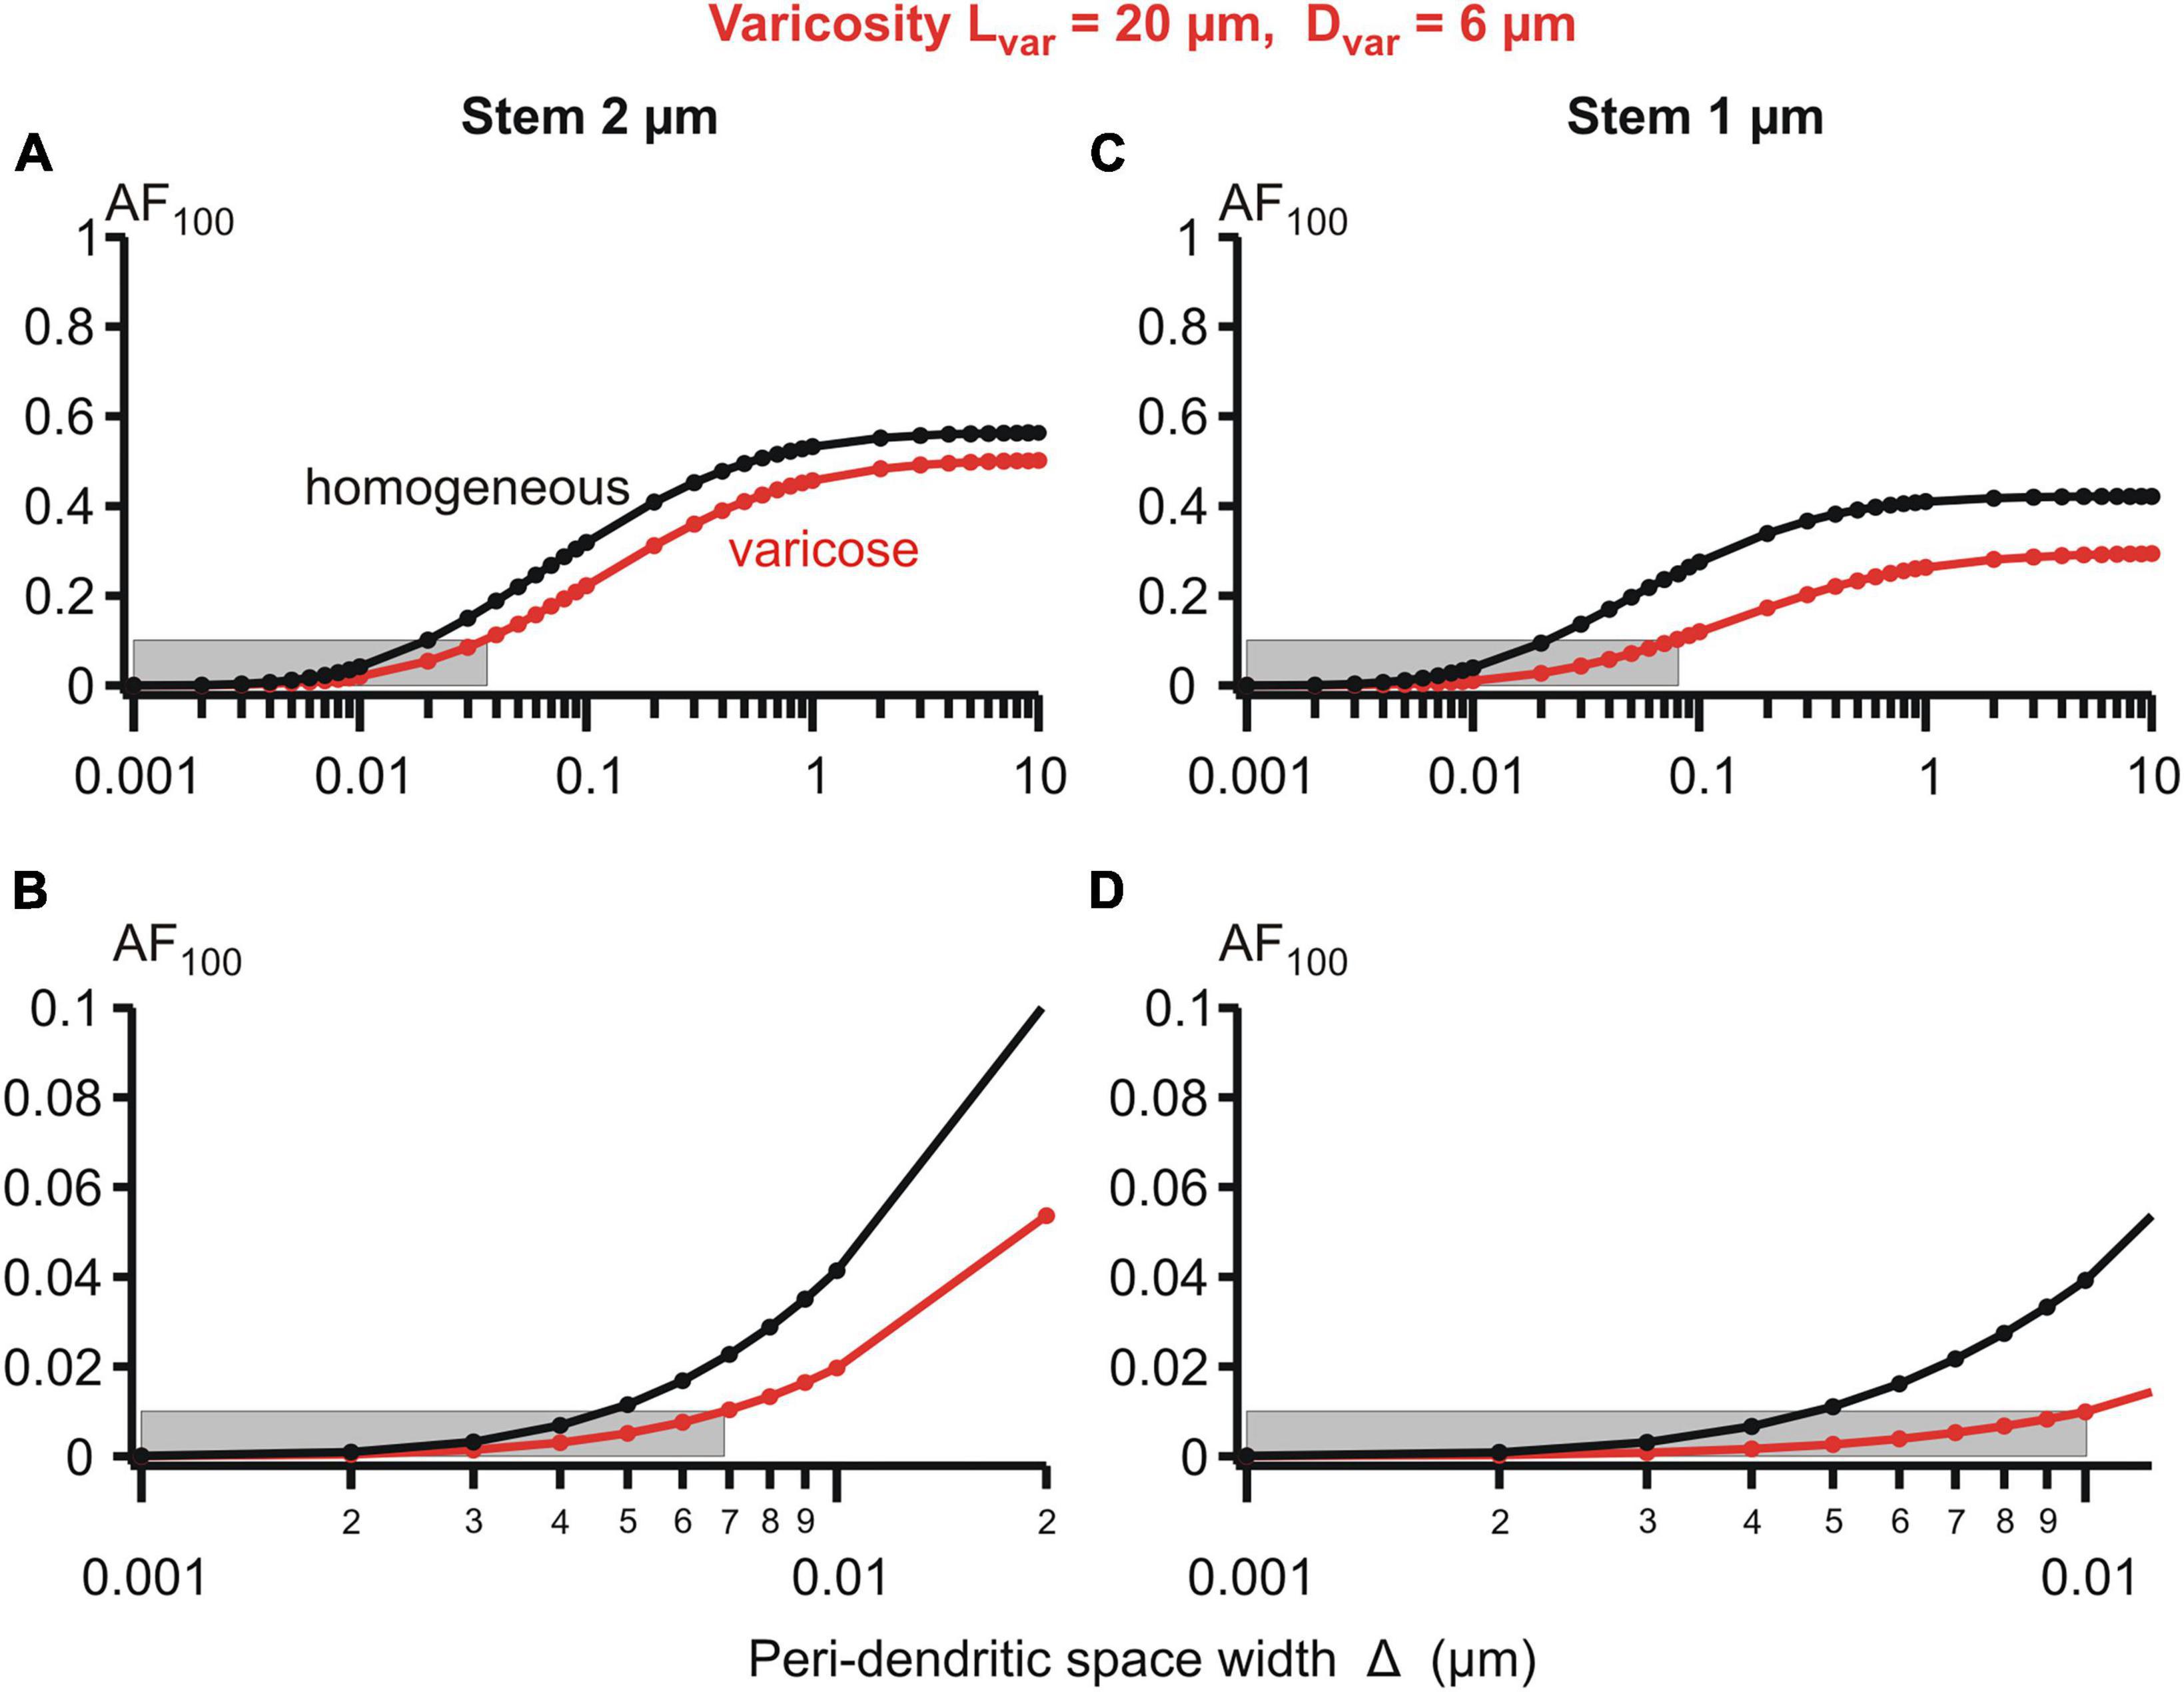
Details of the parametric sensitivity of the voltage attenuation to changes in the peri-dendritic space width are well-demonstrated by the semi-logarithmic plots of the attenuation factor AF100 vs. Δ for the given dimensions of the varicosity and dendritic stem diameters (Figure 6). The Δ-dependence of the AF100 is S-shaped: the attenuation is relatively low-sensitive to Δ changes in the upper (above ∼1 μm) and lower (below ∼0.01 μm) ranges, and is extremely sensitive in the intermediate range (approximately between 0.08 and 0.8 μm). As a consequence of such dependence, in the varicose dendrite AF100 drops below the first reference level of 0.1 if Δ is decreased below 0.04 μm at the stem diameter of 2 μm and below 0.08 μm at the stem diameter of 1 μm (Figure 6, upper panels). In the same dendrites, the respective values of Δ at which AF100 reaches the second reference level of 0.01 are 0.007 and 0.01 (same figure, lower panels).
Figure 6. Attenuation factor AF100 (ordinate, dimensionless) in function width/thickness Δ (logarithmic abscissa, μm) of the peri-dendritic layer of the interstitial conductive fluid between heterogeneous dendrite and adjacent glial cells. Bottom plots are fragments of top plots. Dendrite of stem diameter 2 (left) or 1 μm (right) without (black plots) or with (red plots) varicosity of a fixed size (length 20 μm, diameter 6 μm) located in 100 μm from the dendrite origin. Grey boxes indicate 0.1 (A,C) and 0.01 (B,D) levels of AF100.
3.4. Effects of the membrane conductivity (resistivity)For each k-th compartment the electrotonic length constant λk depends on both geometrical (diameter dk, width of interstitial layer Δk) and specific electrical (membrane resistivity per unit area Rm, resistivity of intra- and extracellular media Ri and Re) parameters. Variation of these parameters, individually and in combinations, allows disclosing how the biophysical mechanism of electro-geometrical coupling (Korogod and Tyc-Dumont, 2009) contributes to functional compartmentalization of structurally heterogeneous dendrites.
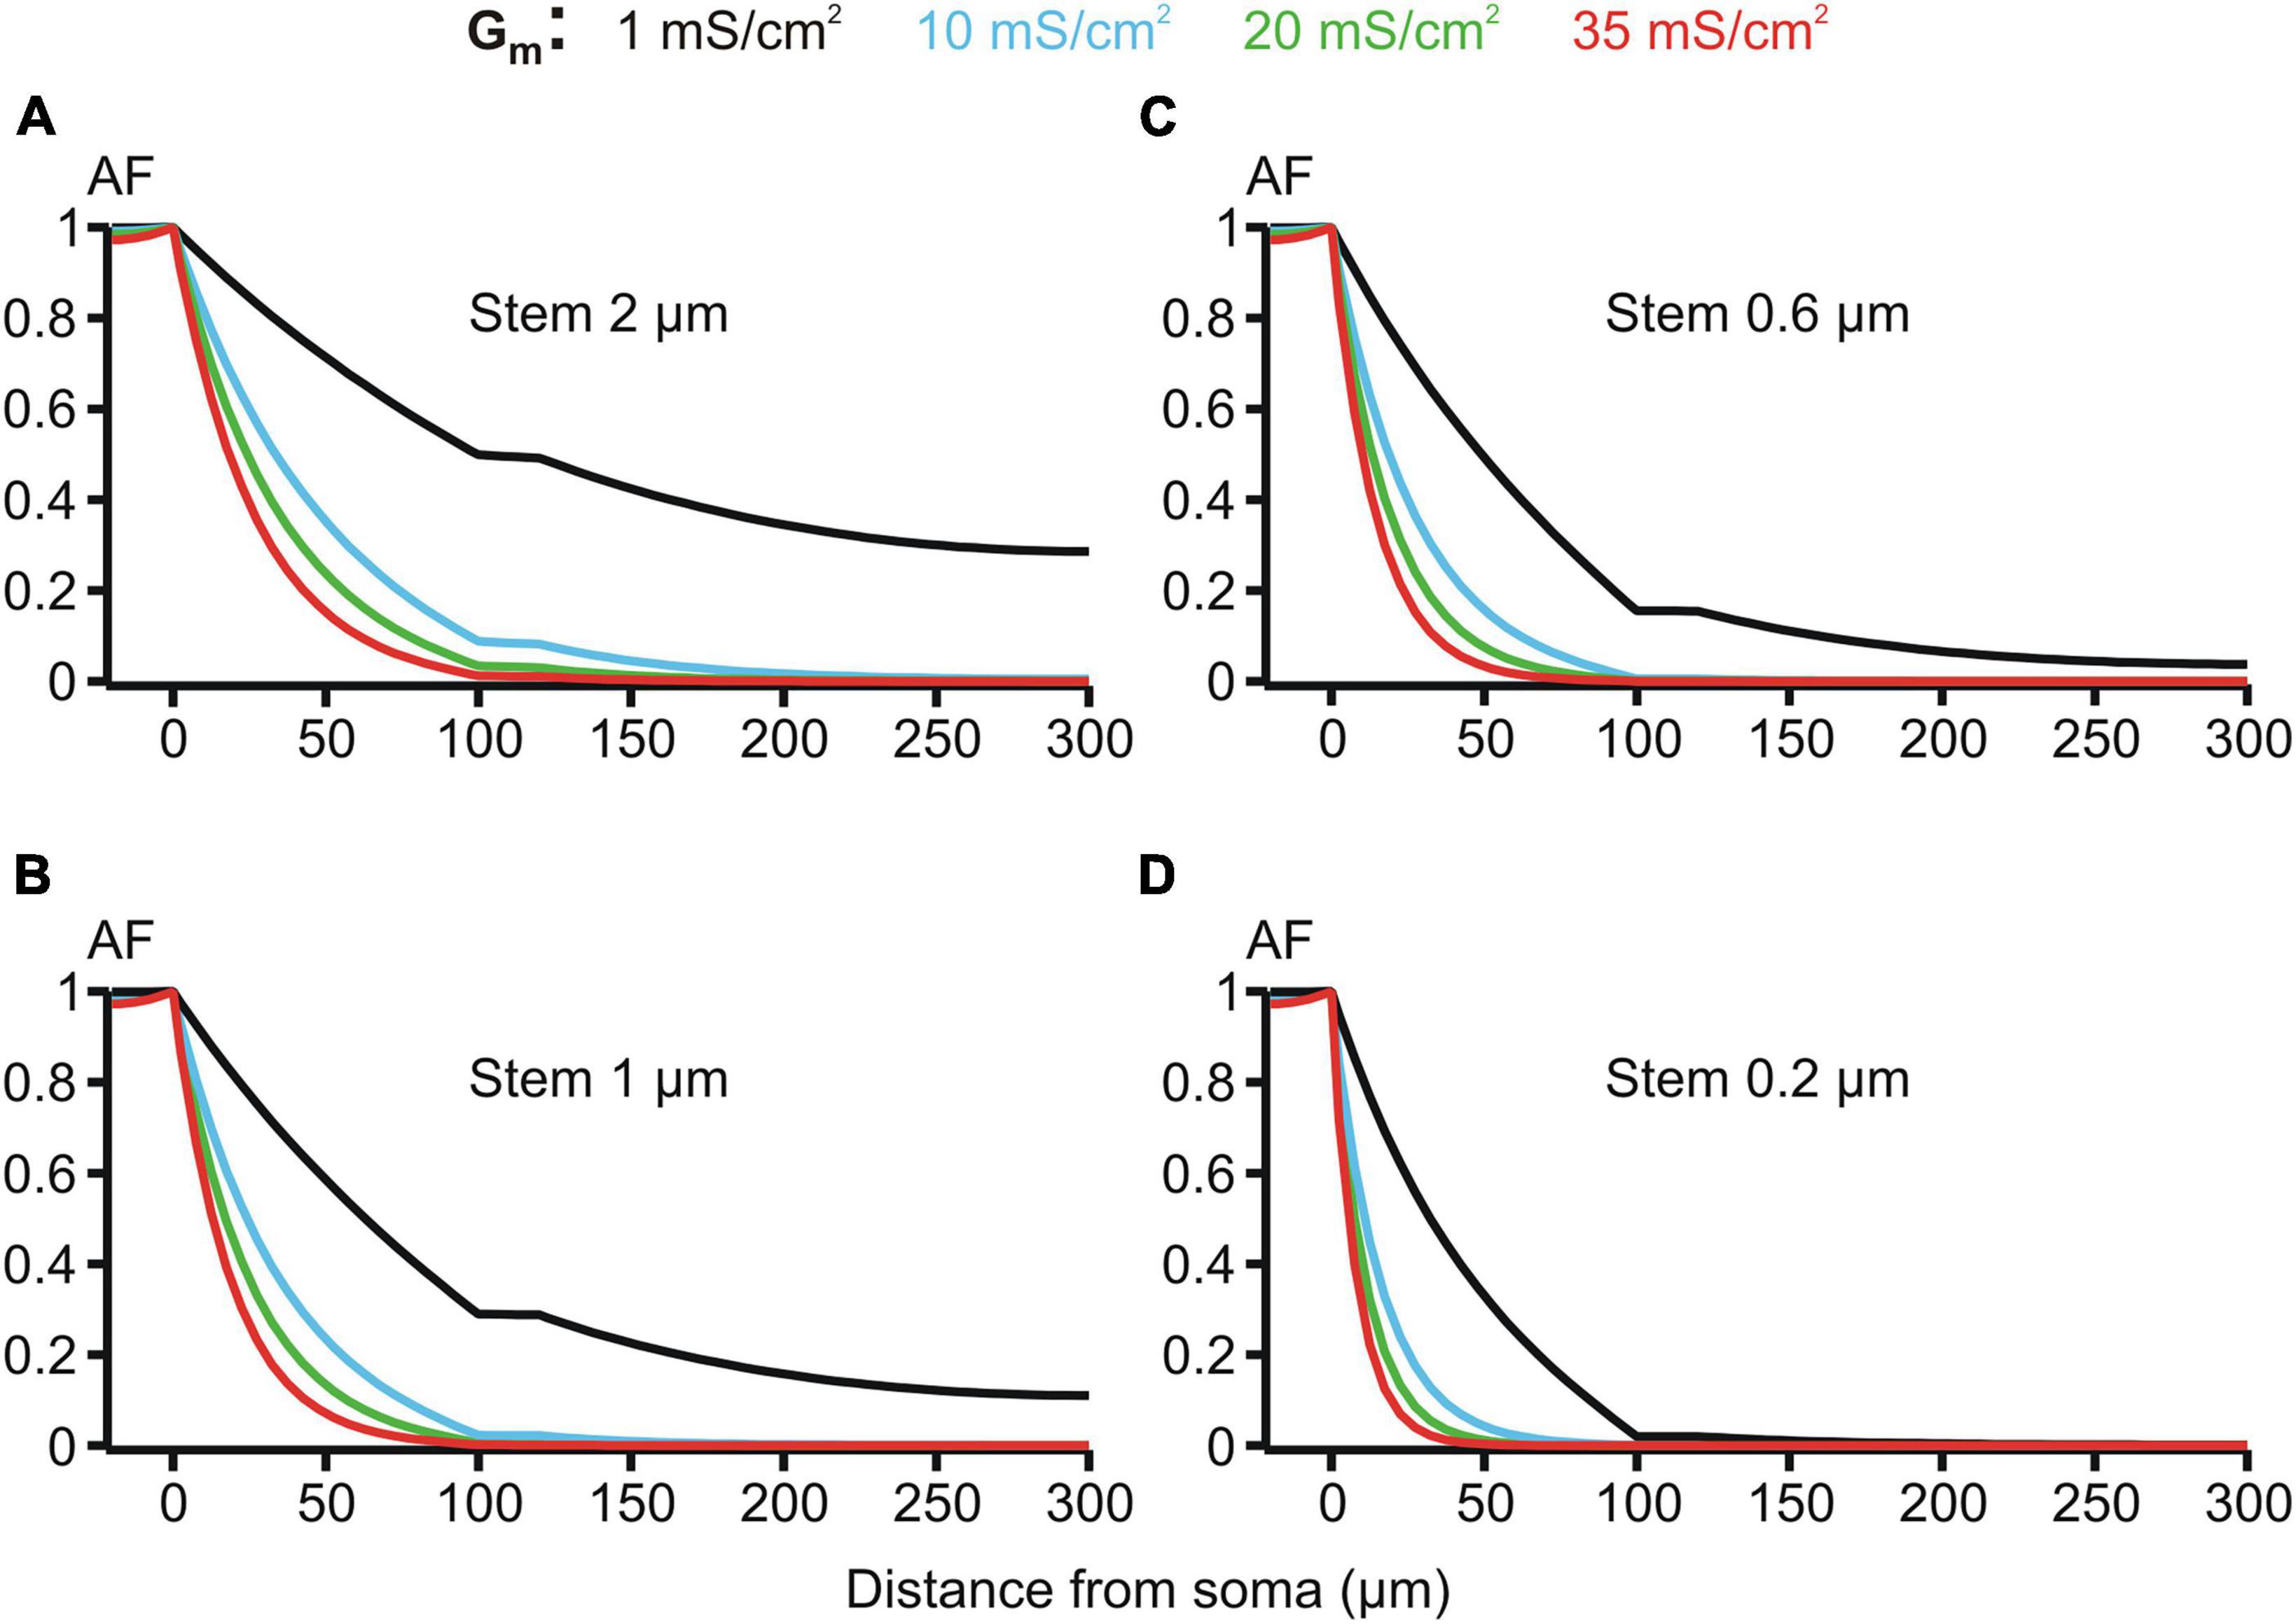
The membrane resistivity Rm (or its inverse, conductivity Gm = 1/Rm) is of special interest because, unlike Ri and Re, it may vary in a wide range depending on the activation of voltage- and ligand-gated ion conductances present in the MNN membrane. Such activity-dependent variation makes Rm a good candidate factor of dynamic modulation of microgeometry-induced de-compacting (decoupling) effects. One order increase in the uniform membrane conductivity Gm from its reference value of 1 mS/cm2 (Rm = 1 kOhm⋅cm2) to 10 mS/cm2 caused significant increase in the voltage attenuation along non-uniform dendrites of different stem diameters with the same fixed varicosity (20 × 6 μm) (cf. black and blue lines in Figure 7. With further increase in Gm to 20 and 35 mS/cm2 the voltage attenuated below the reference “decoupling” levels of 0.1 and 0.01 at progressively shorter path distances from soma (same figure, green and red lines, respectively) within the proximal dendritic compartment of interest. Data summarized in Table 2 shows that combinations of greater Gm and thinner stem diameters are favorable for dropping the attenuation factor AF100 at the end of the proximal dendritic compartment below the decoupling levels 0.1 and 0.01. Collectively, Figure 7, Table 2 demonstrate that increased Gm significantly augments the de-compacting effects of thinner stem diameters. This essentially expands the range of dendritic diameters for which the attenuation in the proximal dendrites reaches the levels critical for the decoupling.
Figure 7. Attenuation factor AF(x) (ordinate, dimensionless) in function of the path distance
留言 (0)