
記住我
Gliomas, which are brain neoplasms arising from glial cells, are the most common pediatric brain tumors, accounting for over 50% of all central nervous system tumors in childhood.1 According to the World Health Organization (WHO) criteria, gliomas are classified into 2 broad clinical categories based on histology and biological behavior: low-grade gliomas (LGGs; grades 1 and 2) and high-grade gliomas (HGGs; grades 3 and 4). High-grade gliomas are more infiltrative, are difficult to completely resect, and have a poorer prognosis than LGGs. Pretherapeutic accurate glioma grading is significantly important for selecting treatment strategies, and undergrading HGGs as LGGs can result in insufficient treatment.2–5
However, conventional magnetic resonance imaging (MRI) is always challenging for the accurate assessment of glioma grading. Diffusion-weighted imaging (DWI) is a noninvasive method used to show diffusion information based on the random Brownian motion of microscopic water molecules within the biological tissues. Apparent diffusion coefficient (ADC) is a parameter that quantifies the cellular-level water diffusion.6 According to the previous literature, ADC can increase the accuracy grading of tumors and reflect tumor proliferation potential.7–9 Immunohistologically, the Ki-67 proliferation index is a significant indicator affecting the treatment outcome and prognosis in glioma, which reflects tumor proliferation and malignancy. The higher level of expression of the Ki-67 proliferation index corresponds to greater malignancy.10 Our study aimed to explore the possible correlations between various DW-MRI parameters (ADCmean, ADCmin, and ADC ratio) and the Ki-67proliferation index with pediatric glioma grade and whether the expression of Ki-67 is correlated with the ADC values. Furthermore, in this study, the diagnostic accuracy was compared, which may contribute to the later therapeutic decision making.
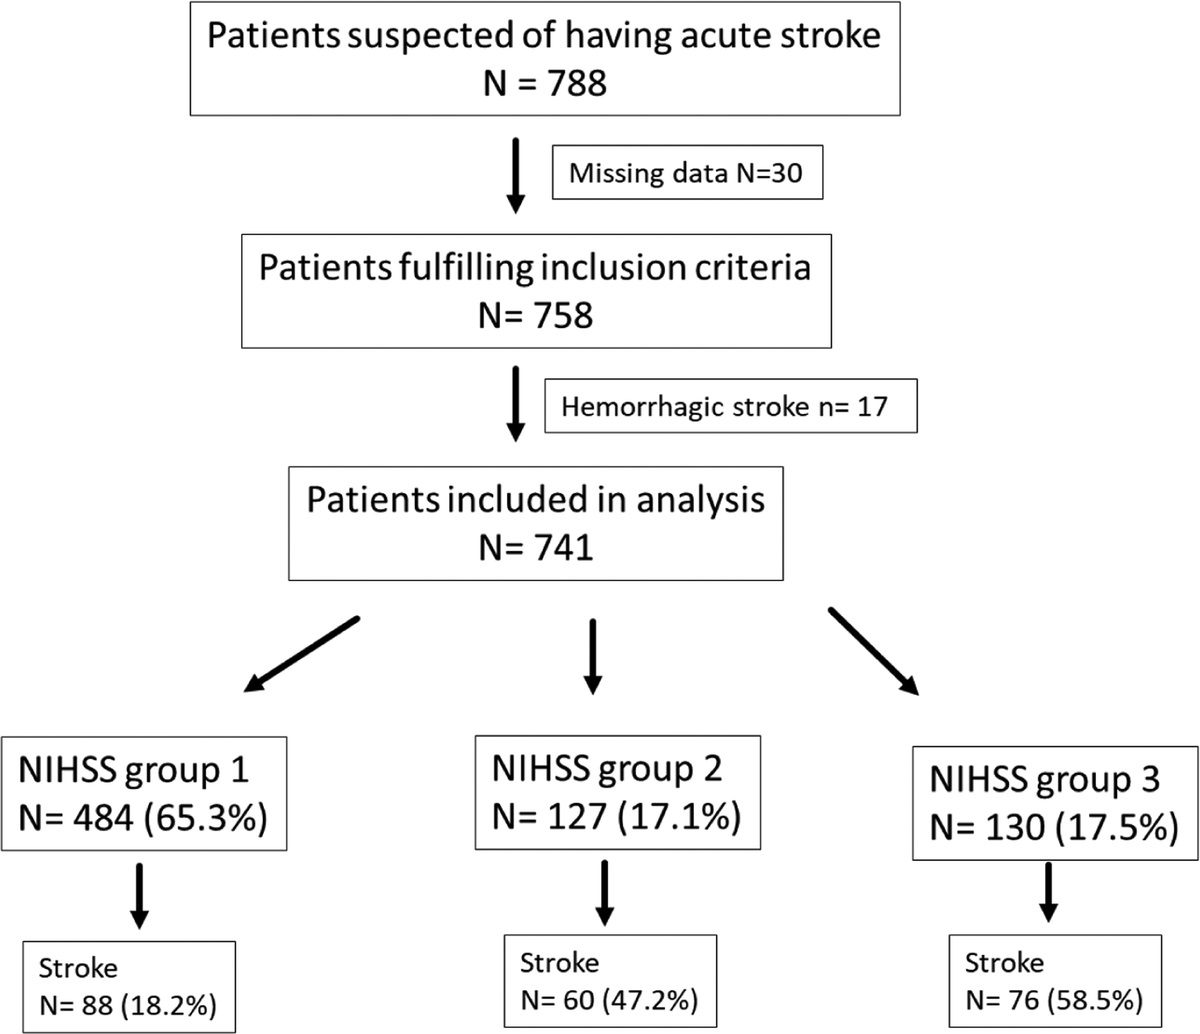
PATIENTS AND METHODS PatientsInitially, 358 pediatric patients with gliomas were enrolled between January 2012 and August 2017. The inclusion criteria were as follows: patients (1) with pathologically proven glioma, available WHO grades, and histopathological evaluation with Ki-67 proliferation index and (2) who underwent preoperative brain MRI, including conventional MRI and DWI. The exclusion criteria were as follows: patients (1) with other concurrent brain diseases (n = 2), (2) with oncologic treatment before performing MRI (n = 3), (3) with inadequate MRI caused by paramagnetic and motion artifacts (n = 29), and (4) with mixed histology grading (grades 2–3) (n = 17). A flowchart of the screening of the study population is shown (Fig. 1). Finally, our retrospective study group comprised 121 patients, with a mean age of 5.11 ± 3.20 (range, 5–13) years. Among these patients, 34 patients with HGGs and 87 patients with LGGs were enrolled in this study.
 FIGURE 1:
 Flowchart shows the screening process.
Image AnalysisAll examinations were performed on either a 1.5-T or 3-T MR scanner (GE Signa) with an 8-channel phased-array head coil. The imaging parameters were as follows: (1) axial T1-weighted imaging was acquired with a repetition time/echo time (TR/TE) of 2200/24 milliseconds; (2) axial T2-weighted imaging fluid-attenuated inversion recovery imaging was acquired with a TR/TE of 8000/150 milliseconds; (3) contrast-enhanced MRI was obtained in axial, coronal, and sagittal planes after the intravenous administration of a single dose of gadolinium contrast with gadopentetate dimeglumine; and (4) diffusion-weighted sequence was performed with a TR/TE of 5000/70 milliseconds before the injection of contrast material, and the b values were selected as 0 and 1000 s/mm2.
Several circular regions of interest (ROIs) were manually drawn on the nonoverlapping areas within the solid tumor region on DWI images (Figs. 2C, 3C) and ADC maps (Figs. 2D, 3D). Regions of interest were placed to avoid cystic, necrotic, and hemorrhagic areas. The area of each ROI ranged from 20 to 50 mm2. Two radiologists independently placing ROIs on 3 consecutive images were blinded to the tumor histology. The ADC values of the tumors and of the contralateral normal-appearing brain parenchyma were recorded, and tumor/normal brain ADC ratios were calculated.
 FIGURE 2: A 1-year-old girl with pilocytic astrocytoma (World Health Organization grade 1) in the right basal ganglia region (white arrow). A, Axial T1 fluid-attenuated inversion recovery image reveals a low signal intensity. B, Axial contrast-enhanced T1-weighted image displays prominent enhancement. C, Axial diffusion-weighted image shows a low signal intensity. D, The axial apparent diffusion coefficient (ADC) map delineates high ADC values. E and F, Color graph showing results of pathological staining. E, Hematoxylin-eosin staining presents a biphasic architectural pattern with dense and loose areas, consisting of multipolar cells with round to spindled nuclei and Rosenthal fibers (×400 magnification). F, The Ki-67 proliferation index is low, with approximately 5% of tumor cells staining positive (×400 magnification). Figure 2 can be viewed online in color at www.jcat.org.
 FIGURE 3: A 13-year-old male adolescent with glioblastoma (World Health Organization grade 4) in the left temporal and occipital region (white arrow). A, Axial T1 fluid-attenuated inversion recovery image reveals a slightly low signal intensity. B, Axial contrast-enhanced T1-weighted image shows a slight enhancement. C, Axial diffusion-weighted imaging image exhibits a high signal intensity. D, The axial apparent diffusion coefficient (ADC) map demonstrates low ADC values. E and F, Color graph showing results of pathological staining. E, Hematoxylin-eosin staining shows a highly cellular glial neoplasm with nuclear pleomorphic cells and focal microvascular proliferation (×400 magnification). F, The Ki-67 proliferation index is high, with approximately 55% of tumor cells staining positive (×400 magnification). Figure 3 can be viewed online in color at www.jcat.org.Pathologic Evaluation
The pathologic diagnoses and classifications for all cases were determined by the experienced pathologists, who were blinded to the histopathologic and clinical information, based on pathological slices containing hematoxylin-eosin staining and Ki-67 immunostaining and glioma grading and classification according to the WHO criteria. The Ki-67 proliferation index was defined as the percentage of Ki-67–positive tumor cells in formalin-fixed paraffin-embedded tissues.5,11,12
Statistical AnalysisStatistical analysis was performed using SPSS version 21.0 software (SPSS Institute, Chicago, Ill). The ADC values (ADCmean, ADCmin, and ADC ratio) and the Ki-67 values were expressed as mean ± standard deviation. Comparison of the ADC values and Ki-67 proliferation index values were made between the LGGs and HGGs using the independent-samples t test. Correlations between the ADC values and glioma grade and between the Ki-67 proliferation index and glioma grade were evaluated using the Spearman correlation test. Associations between ADC and the Ki-67 proliferation index were statistically analyzed using Spearman correlation coefficient. The correlation coefficient rho (r) was classified as follows: little or no relationship (0 ≤ r < 0.25), fair (0.25 ≤ r < 0.5), moderate to good (0.5 ≤ r < 0.75), and very good to excellent (0.75 ≤ r). The receiver operating characteristic (ROC) curve analysis was used to compare the diagnostic performance of ADC and the Ki-67 proliferation index. The optimum threshold was applied with the maximum Youden index (sensitivity + specificity − 1). The area under the curve (AUC), threshold value, sensitivity, specificity, accuracy, positive predictive value (PPV), and negative predictive value (NPV) were calculated. The AUC was classified as follows: low if 0.5 < AUC ≤ 0.7, moderate to good if 0.7 < AUC ≤ 0.9, and very good to excellent if 0.9 < AUC ≤ 1. If the AUC was 0.5, the diagnostic method was considered to be of no effect.13–15 For all statistical tests, a value of P less than 0.05 was considered statistically significant.
RESULTS Comparison Between the ADC Values and Ki-67 Labeling Index Between LGGs and HGGsIn this study, a significant difference was observed in the Ki-67 proliferation index between low- and high-grade pediatric gliomas (3.701 ± 3.751 vs 20.323 ± 13.153, P < 0.001). The ADC values of the contralateral normal-appearing brain parenchyma and tumor regions between LGGs and HGGs are summarized in Table 1. The mean ADC values of the contralateral normal-appearing brain parenchyma according to tumor grade did not reveal any statistically significant differences (P = 0.369). The lesions in LGGs had significantly higher ADCmean, ADCmin, and ADC ratio than those in HGGs (1.387 ± 0.206 × 10⁻³ mm2/s vs 1.096 ± 0.122 × 10⁻³ mm2/s, P < 0.001; 1.121 ± 0.130 × 10⁻³ mm2/s vs 0.884 ± 0.080 × 10⁻³ mm2/s, P < 0.001; and 1.614 ± 0.258 vs 1.280 ± 0.139, P < 0.001, respectively).
TABLE 1 - Comparison of the ADC Values and Ki-67 Proliferation Index Between Low-Grade and High-Grade Gliomas Low-Grade Group (n = 87) High-Grade Group (n = 34) P Value ADCmean (×10−3 mm2/s) 1.387 ± 0.206 1.096 ± 0.122 <0.001 ADCmin (×10−3 mm2/s) 1.121 ± 0.130 0.884 ± 0.080 <0.001 ADC ratio 1.614 ± 0.258 1.280 ± 0.139 <0.001 Ki-67 3.701 ± 3.751 20.323 ± 13.153 <0.001ADC indicates apparent diffusion coefficient; ADC ratio, tumor/normal brain ADC ratio; ADCmean, mean apparent diffusion coefficient; ADCmin, minimum apparent diffusion coefficient.
This study investigated whether the expression of Ki-67 in pediatric gliomas is associated with the level of malignancy in gliomas. There were moderate to good negative correlations between ADCmean and glioma grade (r = −0.583, P < 0.001), between ADCmin and glioma grade (r = −0.694, P < 0.001), and between ADC ratio and glioma grade (r = −0.551, P < 0.001). Moderate to good positive correlation with glioma grade for the Ki-67 proliferation index was demonstrated (r = 0.726, P < 0.001). Meanwhile, the ADCmean, ADCmin, and ADC ratio were moderately to negatively correlated with the Ki-67 proliferation index; the correlation coefficient value between ADCmean and the Ki-67 proliferation index was −0.705, the correlation coefficient value between ADCmin and the Ki-67 proliferation index was −0.713, and the correlation coefficient value between ADC ratio and the Ki-67 proliferation index was −0.682.
Analyses of the Diagnostic Performance of ADC and Ki-67 Labeling Index for Grading GliomaThe diagnostic abilities of the ADC values (Fig. 4) and the Ki-67 proliferation index (Fig. 5) in the preoperative evaluation of the grading of pediatric gliomas were calculated using ROC analysis. The sensitivity, specificity, accuracy, PPV, and NPV of a cutoff ADCmean of greater than 1.187 × 10⁻³ mm2/s for low-grade pediatric gliomas with an AUC of 0.875 were 79.3%, 82.4%, 80.2%, 92.0%, and 60.9%, respectively. The sensitivity, specificity, accuracy, PPV, and NPV of a cutoff ADCmin of greater than 0.970 × 10⁻³ mm2/s for low-grade pediatric gliomas with an AUC of 0.946 were 86.2%, 94.1%, 88.4%, 97.4%, and 72.7%, respectively. The sensitivity, specificity, accuracy, PPV, and NPV of a cutoff ADC ratio of greater than 1.426 for low-grade pediatric gliomas with an AUC of 0.854 were 72.4%, 88.2%, 76.9%, 94.0%, and 55.6%, respectively. The Ki-67 proliferation index generated a sensitivity of 94.1% and a specificity of 89.7% with an accuracy of 90.9%, a PPV of 97.5%, and a NPV of 78.0%, with a cutoff value of 7 and an AUC of 0.962 in discriminating between LGGs and HGGs. Analyses of the ROC curve of the ADC values and the Ki-67 proliferation index in distinguishing LGGs and HGGs are shown in Table 2.
 FIGURE 4: A, Receiver operating characteristic (ROC) curve of the mean apparent diffusion coefficient (ADCmean) values. B, ROC curve of the minimum apparent diffusion coefficient (ADCmin) values. C, ROC curve of the apparent diffusion coefficient ratios. Figure 4 can be viewed online in color at www.jcat.org.
 FIGURE 5: Receiver operating characteristic (ROC) curve of the Ki-67 proliferation index. Figure 5 can be viewed online in color at www.jcat.org.
TABLE 2 -
ROC Results of the ADC Values and Ki-67 Proliferation Index for Glioma Grading
Variables
Cutoff
Sensitivity, %
Specificity, %
Accuracy, %
PPV, %
NPV, %
AUC
ADCmean
1.187 ×10⁻³ mm2/s
79.3
82.4
80.2
92.0
60.9
0.875
ADCmin
0.970 ×10⁻³ mm2/s
86.2
94.1
88.4
97.4
72.7
0.946
ADC ratio
1.426
72.4
88.2
76.9
94.0
55.6
0.854
Ki-67
7
94.1
89.7
90.9
97.5
78.0
0.962
FIGURE 5: Receiver operating characteristic (ROC) curve of the Ki-67 proliferation index. Figure 5 can be viewed online in color at www.jcat.org.
TABLE 2 -
ROC Results of the ADC Values and Ki-67 Proliferation Index for Glioma Grading
Variables
Cutoff
Sensitivity, %
Specificity, %
Accuracy, %
PPV, %
NPV, %
AUC
ADCmean
1.187 ×10⁻³ mm2/s
79.3
82.4
80.2
92.0
60.9
0.875
ADCmin
0.970 ×10⁻³ mm2/s
86.2
94.1
88.4
97.4
72.7
0.946
ADC ratio
1.426
72.4
88.2
76.9
94.0
55.6
0.854
Ki-67
7
94.1
89.7
90.9
97.5
78.0
0.962
ADC indicates apparent diffusion coefficient; ADC ratio, tumor/normal brain ADC ratio; ADCmean, mean apparent diffusion coefficient; ADCmin, minimum apparent diffusion coefficient; AUC, area under the curve; NPV, negative predictive value; PPV, positive predictive value; ROC, receiver operating characteristic.
The preoperative grading of pediatric gliomas is important for the determination of an appropriate treatment approach, because HGGs have a poor prognosis and are usually treated with near or gross total tumor resection and additional radiotherapy and chemotherapy, whereas most LGGs with better prognosis are only treated with surgical treatment.16,17 However, the preoperative grading of gliomas on conventional MRI is always difficult (accuracy between 55% and 83%), with sensitivity, specificity, PPV, and NPV of 72.5%, 65.0%, 86.1%, and 44.1%, respectively, for differentiating LGGs and HGGs.18,19
Quantitative ADC values derived from MRI-DWI may potentially serve as an adjunct to histologic grading.20 Phuttharak et al,21 in their cohort of 38 patients with glioma, suggested that both visual scale and ADC values can differentiate LGGs and HGGs. A systematic review and meta-analysis of 15 studies by Zhang et al22 supported the proposal that quantitative ADC values have high accuracy in discriminating high-grade from low-grade intracranial gliomas. In this meta-analysis, the summarized sensitivity and specificity of ADC maps were 85% and 80%, respectively. In a study conducted by Arvinda et al,23 in their cohort of 51 patients with gliomas, they showed that the relative cerebral blood volume, ADC, and ADC ratios were helpful in predicting glioma grade. In this study, we found that DWI parameters, including ADCmean, ADCmin, and ADC ratio, have the potential to predict the pathologic grades of pediatric gliomas noninvasively. In our study, ADCmin considered to be associated with a higher cellularity showed a tendency for a stronger degree of correlation (r = −0.694) with glioma grade compared with ADCmean (r = −0.583) and ADC ratio (r = −0.551). In addition, the highest accuracy was observed for ADCmin with an AUC of 0.946 among DWI parameters in discriminating LGGs from HGGs. To explain the negative correlation, some studies have hypothesized that water diffusion is restricted in highly cellular tumors.24 In contrast, a study by Lam et al25 of 20 patients found that ADC values were not significantly different between LGGs and HGGs. The conflicting results may be attributable to the histopathologic heterogeneity of gliomas, the different measuring methods of ADC values, and the sampling bias.
Ki-67, a nonhistone protein, is a nuclear protein synthesized throughout all active phases of the cell cycle, except for the dormancy (G0) phase, and can be used to quantify the growth fraction of cell proliferation. Various studies have reported that a higher Ki-67 proliferation index is associated with greater malignancy and poorer prognosis for tumors.26–30 Sun et al31 revealed that the expression of A disintegrin and metalloproteinase 17, epidermal growth factor receptor, and Ki-67 was significantly positively correlated with the malignancy stage of gliomas. Ralte et al32 observed 64 patients with recurrent astrocytic tumors and concluded that there was a negative association between MIB-1 (Ki-67 labeling) index and interval to recurrence. Our results indicated that high Ki-67 expression level had significantly higher histological grade compared with low Ki-67 expression level, and there was a moderate to good positive association between the Ki-67 proliferation index and glioma grade (r = 0.726). Furthermore, higher accuracy was observed for KI-67 with an AUC of 0.962 compared with DWI parameters in discriminating LGGs from HGGs. Therefore, the Ki-67 proliferation index could be a predictive biomarker for glioma grading.
Previous studies have focused on the association between DWI parameters and the proliferation potential in gliomas. Although some authors indicated that ADC is correlated with Ki-67, others did not confirm this finding. Ren et al15 concluded significant correlations between histologic grade and Ki-67 labeling index for ADC, slow diffusion coefficient, distributed diffusion coefficient, and heterogeneity index α. Fudaba et al18 evaluated the roles of pulsed arterial spin labeling, diffusion tensor imaging, and MR spectroscopy for grading gliomas in 32 patients (age range, 16–82 years). They demonstrated that the Ki-67 index is correlated with MR imaging parameters, such as the mean, maximum, and minimum ADC, Cho/Cr, and lactate/Cr ratios. Consistent with the findings of previous studies, we demonstrated a significant association between various DWI parameters and the Ki-67 proliferation index in patients with gliomas. In this study, the ADC values were moderately to strongly negatively correlated with the Ki-67 proliferation index, and the correlation coefficients ranged from −0.682 to −0.713. This may be attributed to the fact that a high cell proliferation area representing densely packed tissue with high cellularity and small extracellular space is associated with restricted diffusion, resulting in a lower ADC value.33 In summary, DWI, a noninvasive imaging modality, can be performed quickly and used to reliably assess the proliferative potential of pediatric gliomas without a surgical procedure.
Our study has some limitations. First, because of its retrospective design, selection bias could not be avoided in our study. Second, our intracranial DW-MRI is based on only 2 b values (0 and 1000 s/mm2) and does not include non-Gaussian diffusion MRI (such as diffusion tensor imaging and diffusion kurtosis imaging), which may provide additional information for characterizing the biological behavior of glioma. Third, the data may have some differences when derived from different machines (1.5-T or 3-T MR scanner). Previous reports have shown that ADC values are a field-strength–independent parameter.34,35 Furthermore, ADC ratios were used to minimize the differences in signal-to-noise ratio caused by different levels of magnetic fields.36,37 Finally, considering the heterogeneity in gliomas, the manually placed ROIs on the ADC maps did not exactly point-to-point correspond to the representative tissues for the pathomorphological and immunohistochemical assessments. Therefore, a prospective study that includes location-based approaches for radiopathological correlations should be further conducted.
CONCLUSIONSWe found a statistically significant inverse correlation between ADC and histopathologic grade of pediatric gliomas, and a positive correlation was observed between the Ki-67 proliferation index and glioma grade. In addition, our study also shows a statistically significant inverse correlation between the ADC and Ki-67 proliferation index values in pediatric gliomas. Taken together, the results indicate that ADC values may be a reliable predictor of the grades of pediatric gliomas and reflect the proliferative activity of gliomas in vivo.
REFERENCES 1. Ryall S, Tabori U, Hawkins C. A comprehensive review of paediatric low-grade diffuse glioma: pathology, molecular genetics and treatment. Brain Tumor Pathol. 2017;34:51–61. 2. Sturm D, Pfister SM, Jones DTW. Pediatric gliomas: current concepts on diagnosis, biology, and clinical management. J Clin Oncol. 2017;35:2370–2377. 3. Tian H, Gou Y, Pan Y, et al. Quality appraisal of clinical practice guidelines on glioma. Neurosurg Rev. 2015;38:39–47. 4. Stokland T, Liu JF, Ironside JW, et al. A multivariate analysis of factors determining tumor progression in childhood low-grade glioma: a population-based cohort study (CCLG CNS9702). Neuro Oncol. 2010;12:1257–1268. 5. Louis DN, Perry A, Wesseling P, et al. The 2021 WHO classification of tumors of the central nervous system: a summary. Neuro Oncol. 2021;23:1231–1251. 6. Jaremko JL, Jans LB, Coleman LT, et al. Value and limitations of diffusion-weighted imaging in grading and diagnosis of pediatric posterior fossa tumors. AJNR Am J Neuroradiol. 2010;31:1613–1616. 7. Calvar JA, Meli FJ, Romero C, et al. Characterization of brain tumors by MRS, DWI and Ki-67 labeling index. J Neurooncol. 2005;72:273–280. 8. Baskan O, Silav G, Bolukbasi FH, et al. Relation of apparent diffusion coefficient with Ki-67 proliferation index in meningiomas. Br J Radiol. 2016;89:20140842. 9. Khayal IS, Vandenberg SR, Smith KJ, et al. MRI apparent diffusion coefficient reflects histopathologic subtype, axonal disruption, and tumor fraction in diffuse-type grade II gliomas. Neuro Oncol. 2011;13:1192–1201. 10. Su C, Liu C, Zhao L, et al. Amide proton transfer imaging allows detection of glioma grades and tumor proliferation: comparison with Ki-67 expression and proton MR spectroscopy imaging. AJNR Am J Neuroradiol. 2017;38:1702–1709. 11. Yang Y, Wang X, Liu Y, et al. Ki-67 overexpression in WHO grade II gliomas is associated with poor postoperative seizure control. Seizure. 2013;22:877–881. 12. Li Y, Qian Z, Xu K, et al. Radiomic features predict Ki-67 expression level and survival in lower grade gliomas. J Neurooncol. 2017;135:317–324. 13. Woo S, Lee JM, Yoon JH, et al. Intravoxel incoherent motion diffusion-weighted MR imaging of hepatocellular carcinoma: correlation with enhancement degree and histologic grade. Radiology. 2014;270:758–767. 14. Heo SH, Jeong YY, Shin SS, et al. Apparent diffusion coefficient value of diffusion weighted imaging for hepatocellular carcinoma: correlation with the histologic differentiation and the expression of vascular endothelial growth factor. Korean J Radiol. 2010;11:295–303. 15. Ren Y, Pang H, Feng X, et al. Non-Gaussian diffusion MR imaging of glioma: comparisons of multiple diffusion parameters and correlation with histologic grade and MIB-1 (Ki-67 labeling) index. Neuroradiology. 2016;58:121–132. 16. Fangusaro J. Pediatric high grade glioma: a review and update on tumor clinical characteristics and biology. Front Oncol. 2012;2:105. 17. Jones C, Perryman L, Hargrave D. Paediatric and adult malignant glioma: close relatives or distant cousins?Nat Rev Clin Oncol. 2012;9:400–413. 18. Fudaba H, Shimomura T, Abe T, et al. Comparison of multiple parameters obtained on 3 T pulsed arterial spin-labeling, diffusion tensor imaging, and MRS and the Ki-67 labeling index in evaluating glioma grading. AJNR Am J Neuroradiol. 2014;35:2091–2098. 19. Essig M, Anzalone N, Combs SE, et al. MR imaging of neoplastic central nervous system lesions: review and recommendations for current practice. AJNR Am J Neuroradiol. 2012;33:803–817. 20. Server A, Kulle B, Gadmar ØB, et al. Measurements of diagnostic examination performance using quantitative apparent diffusion coefficient and proton MR spectroscopic imaging in the preoperative evaluation of tumor grade in cerebral gliomas. Eur J Radiol. 2011;80:462–470. 21. Phuttharak W, Thammaroj J, Wara-Asawapati S, et al. Grading gliomas capability: comparison between visual assessment and apparent diffusion coefficient (ADC) value measurement on diffusion-weighted imaging (DWI). Asian Pac J Cancer Prev. 2020;21:385–390. 22. Zhang L, Min Z, Tang M, et al. The utility of diffusion MRI with quantitative ADC measurements for differentiating high-grade from low-grade cerebral gliomas: evidence from a meta-analysis. J Neurol Sci. 2017;373:9–15. 23. Arvinda HR, Kesavadas C, Sarma PS, et al. Glioma grading: sensitivity, specificity, positive and negative predictive values of diffusion and perfusion imaging. J Neurooncol. 2009;94:87–96. 24. Maier SE, Sun Y, Mulkern RV. Diffusion imaging of brain tumors. NMR Biomed. 2010;23:849–864. 25. Lam WW, Poon WS, Metreweli C. Diffusion MR imaging in glioma: does it have any role in the pre-operation determination of grading of glioma?Clin Radiol. 2002;57:219–225. 26. Schlüter C, Duchrow M, Wohlenberg C, et al. The cell proliferation-associated antigen of antibody Ki-67: a very large, ubiquitous nuclear protein with numerous repeated elements, representing a new kind of cell cycle-maintaining proteins. J Cell Biol. 1993;123:513–522. 27. Bowers DC, Gargan L, Kapur P, et al. Study of the MIB-1 labeling index as a predictor of tumor progression in pilocyticastrocytomas in children and adolescents. J Clin Oncol. 2003;21:2968–2973. 28. Johannessen AL, Torp SH. The clinical value of Ki-67/MIB-1 labeling index in human astrocytomas. Pathol Oncol Res. 2006;12:143–147. 29. Wang Y, Bai G, Zhang X, et al. Correlation analysis of apparent diffusion coefficient value and P53 and Ki-67 expression in esophageal squamous cell carcinoma. Magn Reson Imaging. 2020;68:183–189. 30. Surov A, Hamerla G, Meyer HJ, et al. Whole lesion histogram analysis of meningiomas derived from ADC values. Correlation with several cellularity parameters, proliferation index KI 67, nucleic content, and membrane permeability. Magn Reson Imaging. 2018;51:158–162. 31. Sun J, Li DM, Huang J, et al. The correlation between the expression of ADAM17, EGFR and Ki-67 in malignant gliomas. Eur Rev Med Pharmacol Sci. 2017;21:4595–4599. 32. Ralte AM, Sharma MC, Karak AK, et al. Clinicopathological features, MIB-1 labeling index and apoptotic index in recurrent astrocytic tumors. Pathol Oncol Res. 2001;7:267–278. 33. Choi HS, Kim AH, Ahn SS, et al. Glioma grading capability: comparisons among parameters from dynamic contrast-enhanced MRI and ADC value on DWI. Korean J Radiol. 2013;14:487–492. 34. Chawla S, Kim S, Wang S, et al. Diffusion-weighted imaging in head and neck cancers. Future Oncol. 2009;5:959–975. 35. Kim S, Loevner L, Quon H, et al. Diffusion-weighted magnetic resonance imaging for predicting and detecting early response to chemoradiation therapy of squamous cell carcinomas of the head and neck. Clin Cancer Res. 2009;15:986–994. 36. Nagar VA, Ye JR, Ng WH, et al. Diffusionweighted MR imaging: diagnosing atypical or malignant meningiomas and detecting tumor dedifferentiation. AJNR Am J Neuroradiol. 2008;29:1147–1152. 37. Lee J, Choi SH, Kim J, et al. Glioma grading using apparent diffusion coefficient map: application of histogram analysis based on automatic segmentation. NMR Biomed. 2014;27:1046–1052.
留言 (0)