
記住我


While classically considered a motor structure, there is a growing appreciation for the larger roles the cerebellum can play. One relatively understudied area that nicely highlights the potential cognitive roles of the cerebellum is what our lab has termed the ‘hippobellum’ – namely, a bidirectional functional connectivity between the cerebellum and the hippocampus. In contrast to the cerebellum, the hippocampus is chiefly considered a cognitive structure, well known for its roles in learning, memory, and spatial processing. A relatively small, but growing, body of literature supports bidirectional functional connectivity between the hippocampus and the cerebellum, in both healthy brains and in pathological conditions, such as epilepsy. Research is beginning to elucidate potential underlying anatomical pathways, although more studies are needed. In this review, we highlight some of the key hippobellum literature and discuss potential insights and clinical avenues their connection provides.
The complicated path to a hippobellum circuit (anatomical underpinnings)Seminal tracing studies in primates examining cerebellar connections to the primary motor cortex uncovered a now canonical loop: (1) cerebellar nuclear neurons (DCN) project to motor thalamus, (2) motor thalamus projects to motor cortex, (3) motor cortex projects to pontine nuclei, (4) pontine nuclei project to cerebellar cortex via mossy fibers (with collaterals to the DCN), and (5) cerebellar cortex projects to DCN (Allen and Tsukahara, 1974; Orioli and Strick, 1989). Further studies of cerebellar outputs showed similar connectivity loops with a variety of neocortical areas, supporting both motor and non-motor functions (Middleton and Strick, 1998; Kelly and Strick, 2003; Bostan et al., 2013; Caligiore et al., 2017). Notably, none of these represent direct projections from the cerebellum to the neocortex and back; they are all multi-synaptic (Kelly and Strick, 2003). While perhaps obvious, it is important to state that a connection between two structures does not need to be direct to be a powerful mediator of brain function.
In contrast to these now canonical loops, the anatomical underpinnings of cerebellar-hippocampal communication is not yet firmly established. Similar to cerebellar-neocortical connections, which occur via one or more intermediary regions, there is almost certainly one or more intermediary structures between the cerebellum and the hippocampus (Yu and Krook-Magnuson, 2015; Watson et al., 2019; Fujita et al., 2020). In this regard, cerebellar influences on the hippocampus is not unique. However, the intermediary structures at play appear to be different for the allocortex versus neocortex, as discussed more below. As an important side note – in the past, a direct connection between the structures was argued based on lesion studies and the timing of electrical responses (Heath and Harper, 1974; Snider and Maiti, 1976; Heath et al., 1978; Newman and Reza, 1979). However, improved techniques have refuted this idea (Badura et al., 2018; Krook-Magnuson, 2019; Watson et al., 2019; Fujita et al., 2020), at least in rodents (Liu et al., 2012; Arrigo et al., 2014), and suggest instead a multi-synaptic pathway.
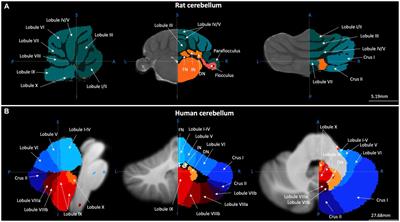
Multi-synaptic connectivity provides for a wealth of potential hippobellum pathways. This provides both a richness – allowing function and substructure specific connectivity – and extra experimental challenges. Sophisticated circuit tracing methods are required to fill in the intermediate structures involved, and in turn the function(s) carried by each. Fortunately, tracing techniques are being continuously developed and refined and are increasingly used to probe functional connectivity. While new tools provide new opportunities to examine cerebellar-hippocampal and hippocampal-cerebellar connectivity, the question of pathways remains excruciatingly difficult and complex. This is in part due to the large number of brain regions the cerebellum does directly project to. Fujita and colleagues, for example, found that the FN alone has over 60 (direct) extra-cerebellar targets (Figures 1A, B; Fujita et al., 2020). We will not attempt a full review of inputs and outputs of the cerebellum and the hippocampus. For extensive recent reviews of cerebellar outputs, see (Kang et al., 2021; Novello et al., 2022); for reviews of hippocampal inputs and outputs see (Atoji and Wild, 2006; van Strien et al., 2009). Instead, we will highlight some recent research that is particularly relevant with regards to potential hippobellum connectivity.
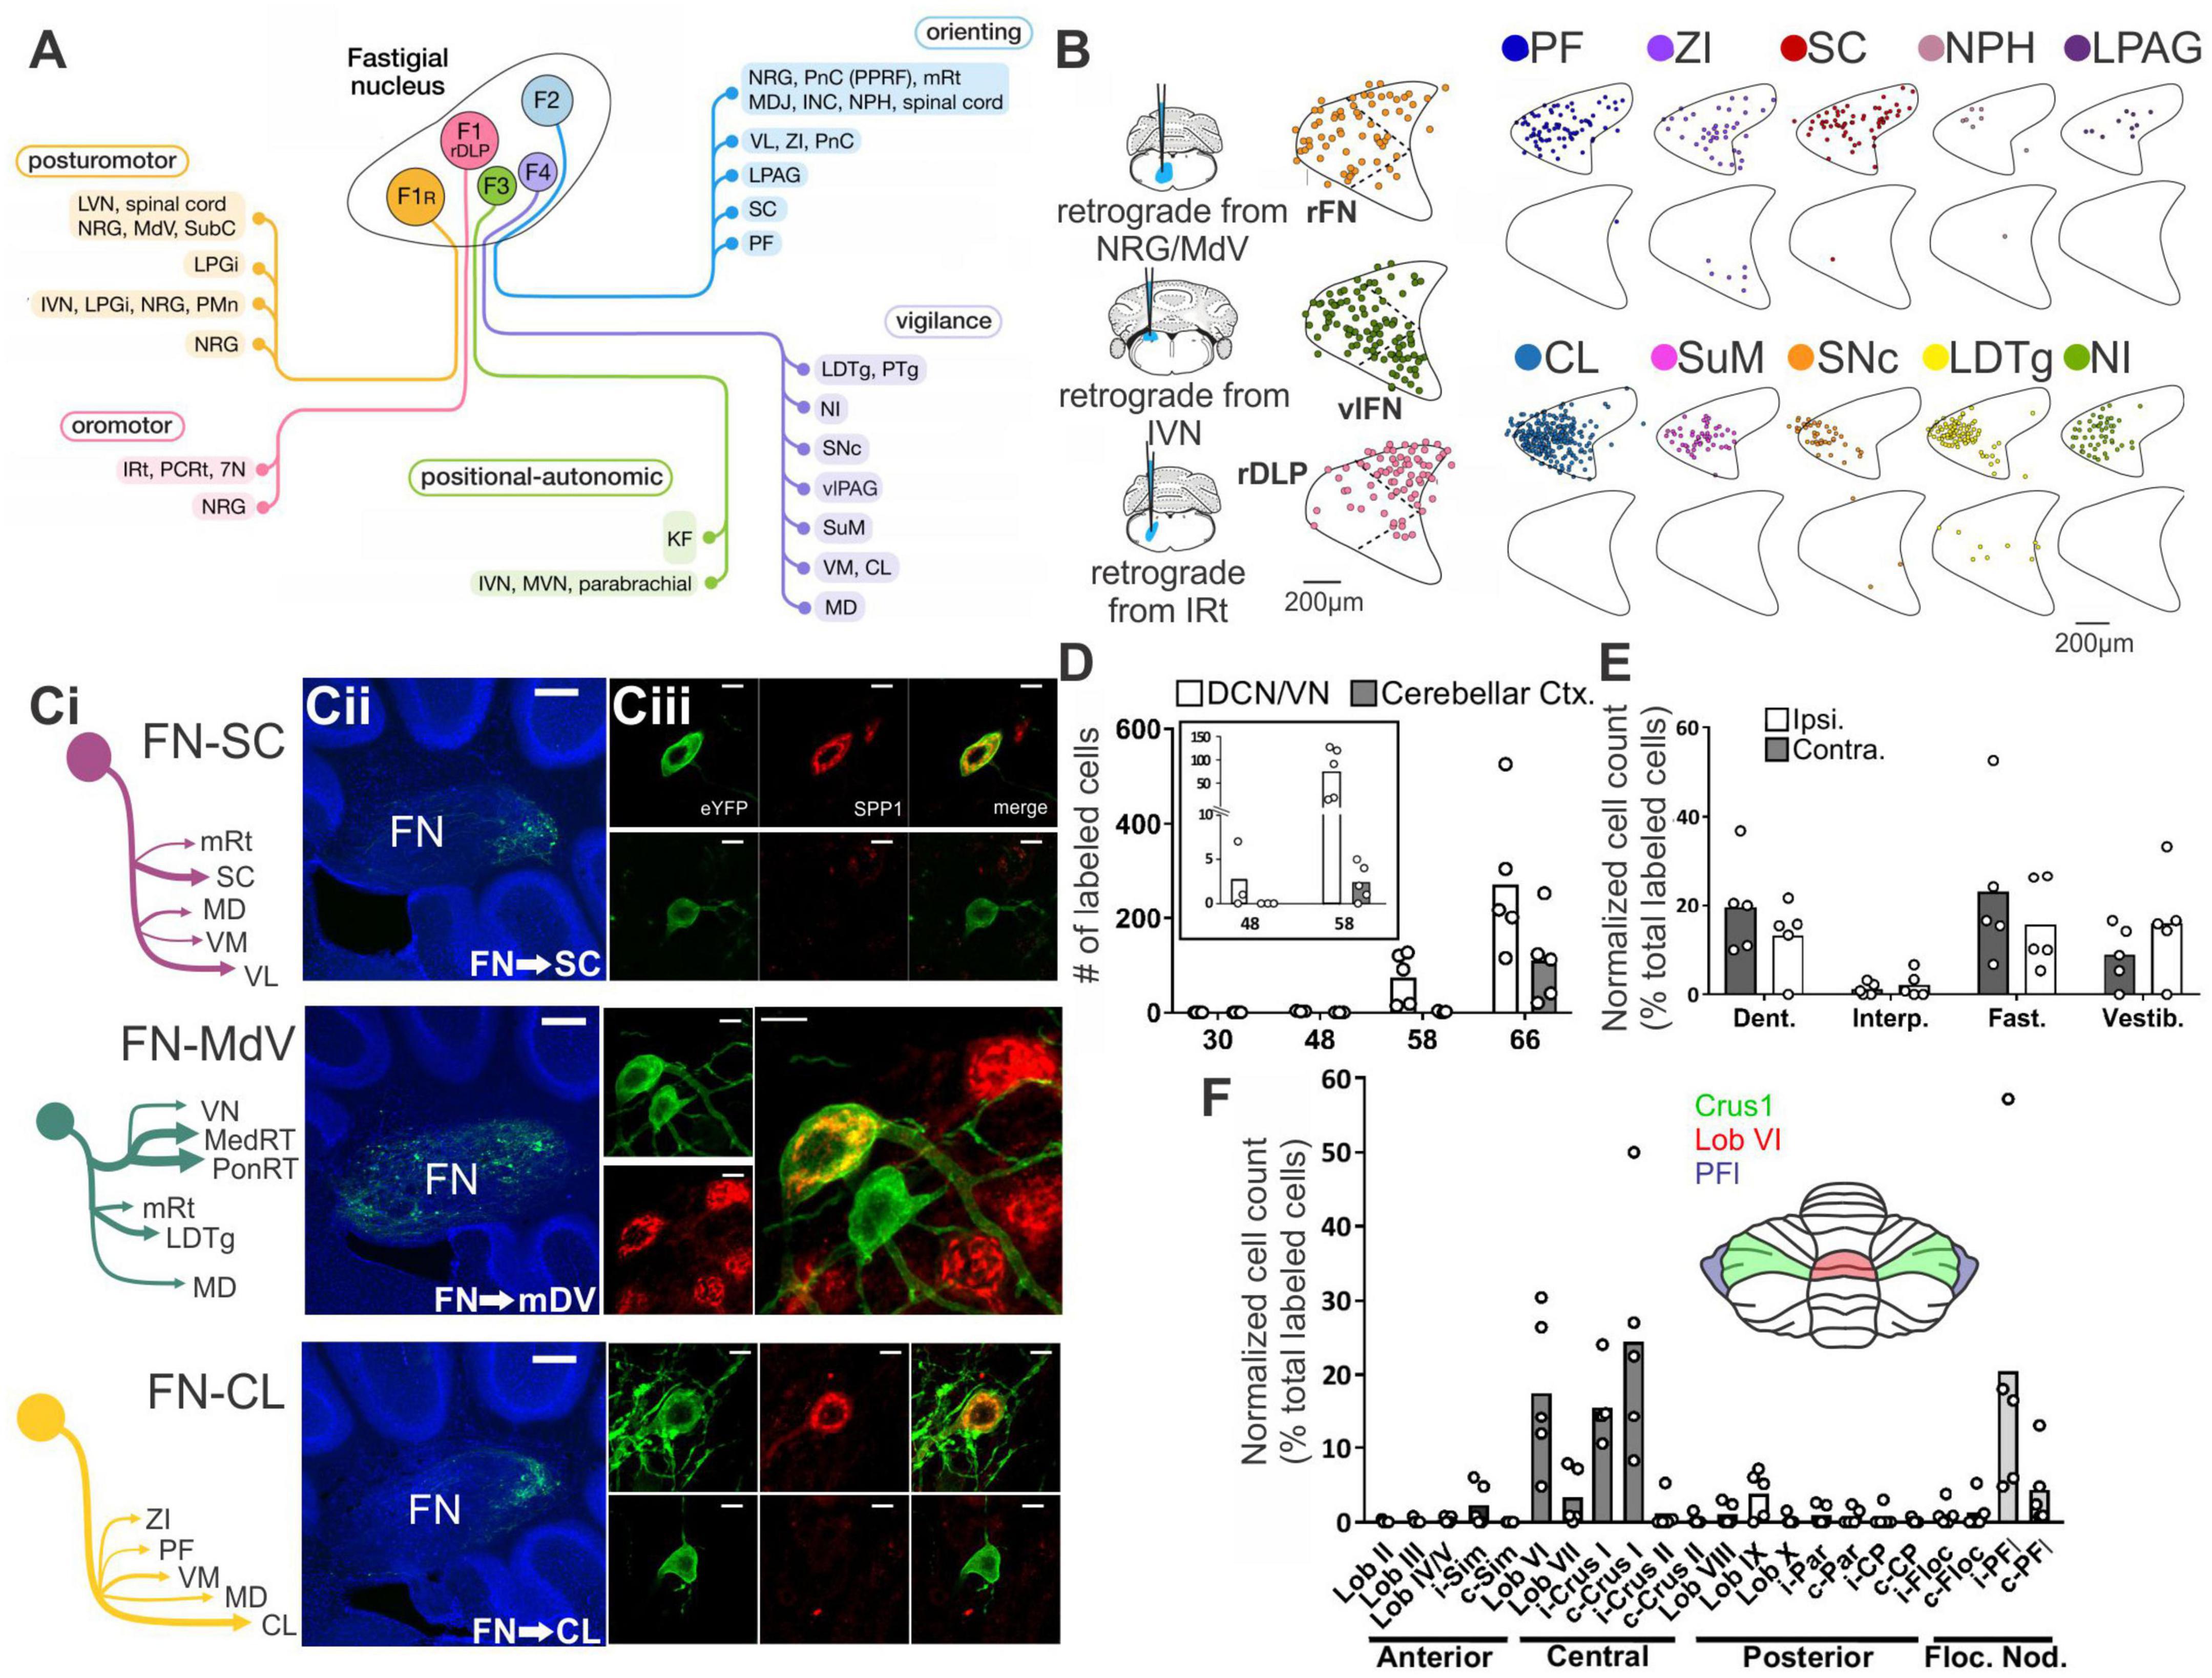
Figure 1. There are many avenues by which the cerebellum could influence the hippocampus. (A) Diagram modified from Fujita et al. (2020) outlining organized outputs from the Fastigial Nucleus (FN). FN outputs project to a wide variety of both motor and non-motor regions via segregated output channels. The sheer number of outputs from a single output nucleus of the cerebellum illustrates the complexity of determining which targets may serve as intermediaries for a hippobellum circuit. (B) FN neurons projecting to different downstream areas – labeled via retrograde tracer injections (left) into target regions – reside in distinct, but overlapping, FN subregions (i.e., rostral, ventral, dorsolateral, and caudal). Dots within the FN outlines are individual neurons that project to each output structure. The schematics on the right show two coronal outlines of the fastigial nucleus – one caudal (top rows) and one rostral (bottom rows). Note that several downstream regions are targeted by neurons residing largely in the caudal portion of the FN. (C) A detailed study of three output channels of the FN further illustrates that while FN neurons project to multiple areas (i.e., have collaterals), they do so in a structured manner, with collaterals to specific subsets of target regions. Retrograde-AAV-Cre was injected into a target region (SC, MdV, or CL), and a Cre-dependent AAV was injected into the FN, allowing visualization of projections from specific FN neuronal populations. (Ci) Arrow thickness indicates density of each projection relative to general FN input to that region, for neurons labeled based on their projections to the SC (top), the MdV (middle), or the CL (bottom). (Cii) FN cells retrogradely labeled from injections in the SC (top), MdV (middle), or CL (bottom) are in distinct but overlapping areas of the FN. Scale bars: 200 μm. Images show a sagittal view of the FN; note the clustering of both FN-SC and FN-CL neurons in the more caudal portions. (Ciii) Projection neurons have a heterogeneous molecular profile, with both SPP1 + (red and green overlay) and SPP1- (green only) FN cells projecting to each examined extra-cerebellar region. Scale bars: 10 μm. (D–F) Retrograde multi-synaptic rabies (RABV) tracing following injection into the dorsal dentate gyrus shows that multiple cerebellar areas are anatomically, multi-synaptically, connected to the hippocampus. Each dot represents one animal. (D) Number of labeled cells at each time point post RABV injection. A lack of labeled cells in the cerebellum at the 30-h time point suggests there is no monosynaptic connection between the cerebellum and the hippocampus. A small number of cells were labeled in the cerebellum after 48 h (graph inset) indicating a possible disynaptic connection, but most labeled cells were seen at 58 h and 66 h post injection, suggesting more complicated multi-synaptic circuity. (E) Distribution of labeled cells in each cerebellar nucleus at the 58-h time point. Most RABV labeled cells were found in the dentate, fastigial, and vestibular nuclei providing multiple routes for cerebello-hippocampal communication. (F) Distribution of cells in the cerebellar cortex. RABV + cells are concentrated in lobule VI in the vermis, and Crus I and paraflocculus in the hemispheres, highlighted in the inset schematic. Figure panels modified from Fujita et al. (2020) panels (A,B), (Streng et al., 2021) panel (C), and (Watson et al., 2019) panels (D-F), all under a CC-BY 4.0 license. 7N, facial nucleus; CL, centrolateral thalamic nucleus; contra., c, contralateral; CP, copula; ctx., cortex; DCN, deep cerebellar nuclei; dent, dentate nucleus; DLP, dorsolateral protuberance of FN; rFN, rostral FN; vlFN, ventrolateral FN; Floc, flocculus; Floc. Nod., flocculonodular lobe; INC, interstitial nucleus of Cajal; IRt, intermediate reticular nucleus; interp., interposed nucleus; IVN, intermediate vestibular nucleus; ipsi., i, ipsilateral; KF, Kölliker-Fuse nucleus; LDTg, laterodorsal tegmental nucleus; LPAG, lateral periaqueductal gray; LPGi, lateral paragigantocellular nucleus; LVN, lateral vestibular nucleus; lob, lobule; MD, mediodorsal thalamic nucleus; MDJ, mesodiencephalic junction; MedRT, medullary reticular nucleus; MdV, medullary reticular nucleus, ventral; mRt, mesencephalic reticular formation; MVN, medial vestibular nucleus; NPH, nucleus prepositus hypoglossi; NI, nucleus incertus; NRG, nucleus reticularis gigantocellularis; PCRt, parvocellular reticular nucleus; PF, parafascicular thalamic nucleus; PFl, paraflocculus; i-Par, c-Par, paramedian lobule; PMn, paramedian reticular nucleus; PonRT, pontine reticular nucleus; PnC, pontine reticular nucleus, caudal; PPRF, paramedian pontine reticular formation; PTg, pedunculotegmental nucleus; Sim, simplex; SC, superior colliculus; SNc, substantia nigra, pars compacta; SubC, subcoeruleus nucleus; SuM, supramammillary region; VL, ventrolateral thalamic nucleus; vlPAG, ventrolateral periaqueductal gray; VM, ventromedial thalamic nucleus; vestib., VN, vestibular nuclei; ZI, zona incerta ZI.
In addition to the sheer number of FN targets identified by Fujita et al. (2020), they also found that outputs from the Fastigial Nucleus are organized into output channels, with different FN neurons (often, but not always, residing in different portions of the FN, and often, but not always, displaying different gene expression profiles) projecting to different groups of downstream neurons (Figure 1B). Some of these output channels have been further refined in our recent work (Figure 1C) and examined in the context of the hippobellum in epilepsy (discussed later in this review). Notably, none of the over sixty downstream targets identified by Fujita and colleagues was the hippocampus (supporting a lack of direct connection between the two structures). Some areas receiving direct input from the FN that are of potential interest in the context of the hippobellum include the nucleus incertus and the supramammillary nucleus (SuM) – which both have direct projections to the hippocampus (nucleus incertus projections: Goto et al., 2001; Olucha-Bordonau et al., 2003; Szõnyi et al., 2019; SuM projections: Wyss et al., 1979; Haglund et al., 1984) – as well as the superior colliculus, reticular formation, and thalamus, which were investigated for potential roles in the hippobellum in epilepsy (Streng et al., 2021).
Fujita and colleagues also used high titer AAV1 to express Cre in a reporter mouse line to examine multi-synaptic connectivity with the FN (Fujita et al., 2020). High titer AAV1 can travel transynaptically (typically only one synapse, though multi-synaptic travel has been occasionally observed) in antero- and retrograde directions (Zingg et al., 2017, 2020). This theoretically allowed identification of regions which receive disynaptic input from the FN, as cells (and, importantly, their terminals) which receive input from the FN would express fluorescent tdTomato protein in a cre-dependent manner. Thus, areas receiving input from neurons that receive input from the fastigial nucleus would express the red reporter protein. Interestingly, even with this approach, fibers in the hippocampus were not observed, suggesting that either the AAV1 approach taken did not capture all disynaptic outputs, or that there is not a disynaptic pathway connecting the fastigial nucleus to the hippocampus. Areas which had labeled fibers with this AAV1 approach, and thus which in turn could potentially mediate a multi-synaptic pathway to the hippocampus, include, but were not limited to, the medial septum and diagonal band, the striatum (possibly in part via the central lateral thalamus), and the cingulate, insular, and prelimbic cortices (though not the medial orbital or infralimbic cortices) (Fujita et al., 2020). Interestingly, no major labeling was noted in the amygdala (for monosynaptic or disynaptic labeling), suggesting this may not be a major route from the fastigial to the hippocampus (Fujita et al., 2020).
Of course, the fastigial nucleus is not the only output from the cerebellum. In addition to the other deep cerebellar nuclei (DCN), cerebellar output could be routed via the vestibular nuclei (Kang et al., 2021; Novello et al., 2022), the locus coeruleus (Schwarz et al., 2015), or the parabrachial nucleus (Hashimoto et al., 2018; Chen et al., 2022). There are a number of excellent reviews considering the relevance of the vestibular system to hippocampal processing (Smith, 1997; Smith et al., 2005; Hitier et al., 2014; Aitken et al., 2018), and the locus coeruleus has direct projections to the hippocampus (Loughlin et al., 1986; Klukowski and Harley, 1994; Kempadoo et al., 2016; Kaufman et al., 2020). It remains to be seen if the particular neurons in these areas which receive direct inputs from the DCN (or from Purkinje cells) in turn project to the hippocampus.
Another important study examining potential circuitry from the cerebellum to the hippocampus was done by Watson and colleagues, who used non-modified rabies virus with time post-injection as a proxy for the number of synapses travelled (Watson et al., 2019). Rabies was injected primarily into the dorsal dentate gyrus and labeled cells were examined at post-injection times of 30 (presumed monosynaptic), 48 (presumed disynaptic), 58 (presumed trisynaptic), and 66 h (presumed to be 4 synapses back) (Figure 1D). No rabies-labeled cerebellar cells were found at 30 h, again arguing against a direct connection. As expected, areas which did show labeling at 30 h included regions such as medial septum/diagonal band, SuM, and entorhinal cortices (Watson et al., 2019). As discussed previously, the SuM was found to have direct fastigial inputs by Fujita et al., suggesting a possible disynaptic route to the hippocampus – although, as noted above, no evidence was found in Fujita et al. for a disynaptic pathway to the hippocampus (Fujita et al., 2020). However, the medial septum and diagonal band were found to have likely disynaptic inputs from the FN by Fujita et al., suggesting a possible trisynaptic pathway from the DCN to the hippocampus. Additional areas labeled by rabies due to putative monosynaptic inputs to the hippocampus include the raphe, striatum, and locus coeruleus (Watson et al., 2019), underscoring the possibility of multiple potential pathways from the cerebellum to the hippocampus. However, it remains to be shown that any of these areas do indeed represent such connectivity.
Interestingly, already at 48 h (suggestive of disynaptic input to the hippocampus), some cells were labeled in the DCN (Figure 1D). However, these were extremely limited, and no labelled cells were seen in the cerebellar cortex at this time point. In one animal, three cells were also present in the vestibular nucleus. Areas with heavier labeling at 48hrs included the periaqueductal grey (PAG), the laterodorsal tegmental nucleus (LDTg), and other pontine nuclei (Watson et al., 2019). Note that both the PAG and LDTg receive direct inputs from the DCN (Figures 1A–C) (Teune et al., 2000; Fujita et al., 2020; Kang et al., 2021; Streng et al., 2021; Novello et al., 2022). Fairly strong labeling was also present in the nucleus incertus at this time point (Watson et al., 2019), which may reflect connectivity via (CA1) somatostatin interneurons (Szõnyi et al., 2019), and represents another potential route from cerebellum to hippocampus.
By 58 h after rabies injection into the dorsal dentate gyrus of the hippocampus, rabies labeling was present in bilateral deep cerebellar and vestibular nuclei – including strong labeling in the dentate and fastigial DCN (Figure 1E). Labeling in the FN was concentrated in the caudal portion of the nucleus (Watson et al., 2019), fitting with FN neurons with projections to areas like the thalamus, superior colliculus, PAG, LDTg, zona incerta, and SuM (Figures 1B, C) (Fujita et al., 2020; Streng et al., 2021). Interestingly, sparse expression was also already visible within the cerebellar cortex itself at the 58 h timepoint, and this was much stronger at 66 h (Figure 1D; Watson et al., 2019). At 66 h post injection, the strongest labeling within the cerebellar cortex was observed in the central cerebellum and the ipsilateral paraflocculus, though some labeling was also present in the posterior cerebellum (particularly in lobule IX), and in the anterior cerebellum (particularly in the simplex) (Figure 1F) (Watson et al., 2019). Within the central cerebellum, strong labeling was seen in lobule VI and Crus I, with less strong labeling in lobule VII (Figure 1F). Interestingly, across the cerebellum, rabies positive Purkinje cells were clustered and zebrin-positive (Watson et al., 2019).
Together, the results from Watson et al.’s rabies tracing work suggests distributed, multi-synaptic, input from the cerebellum – with bilateral vestibular, dentate, and fastigial DCN labeled – but also restricted input from the cerebellum, seen as clusters of Purkinje cells in zebrin-positive zones in specific lobules (Figures 1D–F). This work establishes that there are likely multiple pathways by which the cerebellum can influence the hippocampus. Additional pathways may become apparent with additional research. For example, new experiments with starter sites in the ventral CA1 may indicate additional cerebellar regions that connect to the hippocampus, as well as new potential intermediary structures. It should also be noted that this work emphasizes another important point – although we do not yet know (all) the pathways by which the cerebellum influences the hippocampus, and how these relate to specific functions, there are specific pathways. At the time points examined, select subsets of cells in specific areas were labeled – it is not merely that at enough synapses, any two regions or neurons in the brain may be connected. Just as there are specific, multi-synaptic, routes by which the cerebellum influences the neocortex, there are specific routes by which the cerebellum influences the allocortex, including the routes contained within the labeled cells in Watson et al. (2019).
We have focused thus far exclusively on the cerebellum to the hippocampus as much less is known about the hippocampus to the cerebellum. Based on how the neocortex influences the cerebellum, one can speculate that it involves the pontine nuclei and mossy fiber inputs (Mitra and Snider, 1975). However, this may possibly be via neocortex intermediate(s) (Schmahmann, 1996; Kelly and Strick, 2003; Takehara-Nishiuchi, 2018). New strategies which allow researchers to better directly connect all the dots (e.g., modified rabies virus coupled with retrograde AAV vectors) will be helpful as we continue to slowly unravel the mystery of which pathways underlie the bidirectionally-connected hippobellum.
Acute demonstrations of functional connectivityEarly electrical stimulation work supported the bidirectional nature of the hippobellum: work done in the seventies found that electrical stimulation of the cerebellum produced short latency responses in the hippocampus (< 20 ms) (Heath and Harper, 1974; Snider and Maiti, 1976; Heath et al., 1978; Newman and Reza, 1979), and stimulation of the hippocampus evoked responses in the cerebellum (latencies between ∼8-30 ms) (Sager et al., 1970; Newman and Reza, 1979). Electrical stimulation has a number of associated caveats, but work examining epileptiform discharges, discussed more later in this review, further supports the idea that the hippocampus can have acute impacts on the cerebellum (Mitra and Snider, 1975; Heath et al., 1980; Krook-Magnuson et al., 2014). Many of the caveats of electrical stimulation can also be avoided using optogenetic approaches, and multiple studies have examined the impact of acute cerebellar optogenetic manipulation on the hippocampus.
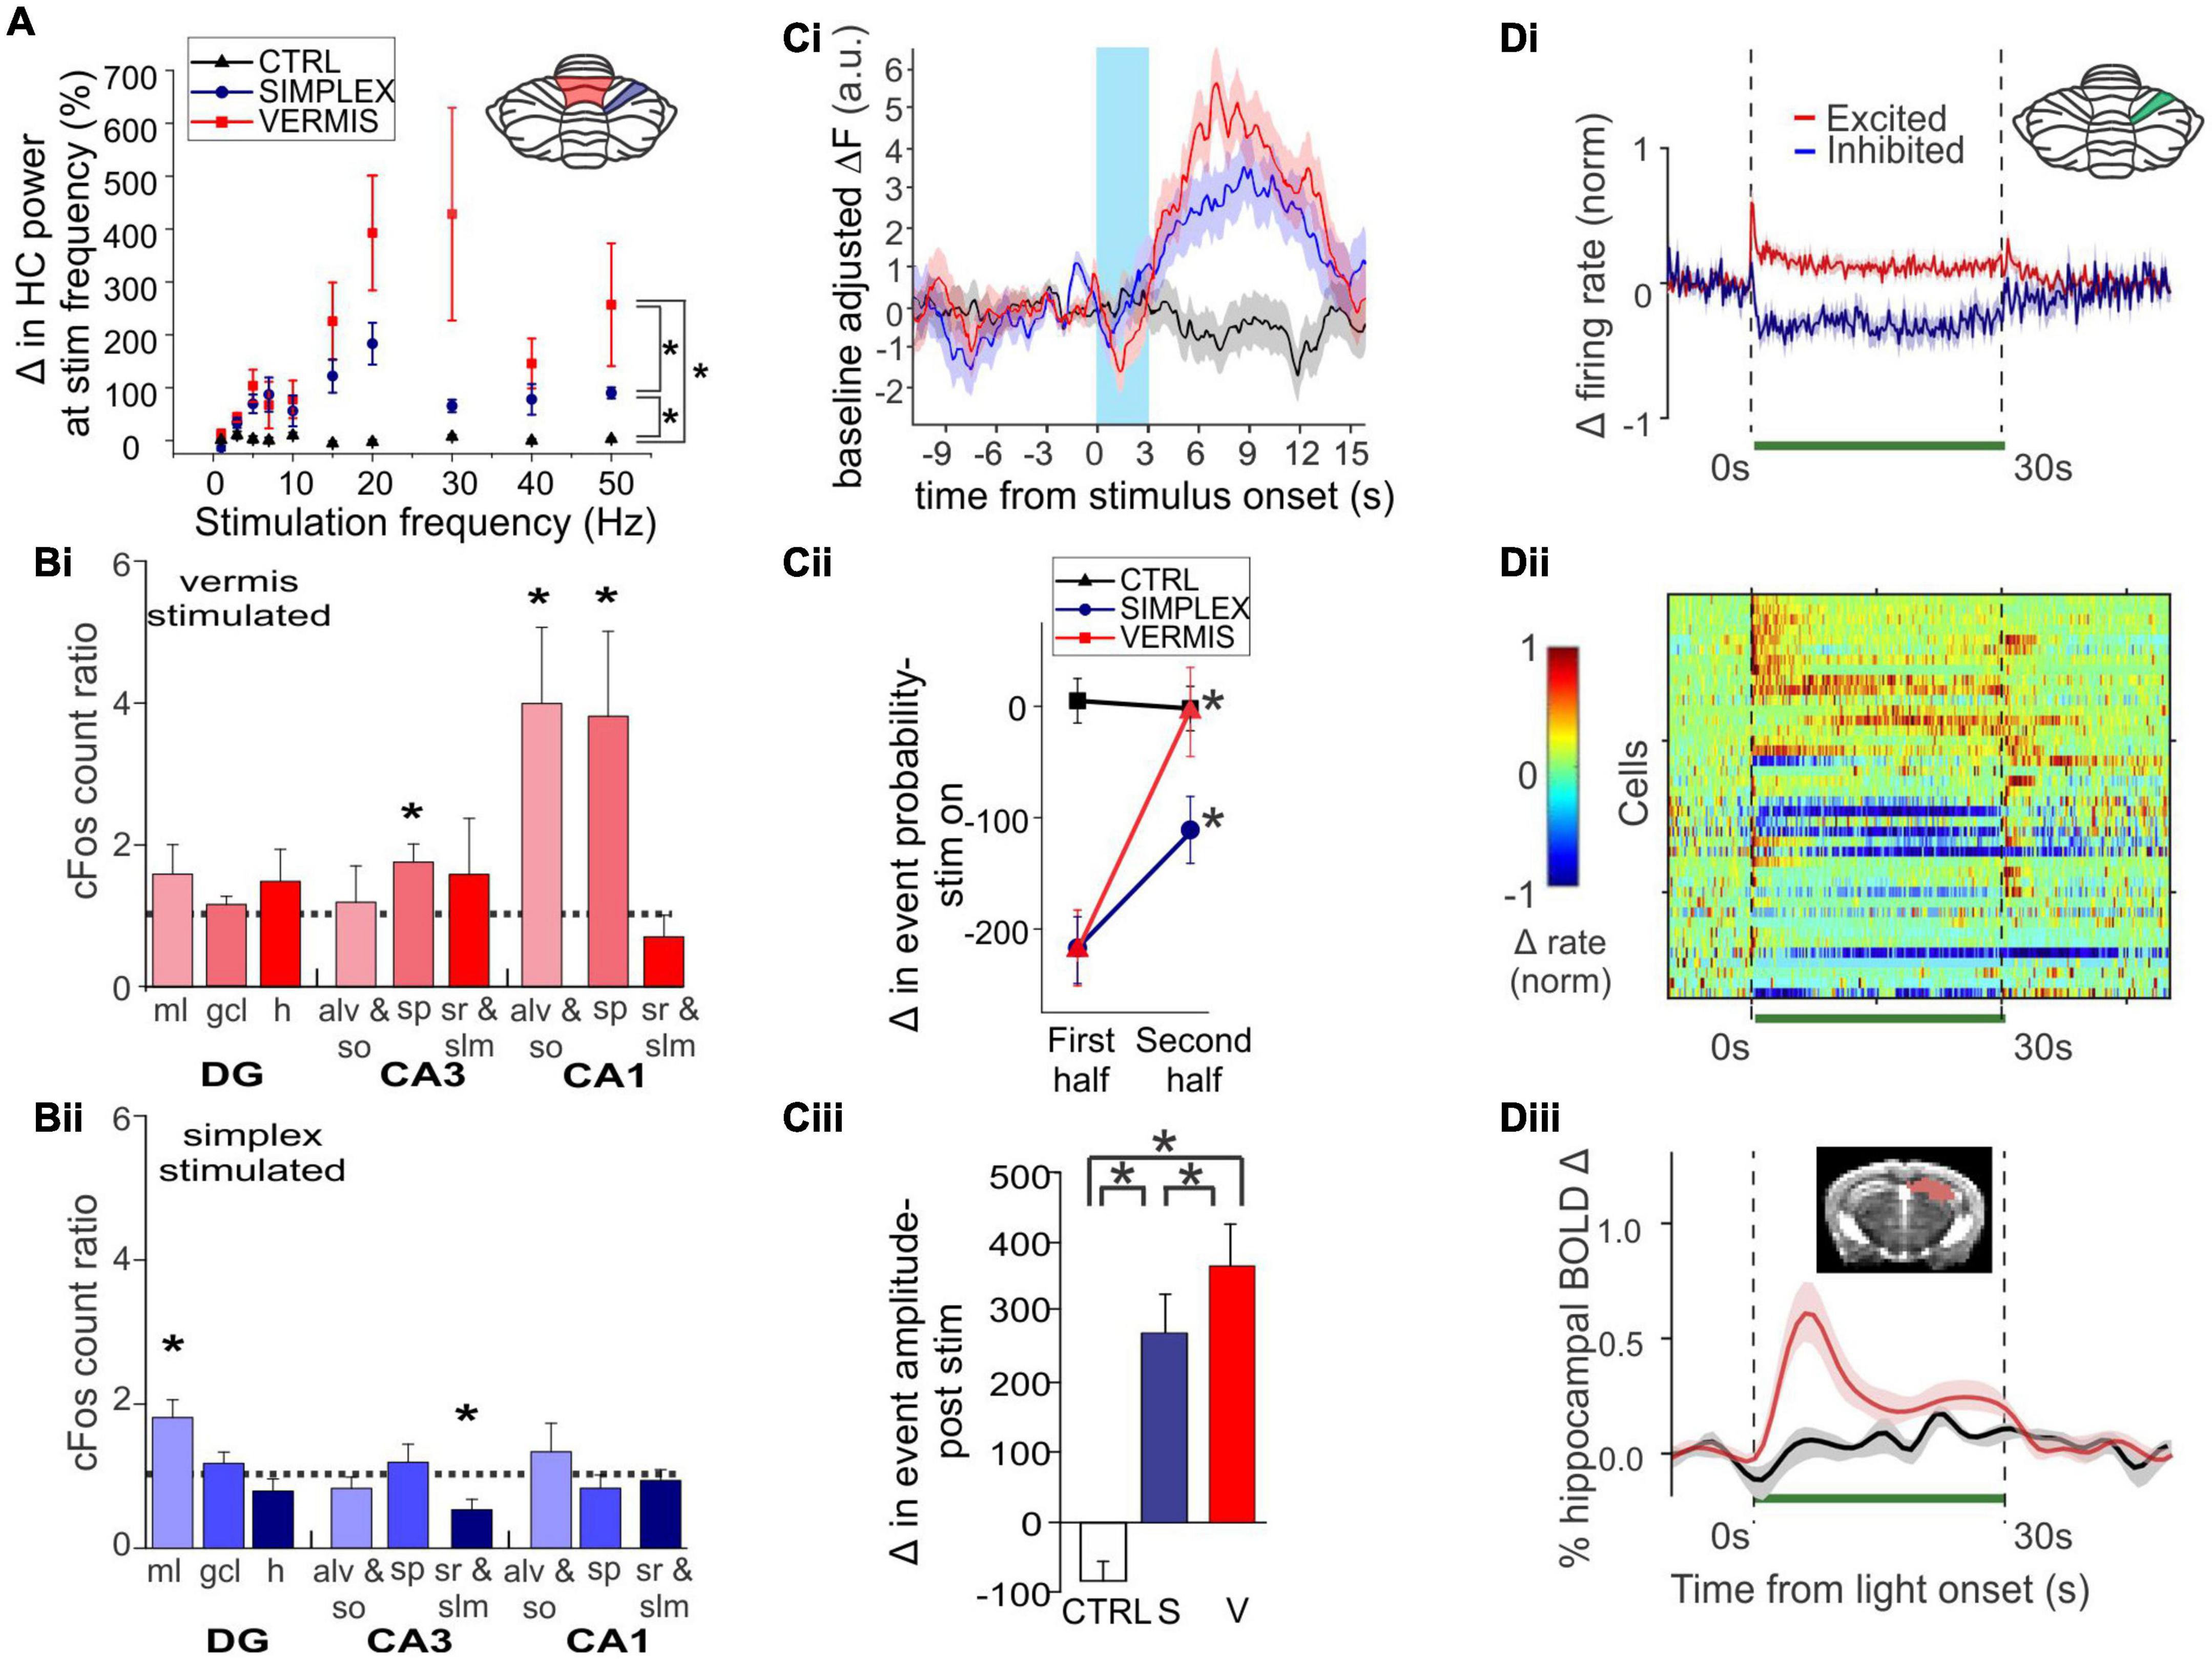
Zeidler et al. (2020) used optogenetics to acutely activate Purkinje cells in either the simplex or the vermis (lobule IV/V) and examined a range of impacts on the hippocampus. Most closely fitting to earlier electrical stimulation studies, Zeidler et al. found that brief light activation of Purkinje cells (in either cerebellar area) produced a hippocampal local field (LFP) response (Figure 2A). The latency from the start of light onset (10 ms pulse width) to the peak of the initial response in the hippocampus was ∼13-16 ms. A range of stimulation frequencies were examined, with the strongest hippocampal responses being evoked at frequencies above 15Hz (Figure 2A). Optogenetic activation also increased cFos expression in the hippocampus, but only in particular regions (Figure 2B). Specifically, significant increases were seen in the dentate gyrus molecular layer (home to inhibitory interneurons) following simplex stimulation and in the stratum pyramidale (a principal cell layer) of CA3 and CA1 and the alveus/oriens (containing generally inhibitory interneurons) in CA1 following vermal stimulation. This data shows that cerebellar activation does not simply produce a generalized activation of the entire hippocampus but instead engages both excitatory and inhibitory elements in specific subregions. Zeidler et al. also monitored CA1 activity using miniscopes and calcium imaging. Overall, simplex or vermal stimulation led to an acute decrease in event probability during the time of light delivery followed by a very large rebound in event amplitude (Figure 2C).
Figure 2. Acute cerebellar modulation alters activity in the hippocampus. (A) Activation of Purkinje cells with channelrhodopsin (ChR) in the vermis (red symbols) or simplex (blue symbols) increases hippocampal LFP power at the stimulation frequency, across many frequencies. Inset: Schematic showing lobule IV/V vermis (red shading) and simplex (blue shading), which are targeted in panels (A-C). Black symbols: Opsin-negative controls. (B) Activation of Purkinje cells in the vermis (Bi) or simplex (Bii) alters cFOS expression in multiple hippocampal subregions and layers, suggesting region-specific recruitment of excitatory and inhibitory cell populations. (C) Cerebellar stimulation also alters calcium activity in CA1, measured in vivo using miniscopes. (Ci) Calcium fluorescence prior to, during (blue shaded region), and after cerebellar stimulation, showing a decrease during stimulation and an increase after stimulation. Red trace: Vermis stimulation. Blue: Simplex stimulation. Black: Opsin-negative controls. (Cii) Analysis of deconvolved calcium data shows a transient decrease in event probability during light delivery, especially in the first half of the stimulation. No such effect was seen in opsin-negative controls. (Ciii) A large increase in event amplitude was seen after light delivery offset. (D) Inhibition of Purkinje cells with Archaerhodopsin (Arch) near the simplex (green shading in inset) alters activity of cells in the hippocampus, shown at the level of single units and via a population Blood-Oxygen Level Dependent (BOLD) signal. (Di) Summarized data from (Dii), showing that some hippocampal cells are excited (red trace), while others are inhibited (blue trace), by light delivery to the cerebellum (green bar). (Dii) Single unit recordings during inhibition of Purkinje cells. Cool colors represent decreased firing rate; warm colors represent increased firing rates. Note also the bursts of activity seen in some units at light offset. (Diii) Cerebellar manipulation results in an increased BOLD signal in the hippocampus (red trace: Arch; black: Opsin-negative control). Inset: Mask used for area of BOLD measurement. Together these data show that acute cerebellar manipulation impacts activity in the hippocampus, and likely influences populations of both principal cells and interneurons. Panels (A-C) were reproduced with modification from Zeidler et al. (2020) panels (A-C) under a CC-BY 4.0 license. Panel (D) was modified slightly for arrangement from Choe et al. (2018) with permission from Elsevier.
Acute effects of cerebellar optogenetic manipulation on the hippocampus were also examined in work conducted by Choe et al. (2018). Fitting with data discussed above, single unit recordings from the hippocampus showed both inhibitory and (bursty) excitatory responses to acute inhibition of the cerebellar cortex near the simplex (Figures 2Di, Dii). Nearly 70% of dorsal hippocampal neurons showed some form of modulation. The majority of those were inhibited, but 18% showed some form of excitation, often bursting at onset and/or offset (Figures 2Di, Dii). Choe et al. additionally took a whole brain view of areas modulated by this cerebellar manipulation by doing fMRI concurrent with optogenetics (termed ofMRI). Several pieces of key information come from this work. First, the hippocampus is activated by their acute cerebellar manipulation, as seen by increases in the BOLD signal (Figure 2Diii). Second, this increase happens with very short (for a BOLD response) delay from the start of cerebellar manipulation (fitting with the single cell, calcium imaging, and LFP data already described). Third, while the hippocampus was one of several brain areas to show a BOLD response, BOLD responses occurred in only select areas (i.e., it was not a brain-wide response). The contralateral hippocampus had 21% of voxels activated. For comparison, the motor cortex showed 22% activation. The reticular formation, thalamus, anterior cingulate and retrosplenial cortices were among the additional areas showing increases (70, 46, 25, and 23% respectively). In contrast, basal ganglia showed only 2%, somatosensory cortex 5%, and rhinal and insular showed 0% (Choe et al., 2018). This highlights that effects of the cerebellum on hippocampal activity are specific – cerebellar manipulation does not create BOLD changes in the entire brain but rather in a subset of regions that includes the hippocampus.
Functional collaborations – Coordinated oscillationsWhile the above studies demonstrate connectivity of the hippocampus and the cerebellum, they provide limited insight into the function of such connectivity – why do these two seemingly disparate brain regions talk to one another? What information are they providing to each other? What functions in each brain region does this communication help support? While many more questions than answers remain, research is providing important insight into the potential functions and conditions under which the cerebellum and the hippocampus collaborate. We discuss first their coordinated oscillatory activities. Context-dependent coherent oscillations are detected in brain regions collaborating on specific tasks, and such oscillations are thought to help with information transfer between regions (Fries, 2005; Jones and Wilson, 2005; Sirota et al., 2008; Hyman et al., 2010; Colgin, 2011; Spellman et al., 2015). Coherent oscillations have been noted between the hippocampus and the cerebellum, by several labs and in several contexts.
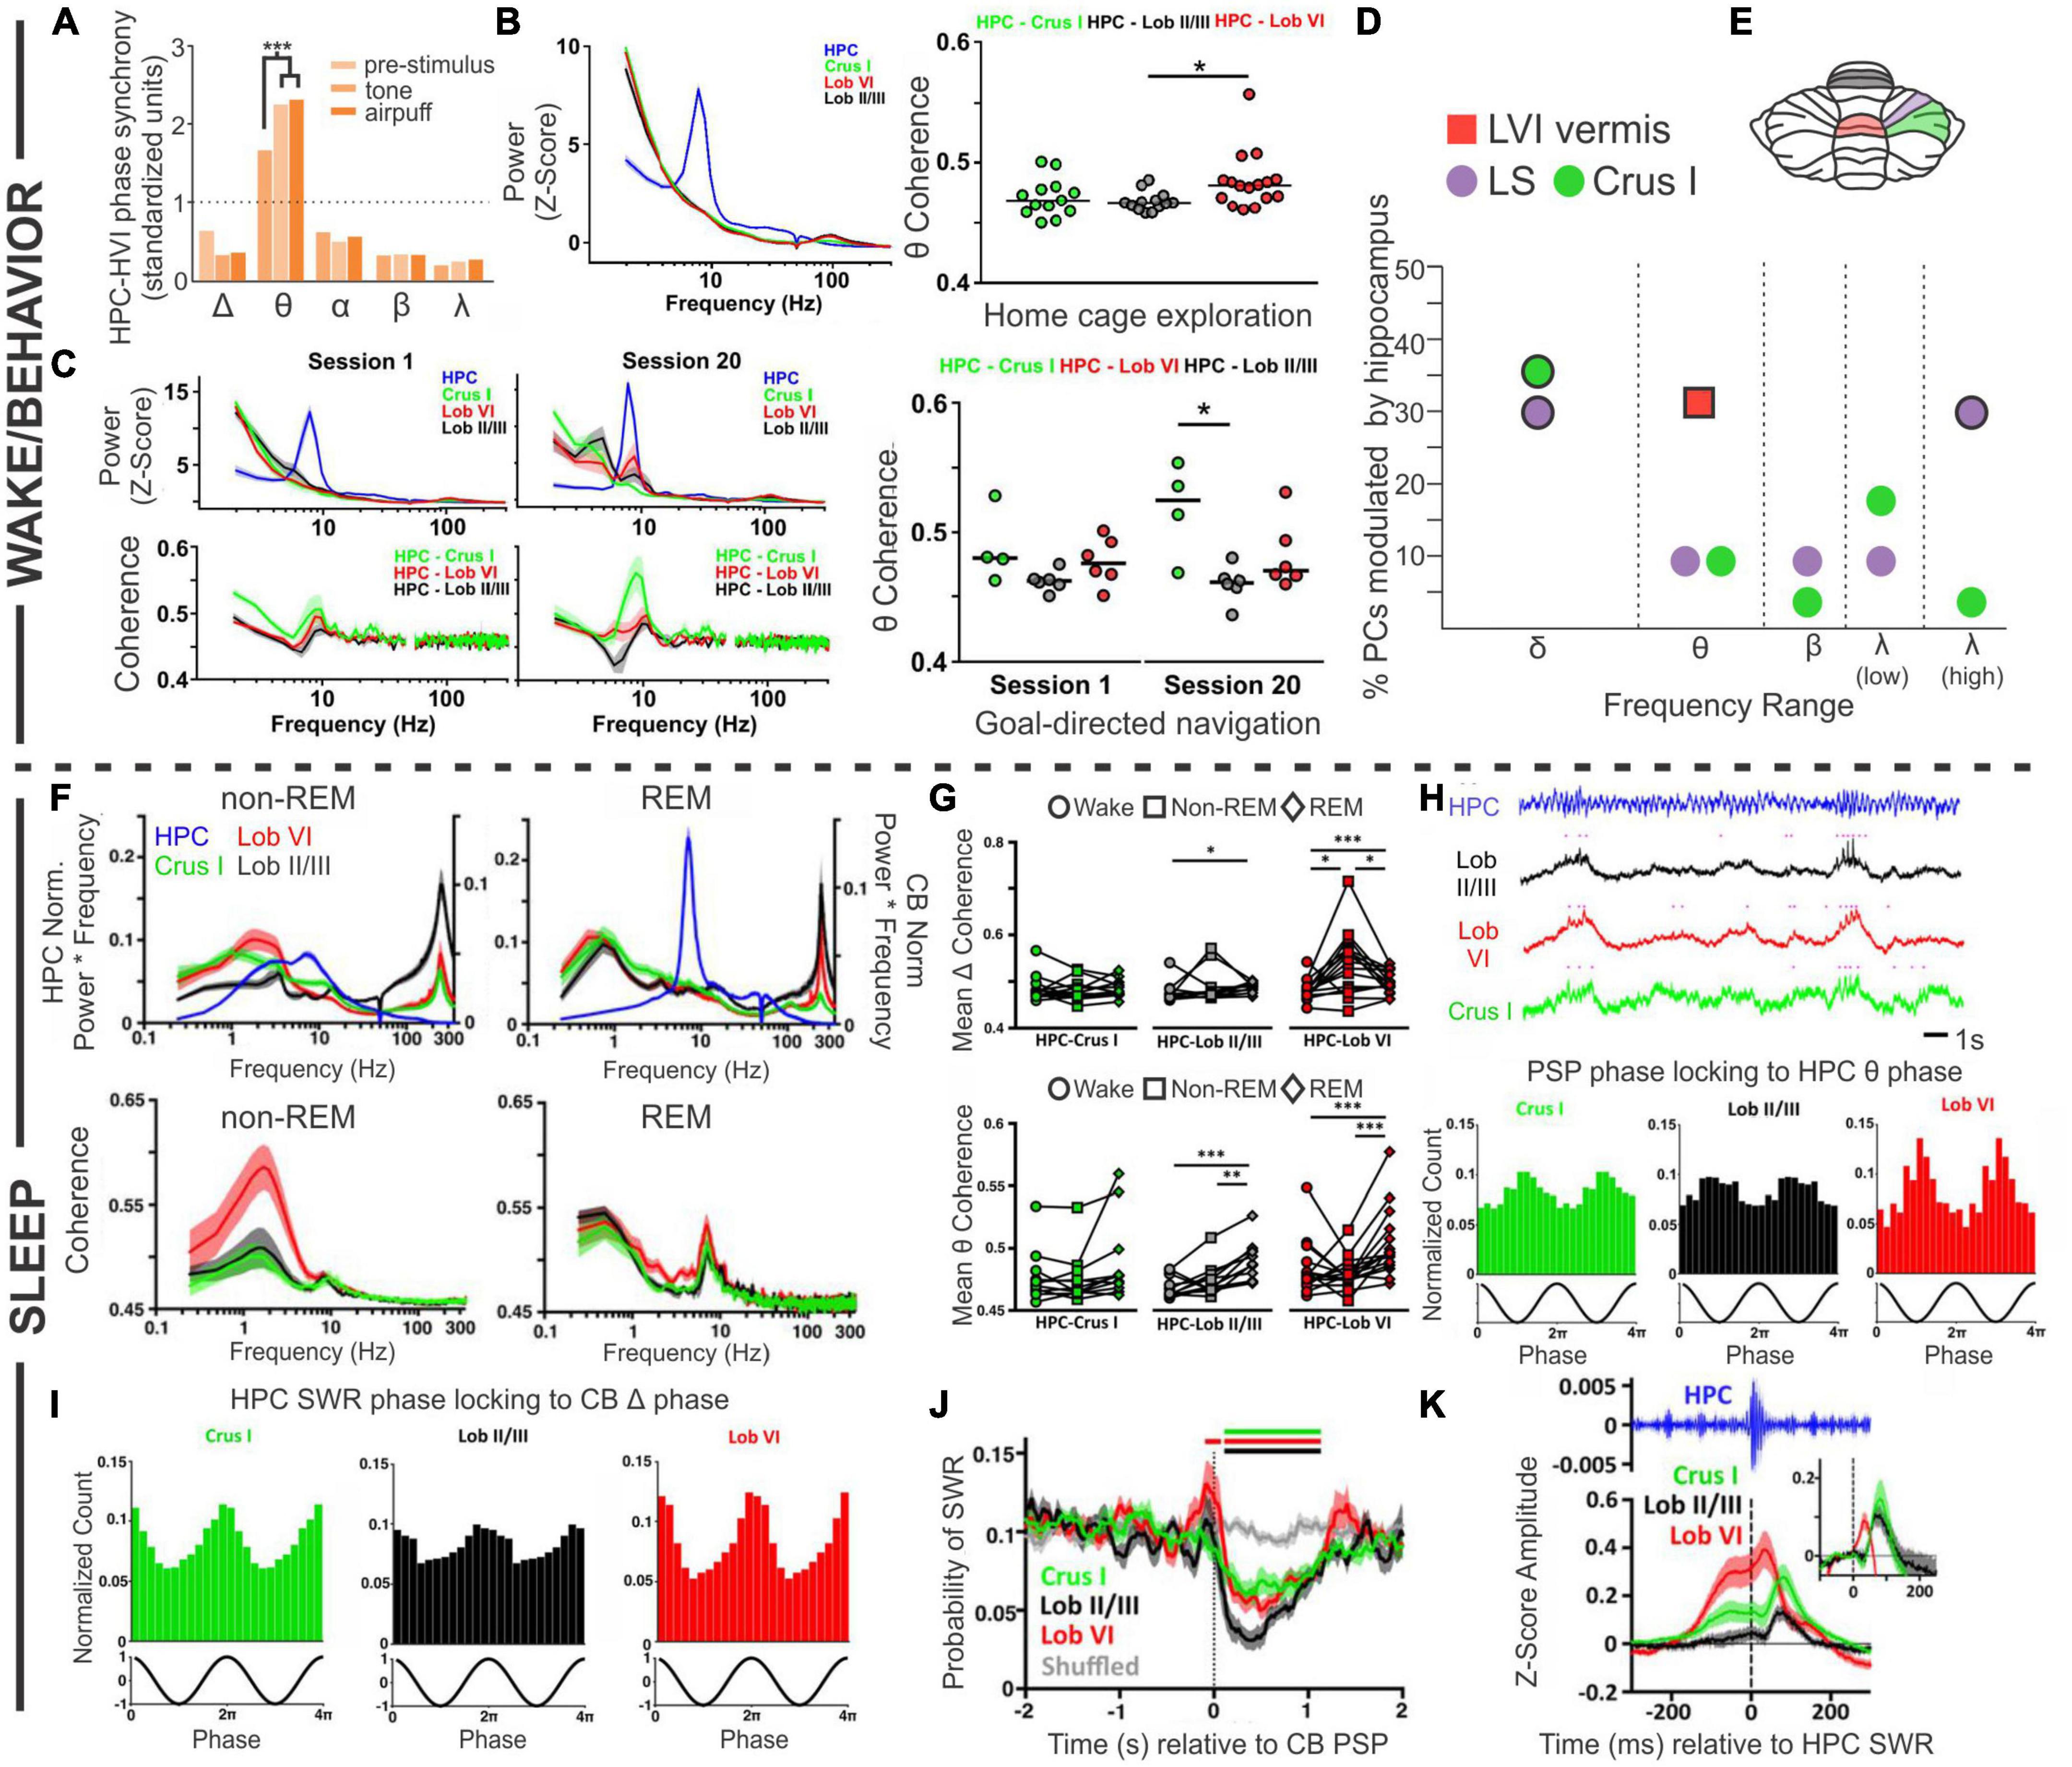
One example of task-specific coherent cerebellar-hippocampal oscillations comes from trace eyeblink conditioning, with work often done in rabbits. Note that rabbits can show strong hippocampal theta during trace eyeblink conditioning, even though not running (Hoffmann et al., 2015). Trace eyeblink conditioning is a version of eyeblink conditioning which, in addition to being cerebellar dependent, is also hippocampal dependent – as discussed more in later sections and reviewed in Takehara-Nishiuchi (2018). Wikgren et al. (2010) recorded from the hippocampus and lobule VI in the cerebellum, and found that the power of theta (or more specifically, theta to delta ratio) in the hippocampus and cerebellum corresponded to one another; high theta in the cerebellum was noted when the hippocampus was in a theta state. Moreover, they observed coherence in cerebellar and hippocampal theta oscillations (i.e., phase synchrony) during trace eyeblink conditioning, especially during high hippocampal theta states (Figure 3A). Coherence increased in response to the conditioned or unconditioned stimulus (even in already high theta states) but decreased over the course of training. Notably, they did not observe significant coherence for any of the other frequency bands examined (delta, alpha, beta, gamma) (Figure 3A). Hoffmann and Berry (2009) likewise found that when training occurred during theta states – in which they saw covariant theta time locked to the sensory stimuli in the cerebellar cortex, cerebellar interposed nucleus, and hippocampus – there was an enhancement of learning. A relationship between hippocampal theta state and eyeblink conditioning has been observed in several studies (Berry and Thompson, 1979; Seager et al., 2002; Nokia et al., 2008).
Figure 3. Coordinated oscillations. Coordination between the cerebellum and the hippocampus during wake or active behaviors (A–D) or during sleep states (F–K). (A) During trace eyeblink conditioning in rabbits, the hippocampal (HPC) and cerebellar hemisphere lobule VI (HVI) theta (θ) oscillations show phase synchrony. This coherence is not found for other frequencies and is increased by conditioned (tone) or unconditioned (airpuff) stimulus presentation. (B) Left: During home cage exploration, the hippocampus (blue trace) but not the cerebellum (green: Crus 1; black: lobule II/II; red: lobule VI) shows high theta power. Right: The two structures do however, display coherence in theta oscillations during home cage exploration, with the highest levels of theta coherence with the hippocampus seen in lobule VI. (C) Power in each brain region (top) and cerebellar coherence with hippocampal oscillations (bottom) early during training (Session 1, left) and late during training (Session 20, middle), on a linear track with reward locations. Interestingly, by Session 20, there is a slight peak in lobule VI power in the theta range (top middle, red peak) that is not present on the first day of training (top left). Coherence between the structures in Session 1 is similar to what is seen during home cage exploration (compare to panel B), but on Session 20, when the animals are fully trained, there is increased coherence between the hippocampus and Crus I (middle bottom, green peak). Right: Summary theta coherence data across animals, by session and cerebellar region. (D) Cerebellar single units were phase locked to different hippocampal frequencies with regional differences: Purkinje cells (PCs) in simplex lobule (LS; lilac circles) phase locked with both delta (peaking at 1Hz) and high gamma (peaking at 60 Hz), while Crus I PCs (green circles) were modulated only by hippocampal delta (peaking at approximately 1.5 Hz and 2.5 Hz). PCs in lobule VI (LVI; red square) were modulated by hippocampal theta (6-12 Hz) specifically during active locomotion. Frequencies at which modulation was found to be significant in each region are outlined in black. (E) Rodent cerebellar flatmap showing the regions of the cerebellum described throughout the figure. Color coding consistent with other figure panels. (F–K) During sleep, the cerebellum and hippocampus show coordinated activity across sleep stages. (F) Power (top) and coherence (bottom) of oscillations in and between the cerebellum and the hippocampus during non-REM and REM sleep. Note that the y-axis labels (left and right) apply to both top panels. The hippocampus has high theta during REM sleep, while cerebellar oscillations are dominated by activity in the delta frequency range, in addition to very high frequency (∼250 Hz) activity, in both sleep stages. During non-REM sleep coherence between the structures is most prominent in the delta frequency (bottom left), while during REM sleep all three CB regions show a peak of coherence in the theta range (bottom right). (G) A summary of coherence in delta (top) and theta (bottom) ranges, comparing wake (circles), non-REM (squares), and REM (diamond) states. (H, top) All cerebellar regions examined display phasic sharp potentials (PSPs) (pink dots in traces represent PSP occurrences). (H, bottom) PSPs in all regions are phase locked to hippocampal theta. (I) Sharp wave ripples (SWRs) in the hippocampus during non-REM sleep phase lock to cerebellar delta phase. (J) Prior to cerebellar PSP there is an increase probability of hippocampal SWRs, and post cerebellar PSP there is a decreased probability of hippocampal SWRs. (K) Hippocampal SWRs are associated with evoked potentials in the cerebellum. Taken together, these studies each support the bidirectional coordination of the hippocampus and the cerebellum across tasks, brain states, and time scales. The graph in (A) has been recreated from data in Wikgren et al. (2010) with permission from Elsevier. The graph in (D) depicts a combination of data from McAfee et al. (2019) (LS and Crus I; circles) and (Watson et al., 2019) (Lob VI; square). Other panels in this figure have been reproduced with slight adaptations from Watson et al. (2019) (B,C) and (Torres-Herraez et al., 2022) (F–K), both under a CC-BY 4.0 license.
Another example of coordination between the hippocampus and the cerebellum comes from experiments in which cerebellar (Crus I, lobule II/III, or lobule VI) and hippocampal theta were examined during spontaneous homecage locomotion in mice (Watson et al., 2019). In contrast to findings during eyeblink conditioning, under these conditions Watson et al. found a strong theta oscillation only in the hippocampus and not in the cerebellum, at any recorded cerebellar location (Figure 3B). Coherence analysis, however, examining the relationship between oscillations in the hippocampus and cerebellum, did show a strong peak at theta (Figure 3B). Therefore, cerebellar-hippocampal theta coherence does not require a high theta amplitude per se. Cerebellar-hippocampal theta coherence occurred for all recorded cerebellar locations. It was overall the strongest in lobule VI, but there was considerable overlap between distributions at each location (Figure 3B). Note that lobule VI is one of the areas showing the strongest rabies labeling 66 h after injection into the hippocampus (Watson et al., 2019; Figure 1). Watson et al. also examined firing of single cerebellar neurons under head-fixed conditions and found that 31% of putative Purkinje neurons in lobule VI showed significant phase locking to hippocampal theta (Figure 3).
Compared to home cage locomotion, a slightly different picture emerged when Watson et al. examined the progression of coherence over several days of training on a goal-directed task (i.e., a linear track with reward zones on either end) (Watson et al., 2019). At the start of training, findings were overall very similar to home cage locomotion – a clear theta band was present in the hippocampus, but lacking from the cerebellum, and there was coherence between the hippocampus and the cerebellum in the theta range (Figure 3C). Which cerebellar region in particular had the greatest coherence showed some variability between the two conditions (home cage locomotion versus goal-direct linear track), suggesting some possible variability in the data or task-dependency. The greatest difference between the data sets, however, appeared once the animals were well-trained on the task. At the end of training (session 20), a theta peak was present in the cerebellum, chiefly in lobule VI (Figure 3C). Combined with data from eyeblink conditioning recordings described above, this suggests a possible influence of learning or task-dependency on the appearance or lack of cerebellar theta.
At all stages of training examined by Watson et al., cerebellar theta power in all recorded locations was positively correlated with mouse running speed (Watson et al., 2019). Cerebellar-hippocampal theta coherence, however, was not correlated with running speed early in training. Late in training, a region-specific profile emerged: cerebellar-hippocampal theta coherence was positively correlated with running speed in lobule VI, showed no correlation for Crus I, and interestingly, was actually negatively correlated with speed for lobule II/III. Despite not showing a correlation with running speed, Crus I theta coherence with the hippocampus was very strong at the well-trained stage in the task (Figure 3C). This suggests that not only do different cerebellar regions likely interact in different ways with the hippocampus but also that these interactions are dynamic and change during task learning. Note that Crus I also showed strong rabies labeling 66hrs after injection into the hippocampus (Figure 1F; Watson et al., 2019).
Rondi-Reig and colleagues, in work led by Torres-Herraez, additionally examined cerebellar oscillations and their relationship to hippocampal oscillations during sleep using many of the same animals as in Watson et al. (2019), Torres-Herraez et al. (2022). While the hippocampus displays a high theta to delta ratio during REM sleep (and not during non-REM sleep; almost by definition) (Montgomery et al., 2008; Mizuseki and Miyawaki, 2017; Girardeau and Lopes-Dos-Santos, 2021), Torres-Herraez et al. (2022) found high cerebellar delta (< 4 Hz) in either sleep state, although delta power was often higher during non-REM (especially in lobule VI). Very high frequency oscillations (∼250 Hz), across all cerebellar regions (Crus I, lobule VI, lobule II/III) and all behavioral states examined, were also noted, though they were greatest during sleep states (with non-REM greater than REM) and in lobule II/III (Figure 3F). Hippocampal-cerebellar delta coherence profiles during REM sleep largely mirrored those seen in wake (described above), but there was an increase delta coherence with the hippocampus during non-REM sleep, especially between the hippocampus and lobule VI (Figures 3F, G). Theta coherence, in contrast to delta coherence, showed little region to region variability across states (also somewhat in contrast to the locomotor analysis above), but did show state-dependence, with REM sleep typically showing the highest levels of cerebellar-hippocampal theta coherence (Figures 3F, G).
Torres-Herraez et al. (2022) also describe cerebellar phasic sharp potentials (PSPs) (Figure 3H). These high amplitude (∼2.3 standard deviations from baseline), brief (∼130 ms duration) events often occurred simultaneously across cerebellar brain regions. Cerebellar PSPs occurred in clusters during REM sleep (interevent interval < 1s) and were less frequent and more distributed (less clustery) during non-REM sleep. Cerebellar PSPs showed strong phase locking to the peak of cerebellar REM delta oscillations, and less strong but still prominent phase locking to the trough of hippocampal REM theta oscillations (Figure 3H). This illustrates a coordination of both oscillations (e.g., delta and theta) and short events (i.e., cerebellar PSPs to hippocampal theta) across brain regions.
Conversely, hippocampal sharp-wave ripples (in non-REM sleep) were phase locked to cerebellar delta waves (Figure 3I; Torres-Herraez et al., 2022), indicating that fine-grained coordination between the cerebellum and the hippocampus occurs in both directions. Moreover, when cerebellar PSPs occurred during non-REM sleep, hippocampal sharp-wave ripples were suppressed ∼90 ms later (for about 1 s), regardless of where the cerebellar PSP was recorded (Figure 3J). This suggests a possible cerebellar influence on the hippocampus (or a reflection in both structures of some other unifying phenomenon) during sleep. Collectively, these data also fit with, and extend in important new directions, recent work suggesting cerebellar influences on sleep spindles (Xu et al., 2021) and sleep-wake transitions (Zhang et al., 2020).
When hippocampal sharp-wave ripples did occur, short latency (∼10 ms for lobule VI; ∼30 ms for the other locations) LFP responses were noted in all recorded cerebellar locations (Torres-Herraez et al., 2022), suggesting hippocampal influence on the cerebellum in sleep and again highlighting the bidirectional nature of hippobellum interactions (Figure 3K). Additionally, an increase in the probability of hippocampal sharp-wave ripples was noted 100 ms prior to cerebellar PSPs (Figure 3J), potentially indicating that hippocampal sharp-wave ripples can promote cerebellar PSPs, somewhat akin to ripple-spindle coupling with the cerebral cortex (Siapas and Wilson, 1998).
While we have discussed the cerebellum as an area sometimes showing coherence with hippocampal oscillations and examples of both structures appearing to influence oscillations in the other region, it is important to note that a different line of thinking considers the cerebellum at the top, as a supervisor of oscillations across brain regions (Popa et al., 2013; Lindeman et al., 2021; McAfee et al., 2022). This need not be exclusive of the cerebellum having other direct impacts on the hippocampus, nor would it exclude the possibility for the hippocampus to influence the cerebellum. The concept of the cerebellum as an oscillation coordinator applies to other regions besides just the hippocampus, but we will focus on it here in the context of the hippobellum. The cerebellum may be important in the coordination of activity in the hippocampus with activity in other brain areas, including the medial prefrontal cortex (mPFC). For example, McAfee et al. found that cerebellar Purkinje cells’ firing could represent not only the phase of oscillations in the hippocampus (Figure 3D) (and the mPFC), but also the phase differences between the hippocampus and the mPFC (McAfee et al., 2019). Interestingly, some regional differences in these representations were noted across the cerebellum. Specifically, simplex neurons showed significant representation of mPFC and CA1 phases for delta and gamma frequencies, but in Crus I this only occurred for delta frequencies. However, a somewhat different profile was observed for representation of phase differences between mPFC and CA1. Theta was the most heavily represented frequency range in the simplex, but delta, beta, and low and high gamma were also represented. Crus I also captured most of the spectrum (including delta, theta, beta, and low gamma) (McAfee et al., 2019). It is interesting that within the simplex, differences in theta phase between the mPFC and CA1 were the most heavily represented, as these recordings were done in head-fixed (presumed awake) animals at rest – and therefore likely during relatively low theta states. It would be interesting to see how the power of theta in either the mPFC or hippocampus would impact the representation of phase differences within the cerebellum, or as seen for other measures discussed above, how it might change across tasks, brain states, and learning paradigms.
Taken together, these studies illustrate that the cerebellum and the hippocampus show coherent oscillatory activity across different tasks and brain states, and this coordinated activity may be important for task performance. The cerebellum may additionally monitor (and potentially influence) phase differences between the hippocampus and other structures, such as the mPFC, providing another avenue for hippobellum interactions.
When timing is of the essenceAppropriate timing is critical for classical cerebellar functions (Ivry et al., 2002; O’Reilly et al., 2008; Cheron et al., 2016), and in some circumstances, the hippocampus may provide critical support to the cerebellum for such purposes. Much the way hippocampal “place cells” encode location and spatial trajectories (Hartley et al., 2014; Chao et al., 2020a), hippocampal “time cells” are believed to encode temporal components (reviewed in Eichenbaum, 2014; Banquet et al., 2021). This hippocampal ability may come into play in trace eyeblink conditioning, and other forms of time-predictive motor responses that also involve the cerebellum.
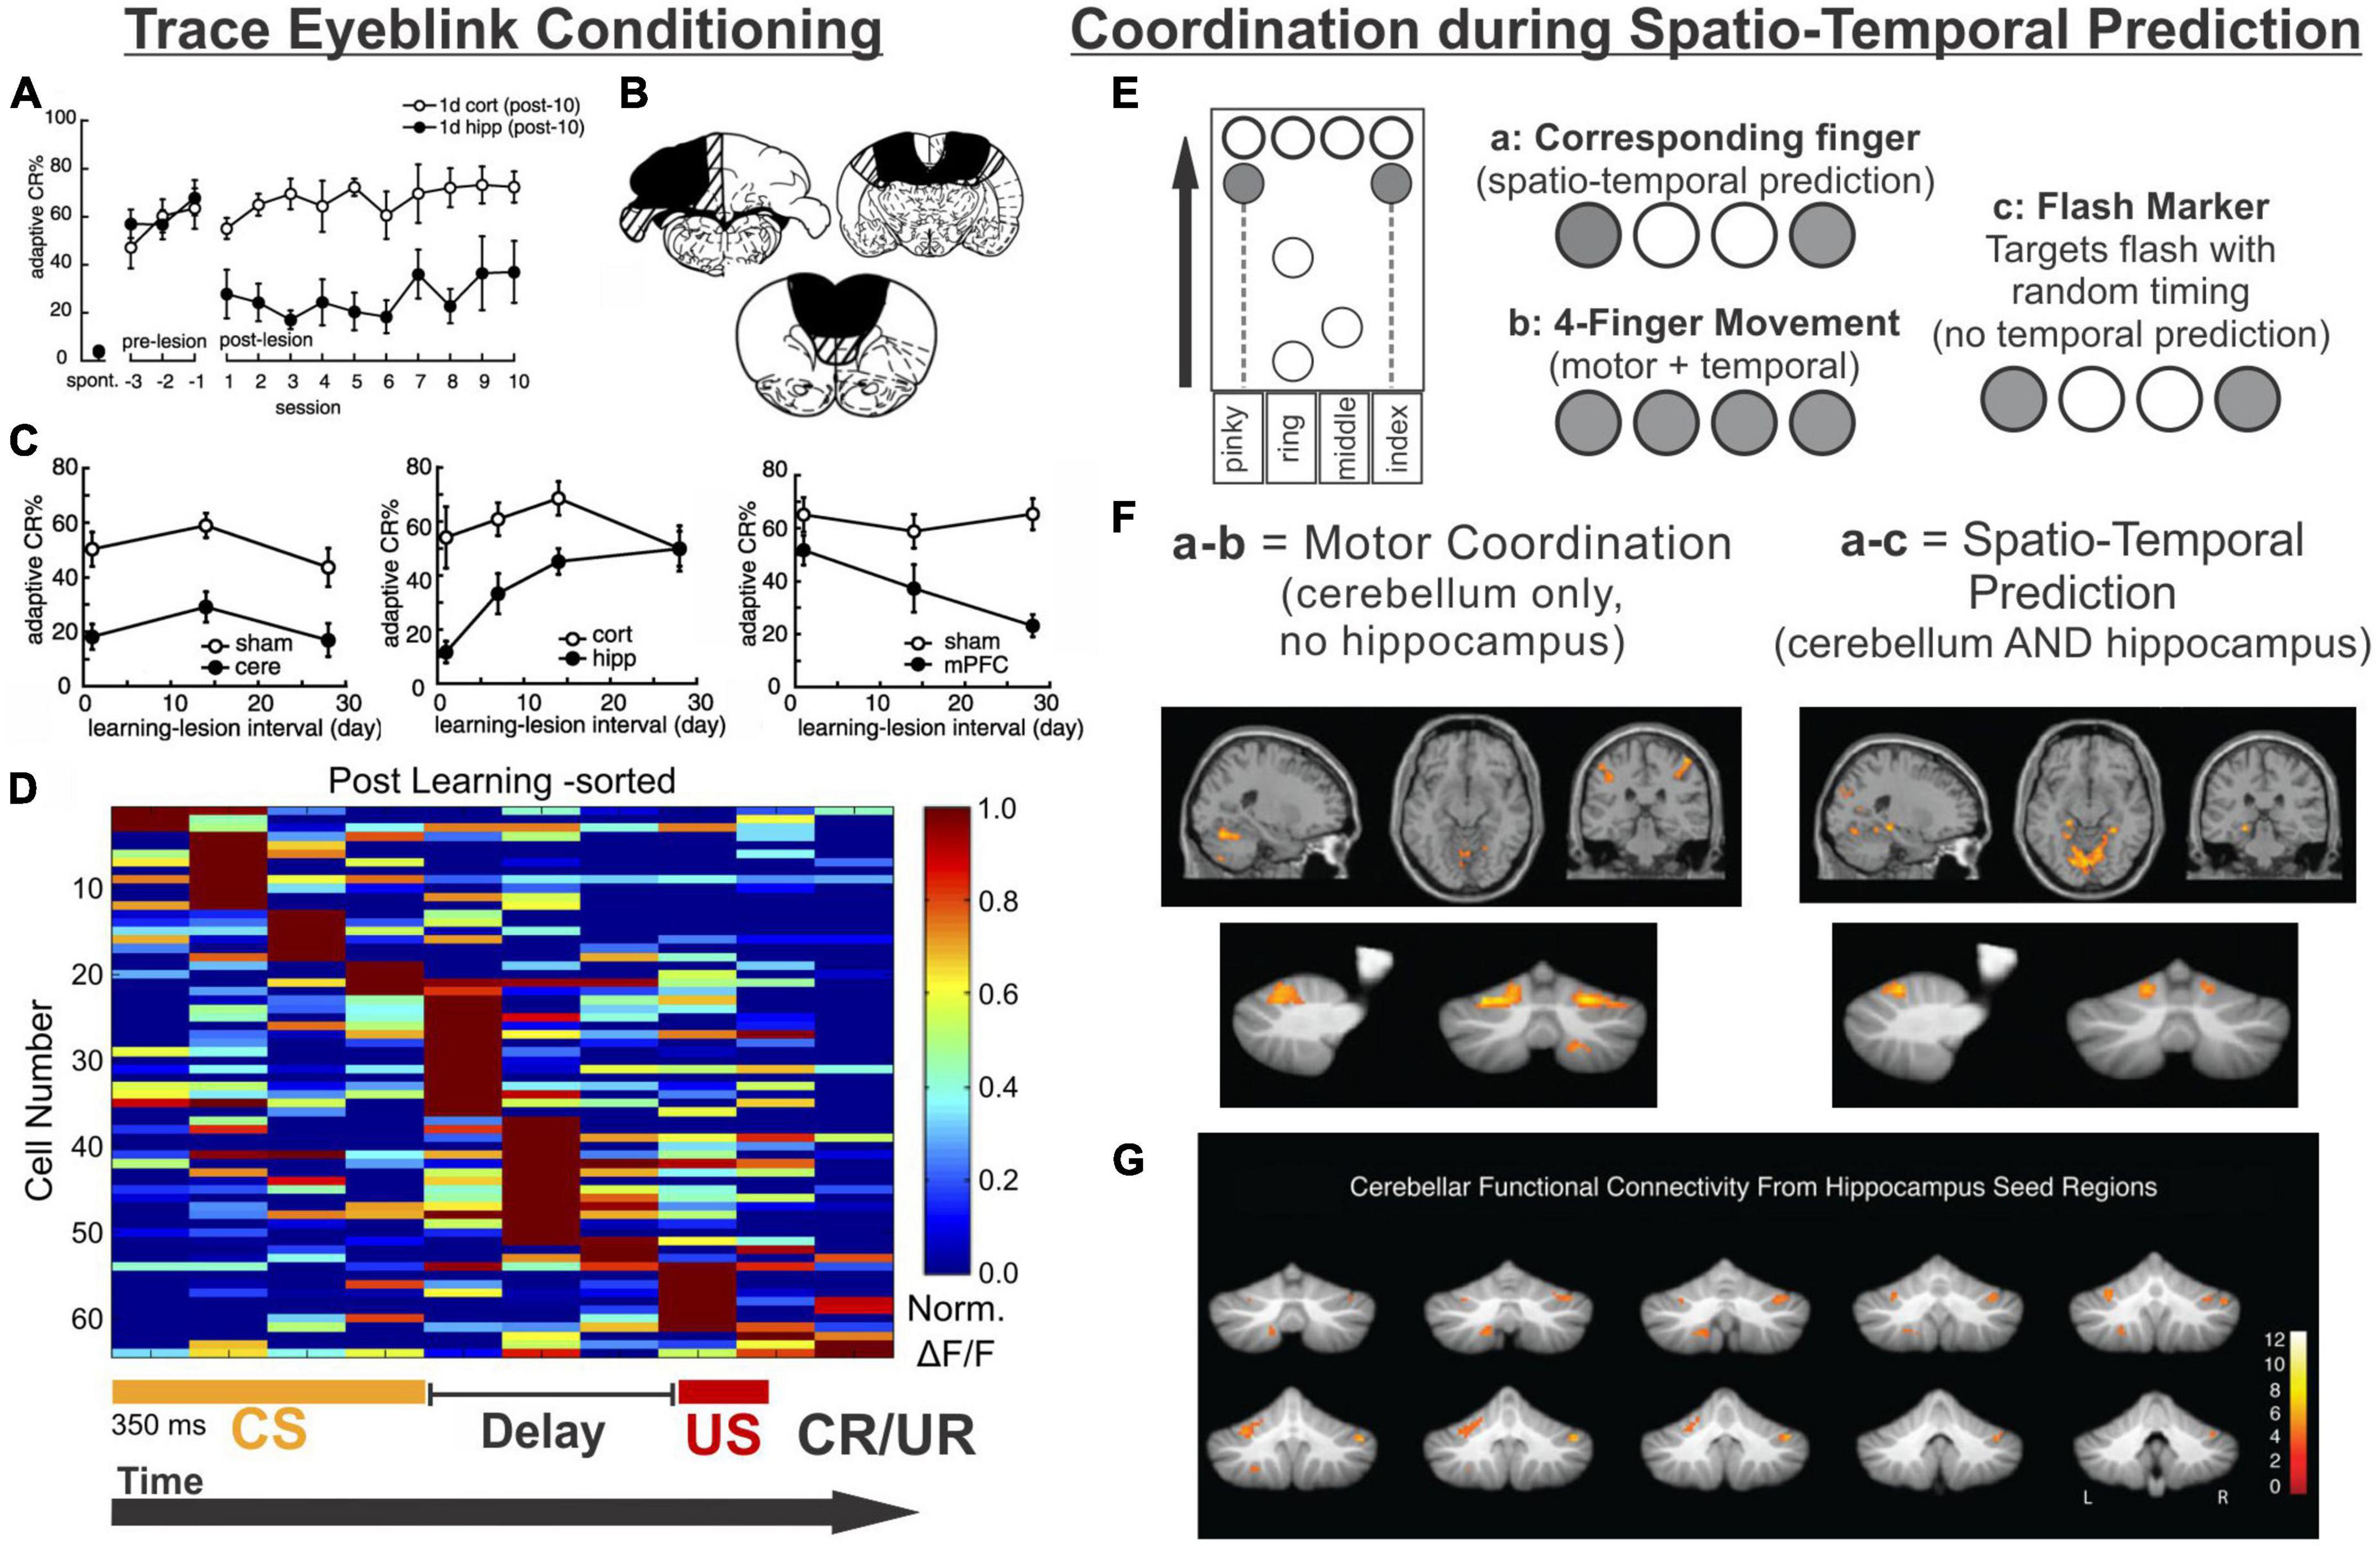
As recently reviewed by Takehara-Nishiuchi (2018), there are several variations of eyeblink conditioning, and all of them require an intact, functioning cerebellum (McCormick and Thompson, 1984; Woodruff-Pak et al., 1985; Weible et al., 2000; Takehara et al., 2003). Classical conditioning typically has an air puff (unconditioned stimulus [US]) delivered to the eyelid, which then results in a reflexive blink. In following trials, the air puff is preceded by a visual or auditory cue (conditioned stimulus [CS]). The US co-terminates with the CS in the standard version of this task, and after enough pairings, the conditioned stimulus alone will result in a blink (conditioned response [CR]). Trace eyeblink conditioning is a task variation in which a stimulus-free gap (i.e., the trace period) is introduced between the conditioned and unconditioned stimulus, making a successful association of the CS and US take more trials (Sears and Steinmetz, 1990; Clark and Squire, 1998; Tseng et al., 2004; Walker and Steinmetz, 2008). Interestingly, the introduction of this delay, which generally ranges between 250 ms and 1,000 ms (depending on species) (Woodruff-Pak and Disterhoft, 2008), converts the task into one which relies on the hippocampus to learn: impaired hippocampal function impairs the acquisition of trace eyeblink conditioning (Solomon et al., 1986; Moyer et al., 1990; Kim et al., 1995; Clark and Squire, 1998; Weiss et al., 1999; Takehara et al., 2002, 2003; Weiss and Disterhoft, 2015). Several studies have shown that when the hippocampus is lesioned shortly after learning (e.g., a day or a week), performance is also impaired (Figures 4A–C; Kim et al., 1995; Takehara et al., 2002, 2003). In contrast, performance further after initial learning – as the memory becomes remote – relies more on neocortical structures like the mPFC (Figure 4C; Takehara et al., 2003; Takehara-Nishiuchi, 2018).
Figure 4. The hippocampus may help the cerebellum parse time. (A–D) Trace eyeblink conditioning is a task that requires coordination between the cerebellum (cere) and the hippocampus (hipp) for successful task performance. (A) Lesions to the hippocampus made one day after learning a conditioned response impaired performance (closed black circles) compared with animals that received cortical lesions (open circles). (B) Example lesions of the cerebellum, prefrontal cortex, or hippocampus for the graphs in (C). (C) (left) Lesions to the cerebellum permanently disrupt performance, while lesions to the hippocampus prior to (not shown) or shortly after learning (middle) are detrimental. Lesions to the PFC (right) are more detrimental later after learning. (D) Calcium activity in hippocampal cells was imaged over the course of learning a trace eyeblink conditioning paradigm. Shown are activity patterns once the task is learned. Hippocampal cells tile the temporal space across both stimuli and the stimulus-free trace period (a function of “time cells”). These data suggest the hippocampus may be critical for trace eyeblink conditioning because it is providing temporal information to the cerebellum about when stimuli are occurring and when a response is necessary (E–G). The cerebellum and hippocampus also coordinate during finger-tapping task with a spatio-temporal prediction component (E). Subjects tapped 1 or 2 keys when the corresponding circles scrolled onto the targets at the top of the screen (condition a) or when the targets flashed (condition c). In the 4-finger condition (b), the participants tapped all 4 keys when any marker reached the target. (F) Subtracting the activity of the 4-finger movement condition from the corresponding finger condition allowed for extraction of regions associated with motor coordination (left) (and subtraction of temporal processing activity patterns). Conversely, subtracting the activity of the flash marker condition from the corresponding finger condition allowed for extraction of regions involved in temporal-prediction (right). The hippocampus and the cerebellum were coactivated when temporal prediction was necessary. (G) When a seed region in the left hippocampus was chosen for a functional connectivity analysis, lobule VI, lobule VIIIb, and R Crus I of the cerebellum were all functionally connected with the hippocampus. Data and schematics in (A-C) reproduced and modified for arrangement in this figure from Takehara et al. (2003) (Copyright 2003 Society for Neuroscience). Data in panel (D) reproduced from Modi et al. (2014) with minor labeling modifications under a CC-BY 3.0 license. Schematics in E based on (Onuki et al., 2015). Images in panels (F,G) were reproduced from parts of figures in Onuki et al. (2015) with permission from Oxford University Press. CS, conditioned stimulus; US, unconditioned stimulus; CR, conditioned response; UR, unconditioned response.
While hippocampal lesions only disrupt the learning of certain forms of eyeblink conditioning (including trace), hippocampal activity also reflects the conditioned stimulus in classical eyeblink conditioning (Berger et al., 1976; Patterson et al., 1979; Clark et al., 1984; Sears and Steinmetz, 1990; Ryou et al., 1998). This suggests a broader engagement of the hippocampus in eyeblink conditioning, even if obvious deficits are not always noted. For example, Clark et al. found that CA1 neurons displayed an increase in firing around the US early during classical conditioning, but with conditioning, this shifted to be during the CS, and this shift in firing paralleled the shift of the behavioral response (Clark et al., 1984). Interestingly, while hippocampal activity is not required for acquisition of classical eyeblink conditioning, such hippocampal activity during classical eyeblink conditioning does require the cerebellum. Specifically, lesion of the cerebellar interposed or dentate nucleus had a strong effect on the hippocampal responses to the CS, essentially abolishing them (Clark et al., 1984; but see also Sears and Steinmetz, 1990). This again highlights the bidirectional functional connectivity between the hippocampus and the cerebellum and supports a cognitive collaboration between the structures even during classical eyeblink conditioning.
Why is the hippocampus needed for trace eyeblink conditioning? One theory is the hippocampus may bridge the temporal gap of the trace interval (Hoffmann et al., 2015). More specifically, the hippocampus is likely providing key temporal information (i.e., specifically when the airpuff (US) will happen after the CS). As noted above, the hippocampus is able to encode timing of events via “time cells” (Manns et al., 2007; MacDonald et al., 2011), and this may be its key contribution to trace eyeblink conditioning. In seminal work by MacDonald and colleagues, rats had to pair an object with one of two odors after a 10 s delay, and cells in CA1 preferentially represented particular time windows in the delay period (MacDonald et al., 2011). The entire time window of the delay was represented fully by tiling of these “time cells” in the hippocampus, allowing for a temporal coding of the object presentation and the odor presentation.
A number of studies examining hippocampal activity during trace eyeblink conditioning support the idea that the hippocampus is providing temporal support to the cerebellum during the task (Solomon et al., 1986; Weiss et al., 1996; McEchron and Disterhoft, 1999; Weible et al., 2006; Green and Arenos, 2007; Modi et al., 2014). One notable study by Modi and colleagues used two-photon calcium imaging to examine hippocampal activity during the training of trace eyeblink conditioning (Modi et al., 2014). Some cells were highly active during the CS, some were highly active during the delay, and some were highly active during the US (Modi et al., 2014). Importantly, during the trace period, populations of neurons showed time-specific firing (i.e., were “time cells”), and together represented the entire trace period (Figure 4D). This is very similar to the tiling of time noted in the object-odor pairing task described above (MacDonald et al., 2011). Two more recent studies have provided information also about the activity and role of hippocampal inhibitory interneurons during trace eyeblink conditioning – hippocampal interneurons actively increased their firing rates during the CS and the US (Zhang et al., 2021; Li et al., 2022), and inhibition of broad (Zhang et al., 2021) or specific (Li et al., 2022) interneuron populations disrupted task acquisition. Taken together, these studies suggest that hippocampal time cells may bridge the temporal gap between the CS and US (during acquisition) and illustrate that the importance of inhibition to proper hippocampal functioning should not be ignored. The need for the hippocampus during acquisition of trace eyeblink conditioning suggests that this temporal processing across the trace gap cannot be achieved by the cerebellum without the hippocampus.
The role of the hippocampus for associating two (relatively) distant-in-time stimuli is supported in other types of associative learning as well, including fear conditioning, which is also impaired by hippocampal damage (Marchand et al., 2004). It has also been shown that the hippocampus can play a more general role in forming associations, including environmental context, during eyeblink conditioning (Penick and Solomom, 1991; Takehara-Nishiuchi, 2018). More broadly, the hippocampus is associated with episodic memories (recently reviewed in Eichenbaum, 2017; Chao et al., 2020a), and it has been suggested that hippocampal-supported conscious awareness of the association between the US and CS is key to trace eyeblink conditioning (reviewed in Clark et al., 2002). This may relate to increased learning during attentional theta states (Berry and Thompson, 1979; Seager et al., 2002; Nokia et al., 2008). Ultimately, the hippocampus likely encodes several aspects of eyeblink conditioning and may be supporting the cerebellum in its execution of the eyeblink response through multiple mechanisms.
In trace eyeblink conditioning, it appears that the hippocampus provides, among other things, critical task-related temporal support to the cerebellum. The hippocampus providing predictive timing support to the cerebellum occurs in other circumstances as well, as illustrated by an fMRI study by Van der Werf and colleagues in which participants performed several finger-tapping tasks (Onuki et al., 2015). The finger-tapping tasks varied in task demands, allowing for contrasts to examine activation associated with specific task components (Figure 4E). Three task variations are particularly relevant to this discussion. In one (‘flash marker’), participants pressed buttons when targets flashed. This version had a finger-selection/spatial component (as the location of the flash indicated which fingers to press), but no timing-prediction component (as the inter-flash intervals were varied and could not be predicted). In another version of the task (‘4-finger movement’), markers scrolled across the screen, and subjects pressed all four fingers whenever any of the markers reached the target. It therefore had a timing-prediction component (as one can predict when the markers will reach the targets based on scrolling speed), but no finger-selection component. The third version (‘corresponding finger’) required pressing the appropriate keys (one or two fingers) when the associated markers reached their targets, and thus had both a finger-coordination and a timing-prediction component.
When the ‘4-finger movement’ condition was subtracted from the ‘corresponding finger condition’, the cerebellum but not the hippocampus showed activation. This supports that the cerebellum is relevant for the finger selection task component (i.e., motor coordination). Note that both of these conditions have the temporal-prediction component, and thus activation associated with that aspect of the task would be subtracted out. In contrast, subtracting activation during the “flash marker” condition from the “corresponding finger” condition removed activation associated with the finger selection component of the task and highlighted areas selectively activated by the temporal prediction component. This contrast revealed coactivation of the cerebellum (in particular lobule VI) and the hippocampus (Figure 4F; Onuki et al., 2015). Functional connectivity analysis using the left hippocampus as a seed region further supported task-related hippocampal connectivity with the cerebellum, including in lobule VI and Crus I (Figure 4G; Onuki et al., 2015). Therefore, in both trace eyeblink conditioning and a finger tapping task, the hippocampus is engaged and likely providing key when information for the cerebellum.
Time is not the final frontier: Hippobellum in spatial processingThe hippocampus certainly play
留言 (0)