
記住我


We collected buccal mucosa samples from AP (n = 6, age 79–93 years old) and non-AP (Control; n = 6, age 66–93 years old) patients. Three samples (AP#3, AP#5, and AP#6) were collected from the patients with Parkinson’s disease, three (AP#2, AP#4, and Control#1) from those with Alzheimer's disease, and two (Control#2 and Control#6) with Lacunar infarction. The duration from the onset to the collection time varied from 1 to 18 days (Additional file 1: Table S1). Body mass index was low in the AP group (Table 1). No significant differences were observed in the blood for CRP concentration, several white blood cells, or serum albumin concentration. While there was no difference in the number of residual teeth, the OHAT score tended to be higher in the AP group, indicating an unhealthy oral state of the AP patients.
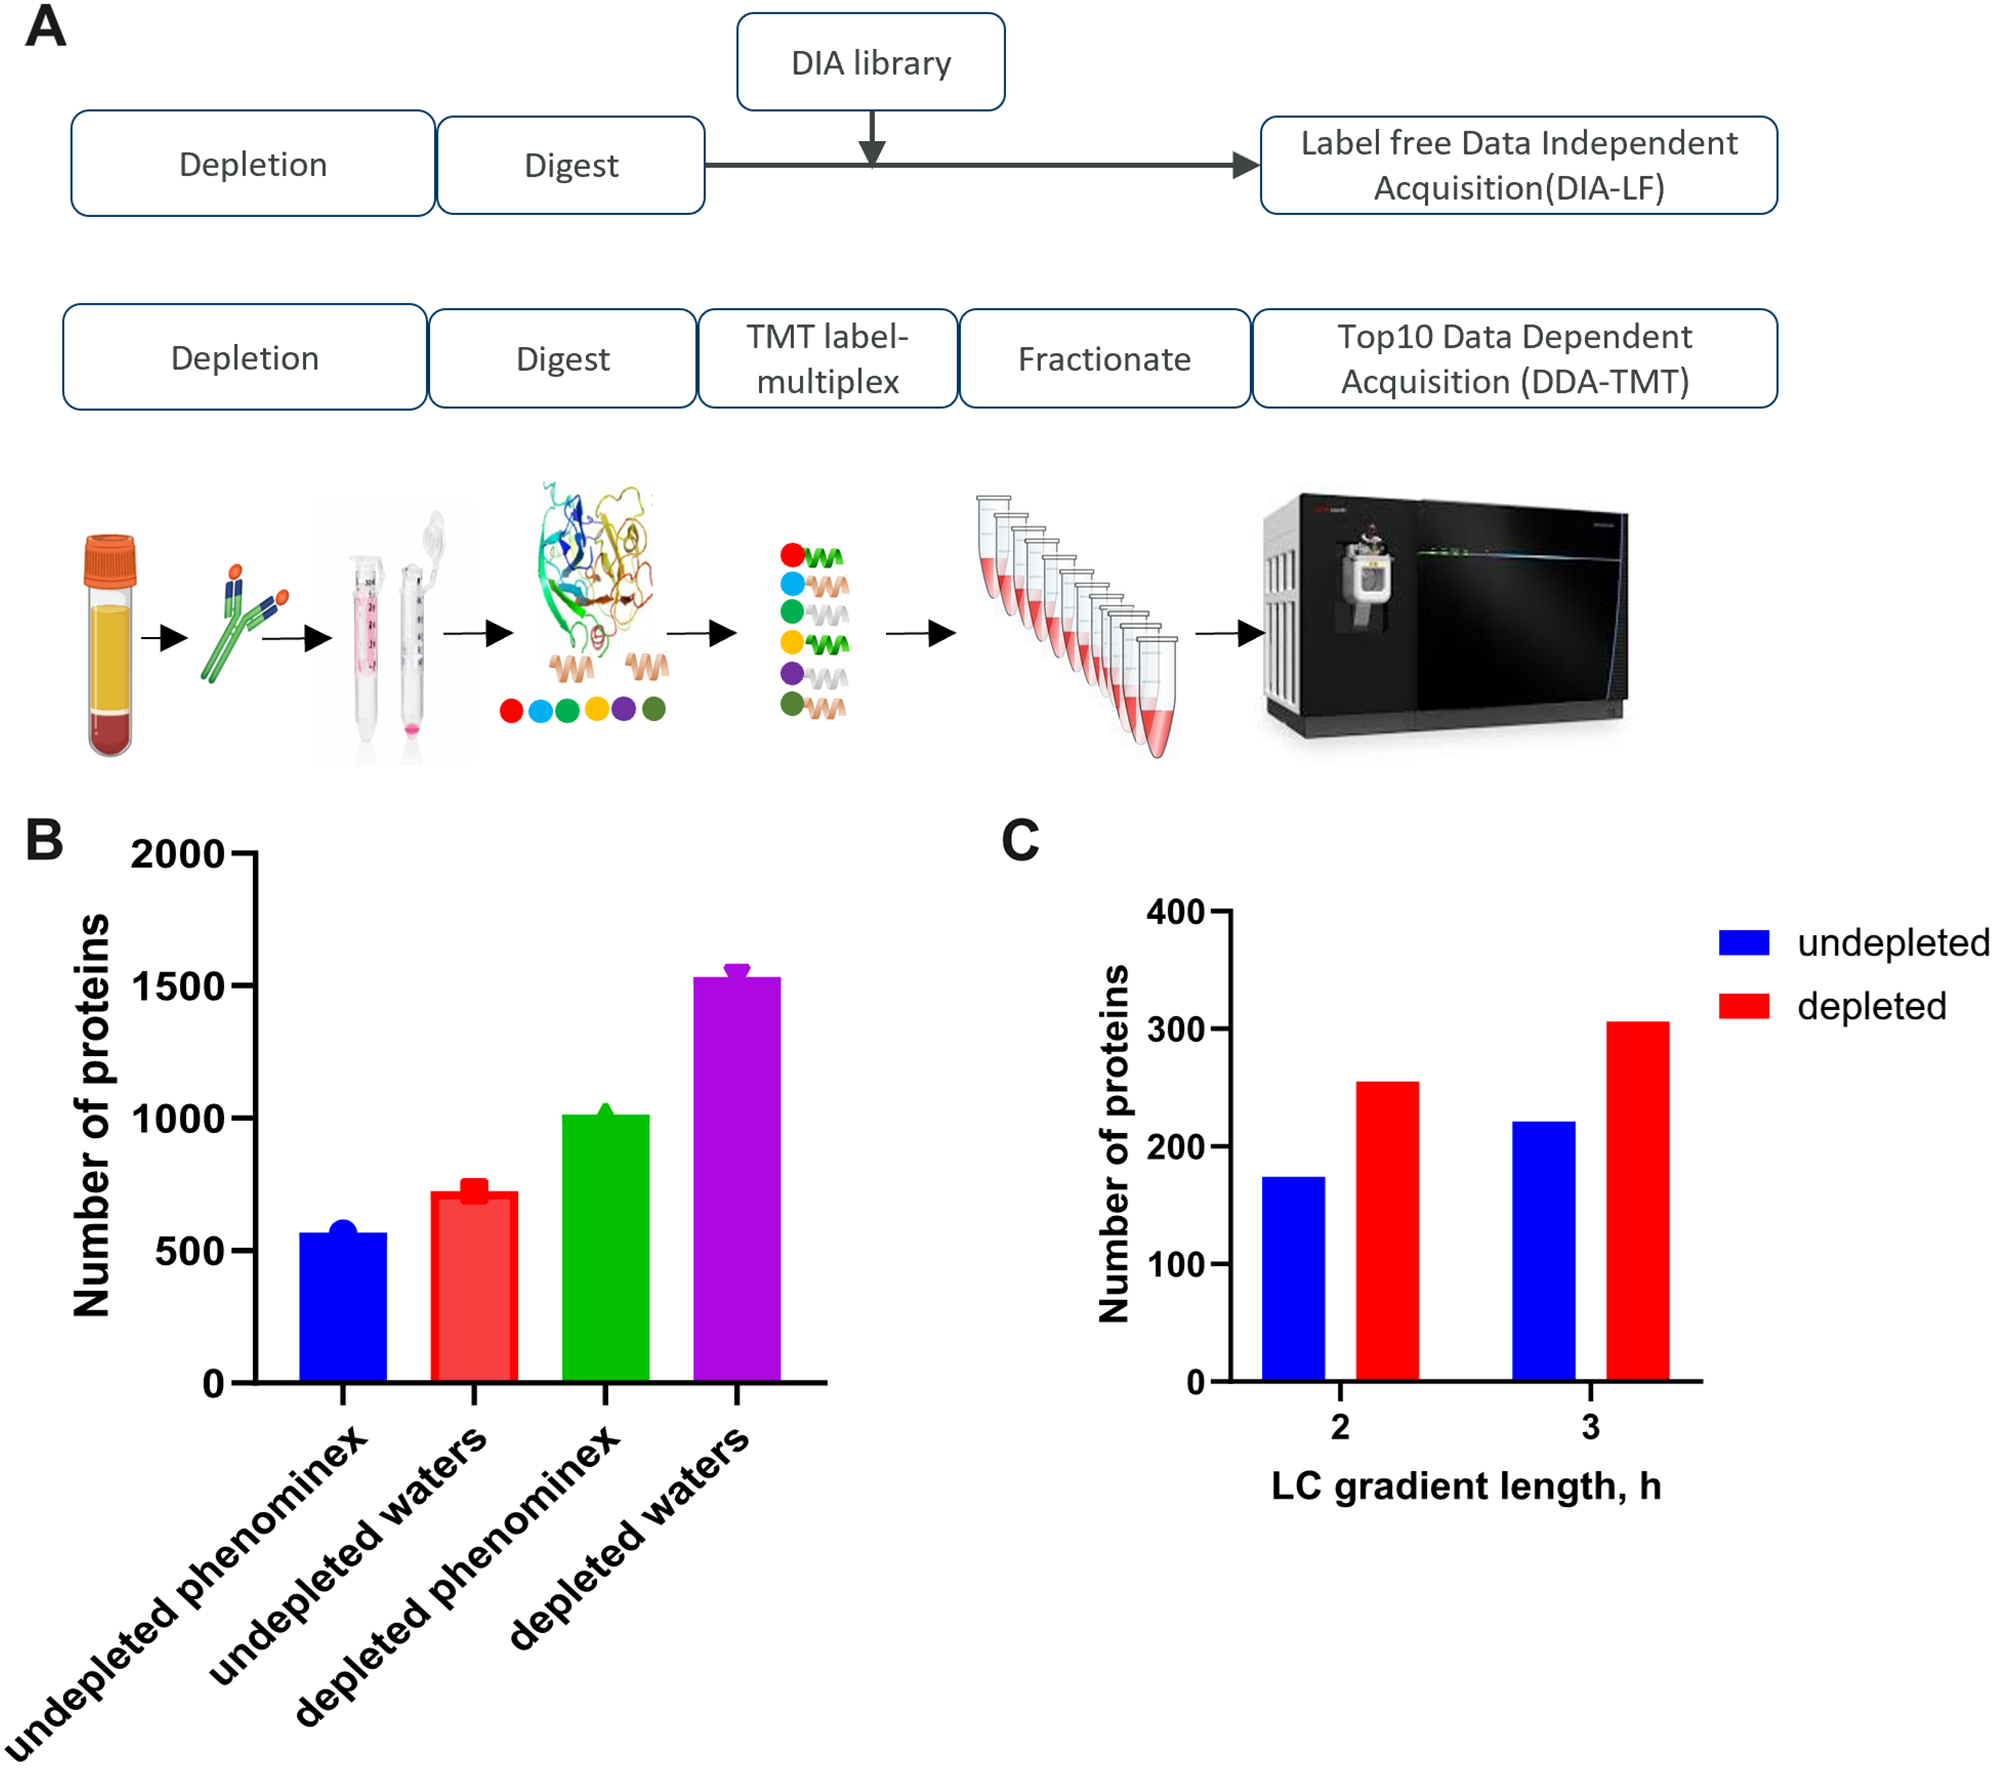
Comparative quantitative analysis of oral proteinsAfter TCA precipitation and acetone wash, protein solutions were obtained with concentrations ranging from 0.65 to 2.49 mg/mL. LC–MS/MS analysis detected 3,528 proteins including 3,253, 157, and 118 proteins at high- (q value < 0.01), middle- (0.01 < q value < 0.05), and low-confidence levels, respectively, based on their FDR (Additional file 2: Figure S1 and Additional file 1: Table S2). No significant difference was observed in the abundance distribution (Additional file 2: Figure S2). Principal component analysis (PCA) revealed that AP #4 was distinct from the other 11 samples; there was no significant difference in PCA profiles of the AP and control groups (Additional file 2: Figure S3). Although Proteome Discoverer software version 2.2, which applies the Minora nodes, is a powerful tool for label-free quantification [21], ANOVA adjusted using the Benjamini–Hochberg method, and not using nonparametric analysis such as Mann–Whitney U test, is available to calculate P values (Additional file 1: Table S2). In the present study, we compared the protein abundance obtained using the software. Among the 3253 proteins with high confidence, 638 had high coverage (> 50%); of those, 601 proteins were detected in all 12 samples. Then, we compared protein abundances of the 601 proteins between the AP and control groups. Abundance of 18 proteins, including aldo–keto reductase family 1 member B10, interleukin-36 receptor antagonist protein, and caspase-14, were significantly high in the AP group (P < 0.05 by Mann–Whitney U test) (Additional file 1: Table S3). Further, 37 proteins, including chloride intracellular channel protein 3, protein S100-A7A, and serpin B4, had high abundance in the AP group (0.1 > P ≥ 0.05 by Mann–Whitney U test; Additional file 1: Table S3). Next, we performed the gene ontology enrichment analysis on the proteins with significantly high abundance in the AP group [22, 23]. Significant results (P < 0.05 and FDR < 0.05) were observed for three processes: nitrobenzene metabolic process, peptide antigen assembly with MHC class I protein complex, and cellular detoxification of nitrogen compound.
Serum and oral C-reactive proteinOuellet-Morin et al. reported a moderate-to-strong association between CRP measured in saliva and serum (r = 0.72) [24]. In the present study, there was no significant difference in CRP concentration either in the blood (P = 0.16) or oral cavity (P = 0.71) between the AP and control groups. Nonetheless, Spearman's correlation coefficient was 0.86 (P = 0.001) between blood and oral CRP levels, indicating that serum CRP may be predicted non-invasively using oral CRP values, which is consistent with the previous report [24] (Fig. 1). It is unclear why the abundance of oral CRP was relatively high in Control #3.
Fig. 1
Correlation between serum and oral CRP levels (Spearman's rank correlation coefficient)
Detected proteinsAs shown in Additional file 1: Table S1, the time between the day of onset and collection ranged from 1 to 18 days. Next, we examined the correlation between the time from onset (Additional file 1: Table S1) and abundance of the proteins in the AP group (Additional file 1: Table S2). Among the 55 highly expressed proteins (P < 0.10 by Mann–Whitney U test) in the AP group, negative correlation was shown by 4 proteins, viz., protein S100-A7A (Uniprot ID, Q86SG5), eukaryotic translation initiation factor 1 (P41567), serpin B4 (P48594), and peptidoglycan recognition protein 1 (O75594) (P < 0.10 by Spearman’s test; Table 2 and Fig. 2).
Table 2 Proteins with higher abundance between the AP and control groupsFig. 2
Four proteins expressed at high levels in the AP samples. The proteins detected in all 12 samples are listed in Table 2. The protein abundance between the six AP and six control samples (A–D) and the correlation between time post-onset and protein abundance in the six AP samples (E–H) are shown
S100 protein familyThe S100 proteins, a family of calcium-binding cytosolic proteins, are known as damage-associated molecular pattern molecules and they exhibit a variety of intracellular and extracellular functions [25]. Protein S100A-7A (Ratio (AP/Control) = 6.51 by Proteins Discoverer software version 2.2) was higher (P = 0.065 by Mann–Whitney U test) in the AP group; however, there was no difference in the levels of other S100 protein family members.
Cytokines and chemokinesThe LC–MS/MS detected some interleukins (ILs), however, there was no difference in IL-1α, IL-8, or IL-18 levels between the groups. The IL-36 cytokines, which include IL-36α, IL-36β, IL-36γ and IL-36Ra, belong to the IL-1 family and exert pro-inflammatory effects on various target cells, such as keratinocytes, synoviocytes, dendritic cells, and T cells [26]. Ramadas et al. showed that IL-36γ is upregulated in airway epithelial cells and involved in chemokine (neutrophil chemoattractants CXCL1 and CXCL2) production and neutrophil influx in mice challenged with a house dust mite extract [27]. In contrast, the abundance of the IL-36 receptor antagonist protein was significantly higher in AP samples compared with the control samples (P = 0.041). Our data suggest that various IL-36-related signaling pathways are involved in the onset of AP.
Non-salivary proteinsIn the Human Body Fluid Proteome database, 2,871 proteins have been registered as saliva proteins as of May 2022 [28], and 1,973 of the 3,528 proteins detected in the present study were registered as salivary proteins in the database. Of the 1,555 non-salivary proteins, 130 were in high abundance in the AP group, whereas only six were detected with > 20% coverage. Mago Nashi Homolog 2 (Magoh2) was detected in five of the six AP samples (coverage = 39%), but not in any of the Control samples. Although Magoh proteins contribute to exon junction complexes [29], it is unclear whether the Magoh2 protein is involved in the onset of AP.
Multiplex cytokine assayIn our shotgun proteomics analysis, we did not detect peaks for IL-1β, IL-6, TNF-α, or MCP-1 (Additional file 1: Table S2). In the multiplex cytokine/chemokine assay, the values for IL-6 and TNF-α were under the limit of detection (IL-6, < 6.80 pg/mL; TNF-α, < 0.73 pg/mL) in most of the oral samples. Using the supernatant without TCA precipitation, we also conducted a multiplex cytokine/chemokine assay. The protein concentrations of the supernatant ranged from 0.012 to 0.27 mg/mL, which were likely dependent on the strength of rubbing. Among the 13 cytokine and chemokine proteins, IL-1β, MCP-1, IL-8, and IL-18 were detected in all 12 samples. The concentrations were normalized to the total protein concentration. There were no significant differences between the AP and control groups, although MCP-1 levels tended to be lower (P = 0.065 by Mann–Whitney U test; Fig. 3).
Fig. 3
Results of the multiplex cytokines/chemokines assay. P values were calculated by the Mann–Whitney U test
留言 (0)