


記住我


The majority of the visual data in the 2D histogram is concentrated along its main axis, so the 2D Kapur’s entropy is only computed for the n subsections on the center diagonal to make calculation simpler and more precise. As a result of the foregoing explanation, the 2D Kapur’s entropy is shown in the figure as Eq. (17). As a result, when the 2D Karpur’s entropy is taken into account as the objective function of MGACO, the threshold set that maximizes φ(s,t) is the optimal threshold set.
φ(s,t)=-∑i=0s1∑j=0t1PijP1lnPijP1-∑i=t1+1s2∑j=t1+1t2(17)
PijP2lnPijP2-∑i=sL-2+1sL-1∑j=tL-2+1tL-1PijPL-1lnPijPL-1
where
P1=∑i=0s1∑j=0t1Pij,P2=∑i=t1+1s2∑j=t1+1t2Pij,PL-1
=∑i=sL-2+1sL-1∑j=tL-2+1tL-1Pij.
4.3. The proposed MGACO-MIS methodThe main objective of threshold-based segmentation, an effective image segmentation approach, is to find an appropriate threshold set to distinguish the target from the background in a picture. The technique of identifying a threshold set in an image and using that set to split the image into several pieces is also defined as MIS. In order to achieve improved one-threshold image segmentation, Pun (1981) presented a maximum entropy-based thresholding approach that analyzes the histogram of a picture as a probability distribution and calculates the maximum entropy to establish an optimum threshold value. Later, Kapur et al. (1985) presented Kapur’s entropy, an easy-to-compute modified maximum entropy-based threshold segmentation technique that yields better segmentation results. The temporal complexity is O((L−M + 1)M−1) and it increases exponentially when the exhaustive approach is used to segment a picture with many layers of maximum entropy.
L is the grayscale range of the image, and M denotes the number of segmentation levels. Although 1D histogram-based segmentation is more common, a serious misclassification issue exposes the segmentation results to noise interference when the target only takes up a small portion of a picture. The conventional 2D histogram segmentation technique, based on the local mean, does not take into account certain precise information in an image, such as some points, lines, planes, etc. (Buades et al., 2005).
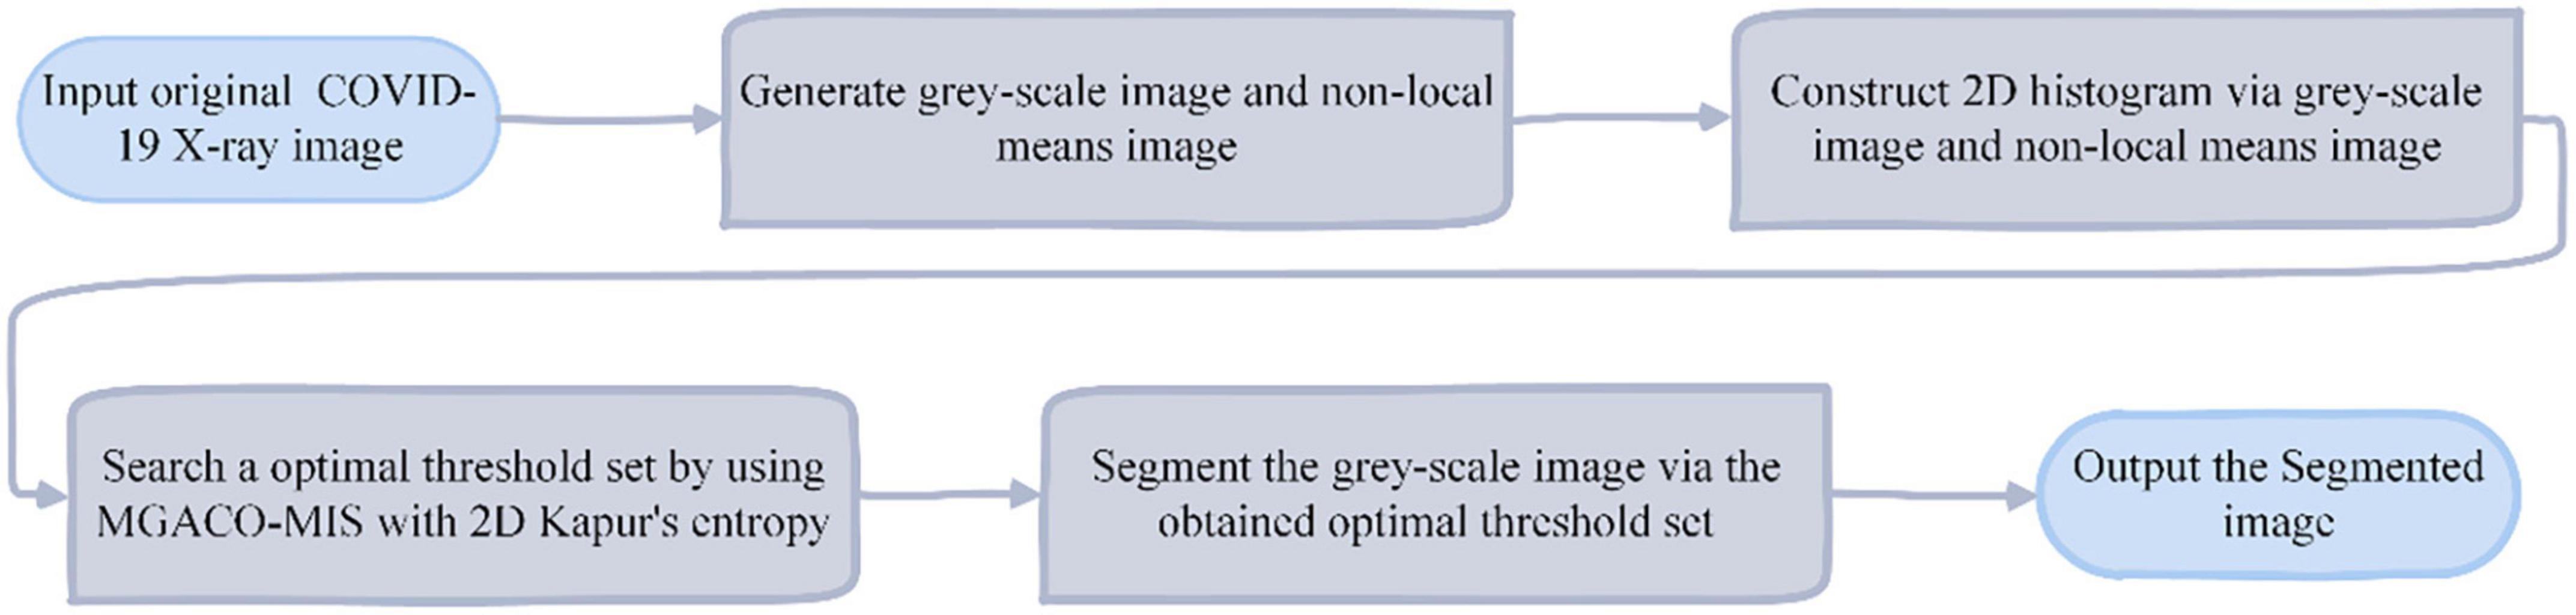
The suggested MIS approach is based on 2D histograms with non-local means and employs 2D Kapur’s entropy as the fitness function of MGACO to lessen the aforementioned constraints. Figure 5 gives a thorough description of it and is also used for the multi-level segmentation of COVID-19 X-ray pictures.
Figure 5. The flowchart of the MGACO-MIS method.
5. Experiments and resultsWe employ 30 benchmark functions from IEEE CEC2014 as our starting point to qualitatively assess MGACO and ACOR in great depth as well as compare MGACO with 10 conventional basic algorithms and 10 variations based on basic algorithms in order to illustrate these essential benefits of MGACO firmly. The acquired experimental findings show conclusively that MGACO has improved leap out of local optimum capability in addition to a certain speedup in convergence. In image processing tasks, it is vital to utilize a valid dataset covering various features and properties to assess the method sincerely (Jin et al., 2022). We also performed comparison studies between MGACO-MIS and eight other comparable segmentation algorithms at various threshold levels using genuine pathological photos of COVID-19 in order to show that MGACO-MIS can provide high-quality segmentation results while doing image segmentation. The acquired experimental findings adequately show that the suggested MGACO-MIS may provide high quality segmentation results while conducting image segmentation.
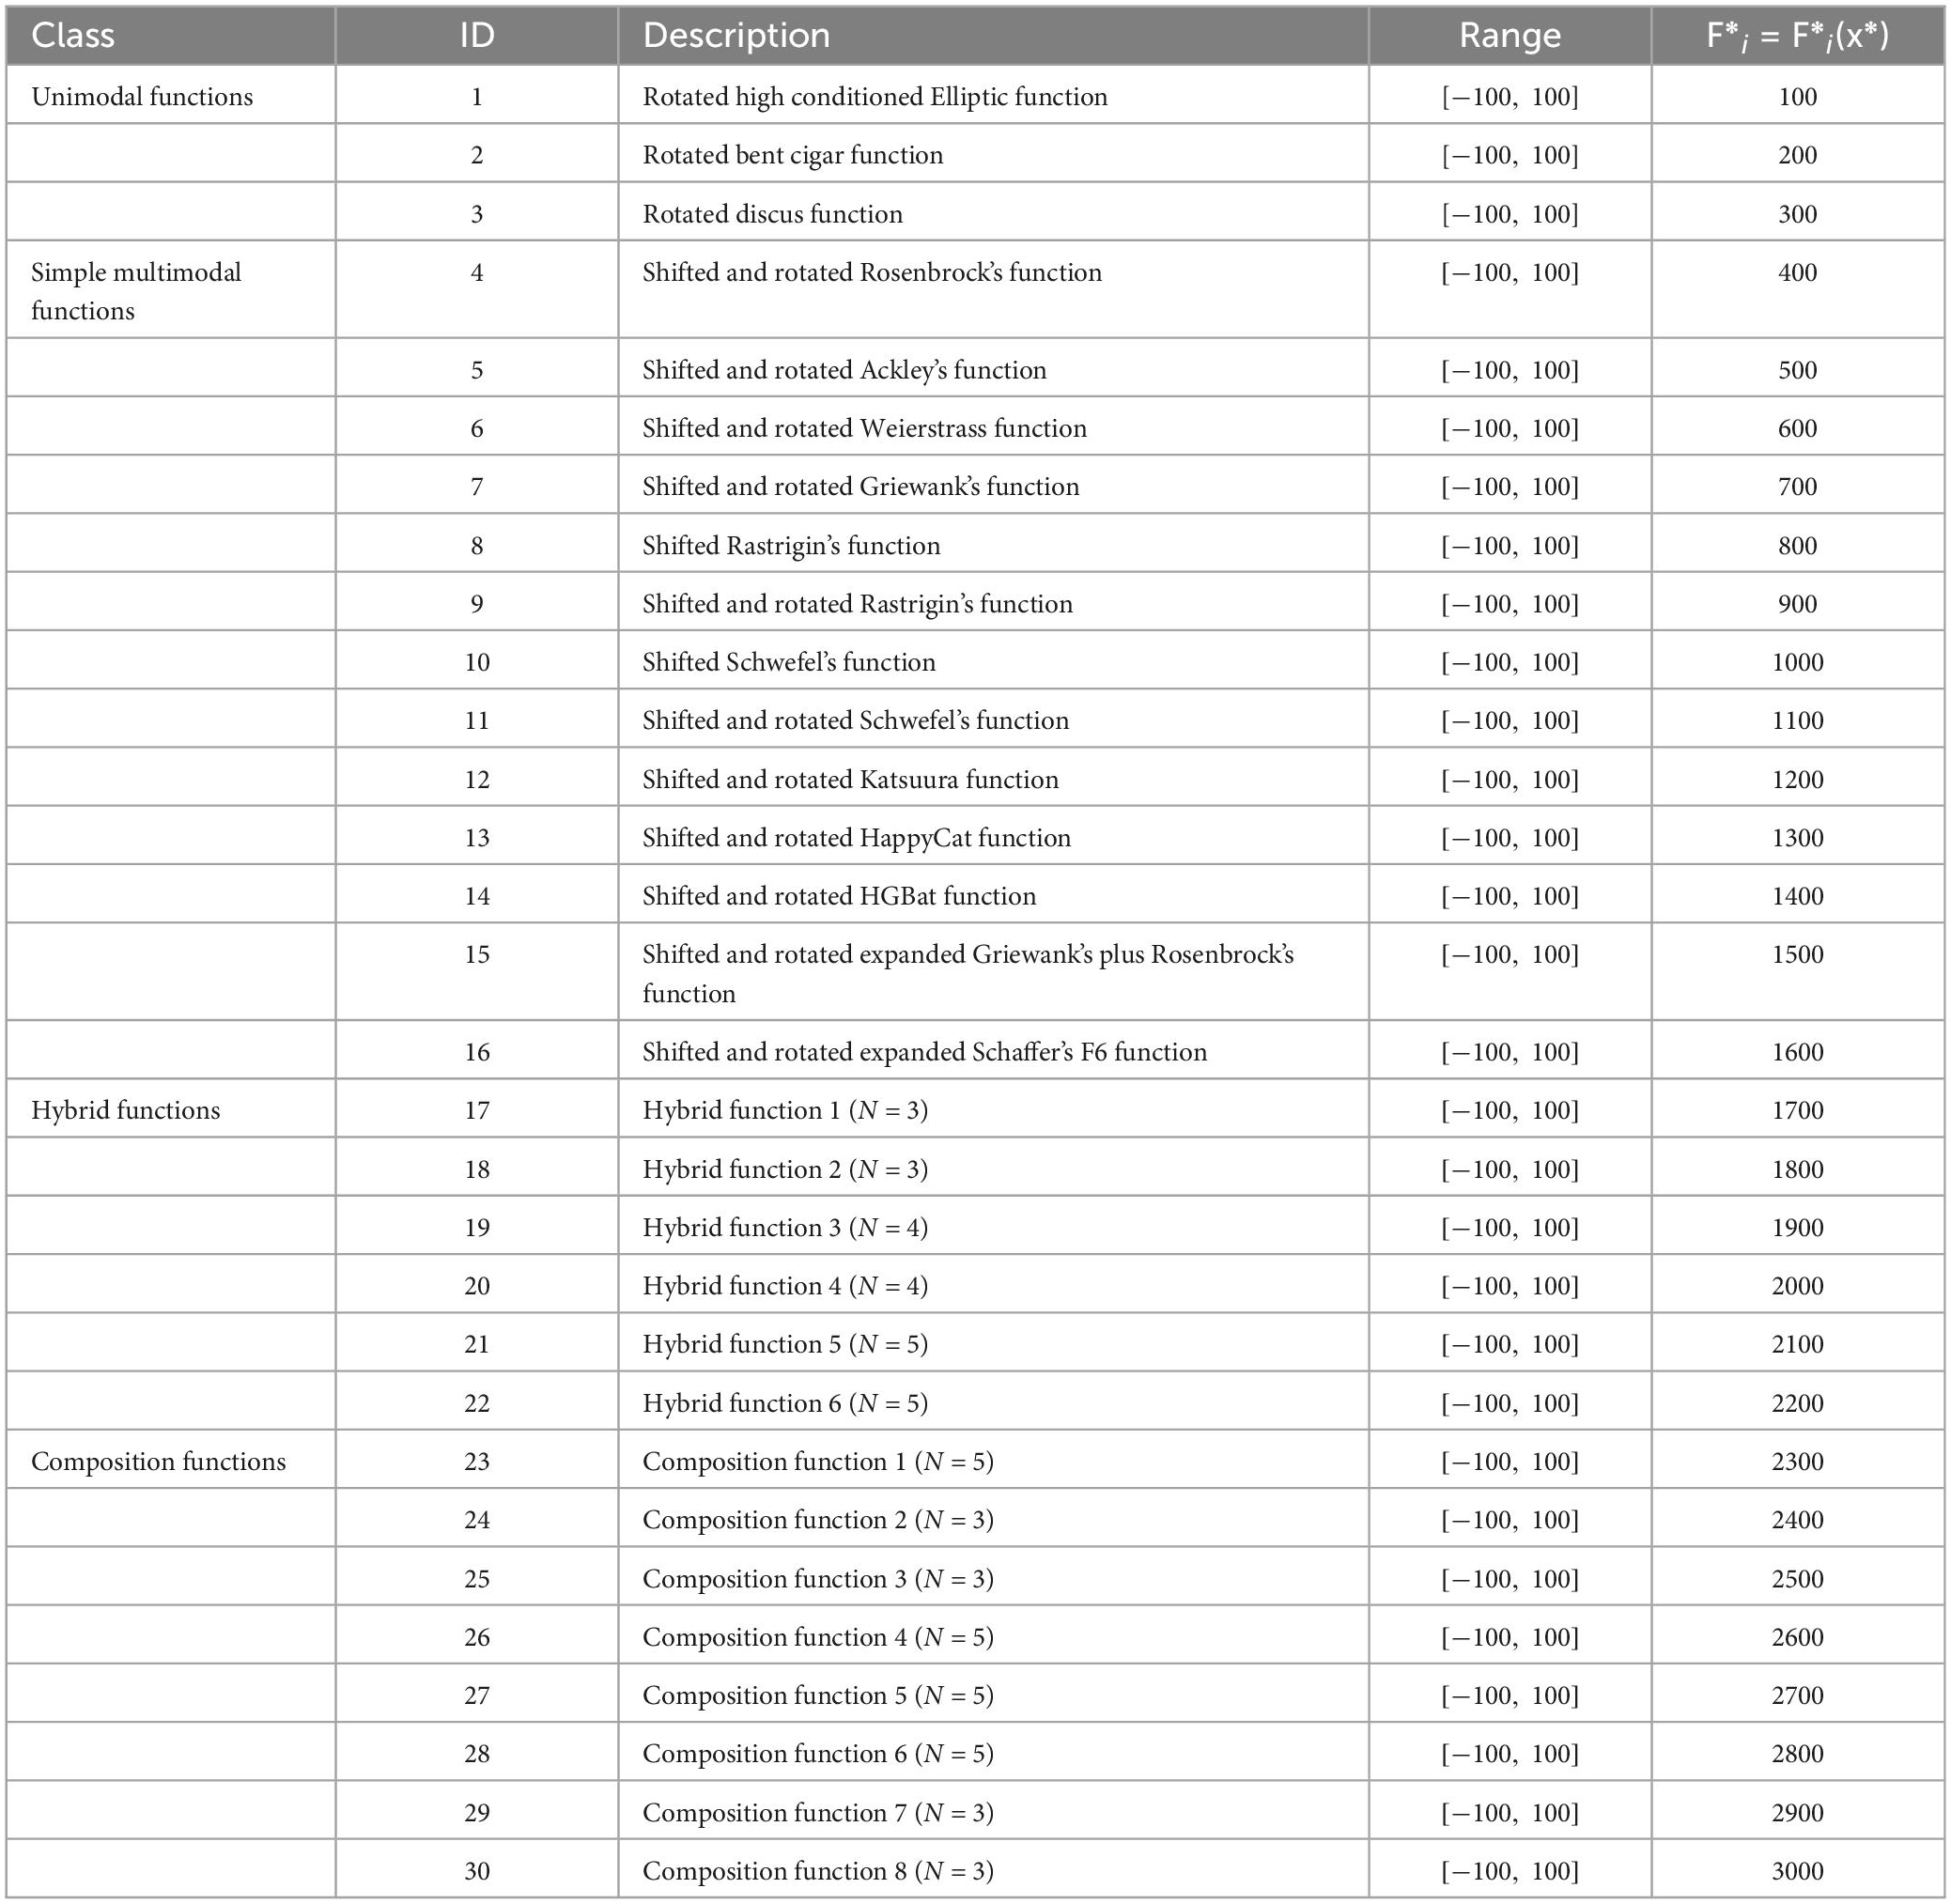
5.1. Experiment setupTo prove the core advantages of MGACO, we first conducted a strategy analysis experiment, followed by a scalability test of MGACO, and finally compared MGACO with some common basic algorithms and some variant algorithms in the experiment. In the strategy analysis experiments, various variants of ACOR were constructed using the new movement strategy and Cauchy-Gaussian fusion strategy, namely MACO, GACO, and MGACO, and comparative strategy combinations were used conducted. Then a directional analysis of MGACO was also performed, including a multi-angle, balanced, and diversity analysis. In the scalability experiments of MGACO, MGACO, and ACOR are compared in different dimensions, where the dimensions are set to 10, 20, 50, and 100, respectively. In the comparative experiments between MGACO and its peers, the comparison experiments were mainly conducted first between MGACO and 10 traditional basic algorithms involving MVO, ACOR, BA, DE, FA, GWO, MFO, PSO, SCA, WOA. Further, we compared MGACO with 10 very high-performance variants, including OBLGWO, OBSCA, RCACO, RCBA, ACWOA, BMWOA, CDLOBA, EWOA, HGWO, m_SCA. The benchmark functions used in the benchmark function experiments, which include unimodal, fundamental multimodal, hybrid, and composition functions, are shown in Table 1. The population size for each method in the comparison is 30, and the maximum number of evaluations is 300,000. All algorithms are performed under these identical settings. Doing this guarantees the validity and trustworthiness of the experimental results. To decrease the influence of chance events, each algorithm is also independently tested 30 times. Comprehensive statistics and analysis were performed using the mean, variance, Wilcoxon signed-rank test, and Friedman test for all experimental results on the benchmark functions. The results unambiguously demonstrate that MGACO not only shows some acceleration in convergence speed but also significantly increases its ability to diverge from the local optimum.
Table 1. The brief description of IEEE CEC2014.
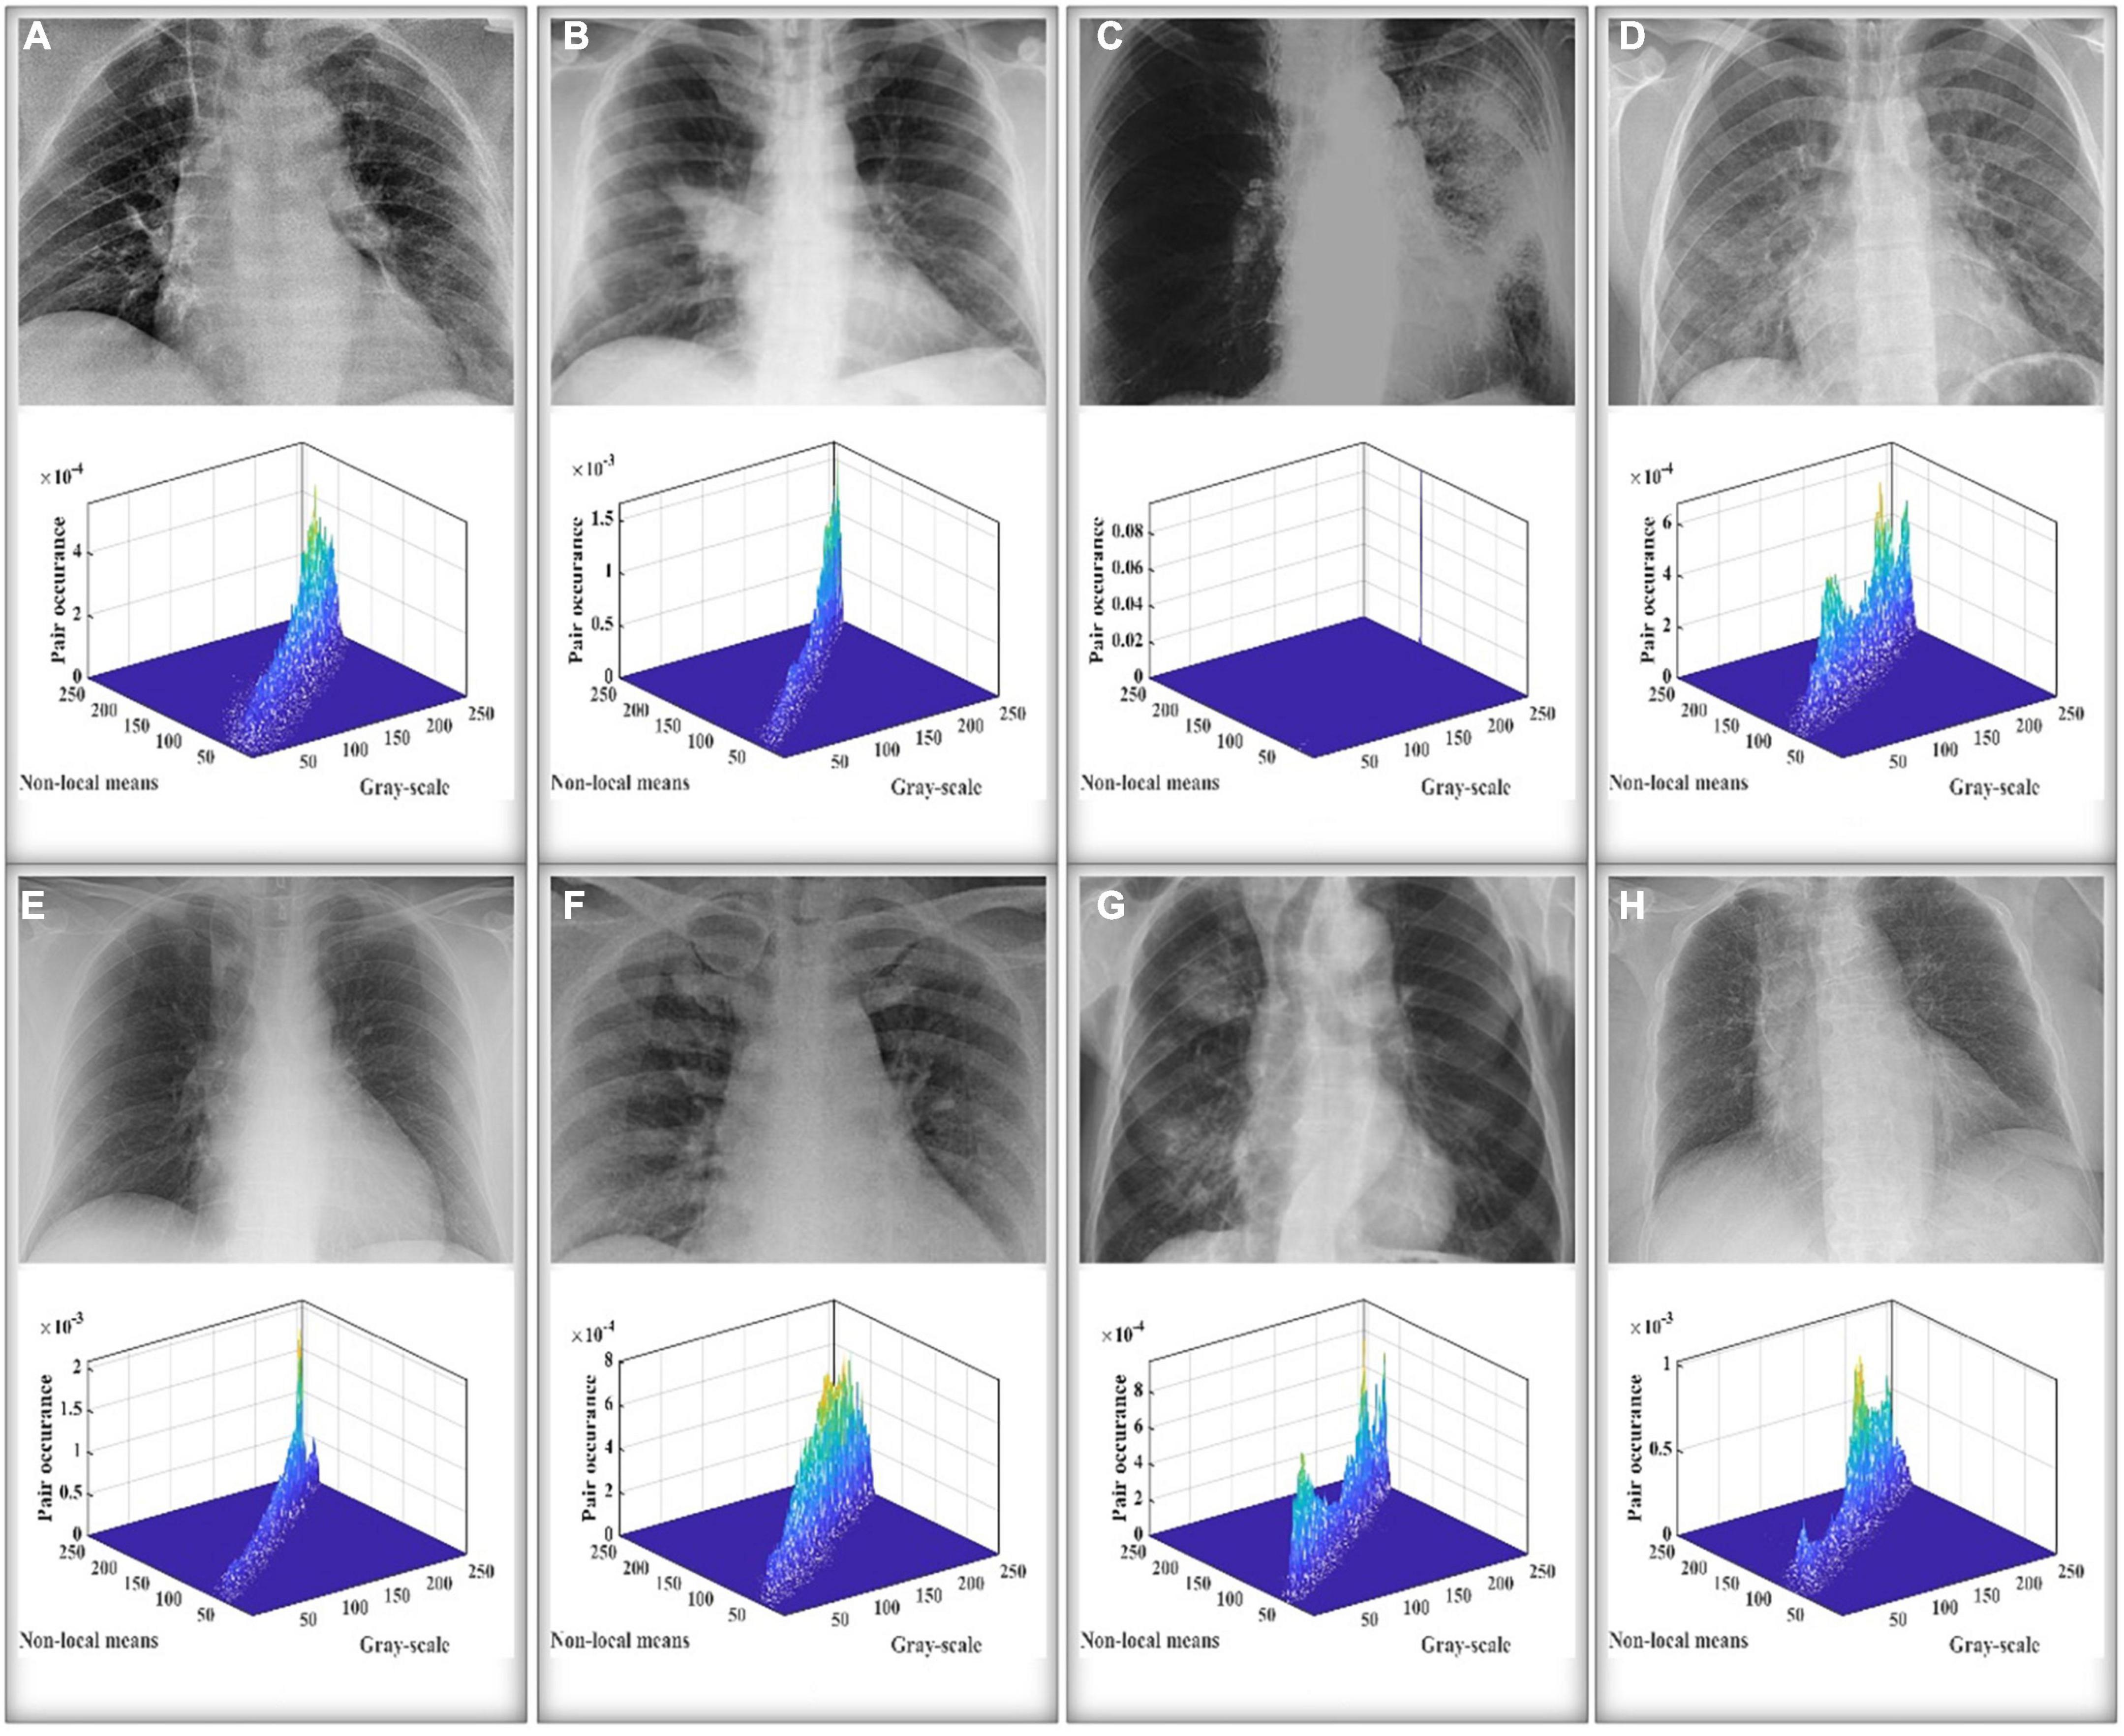
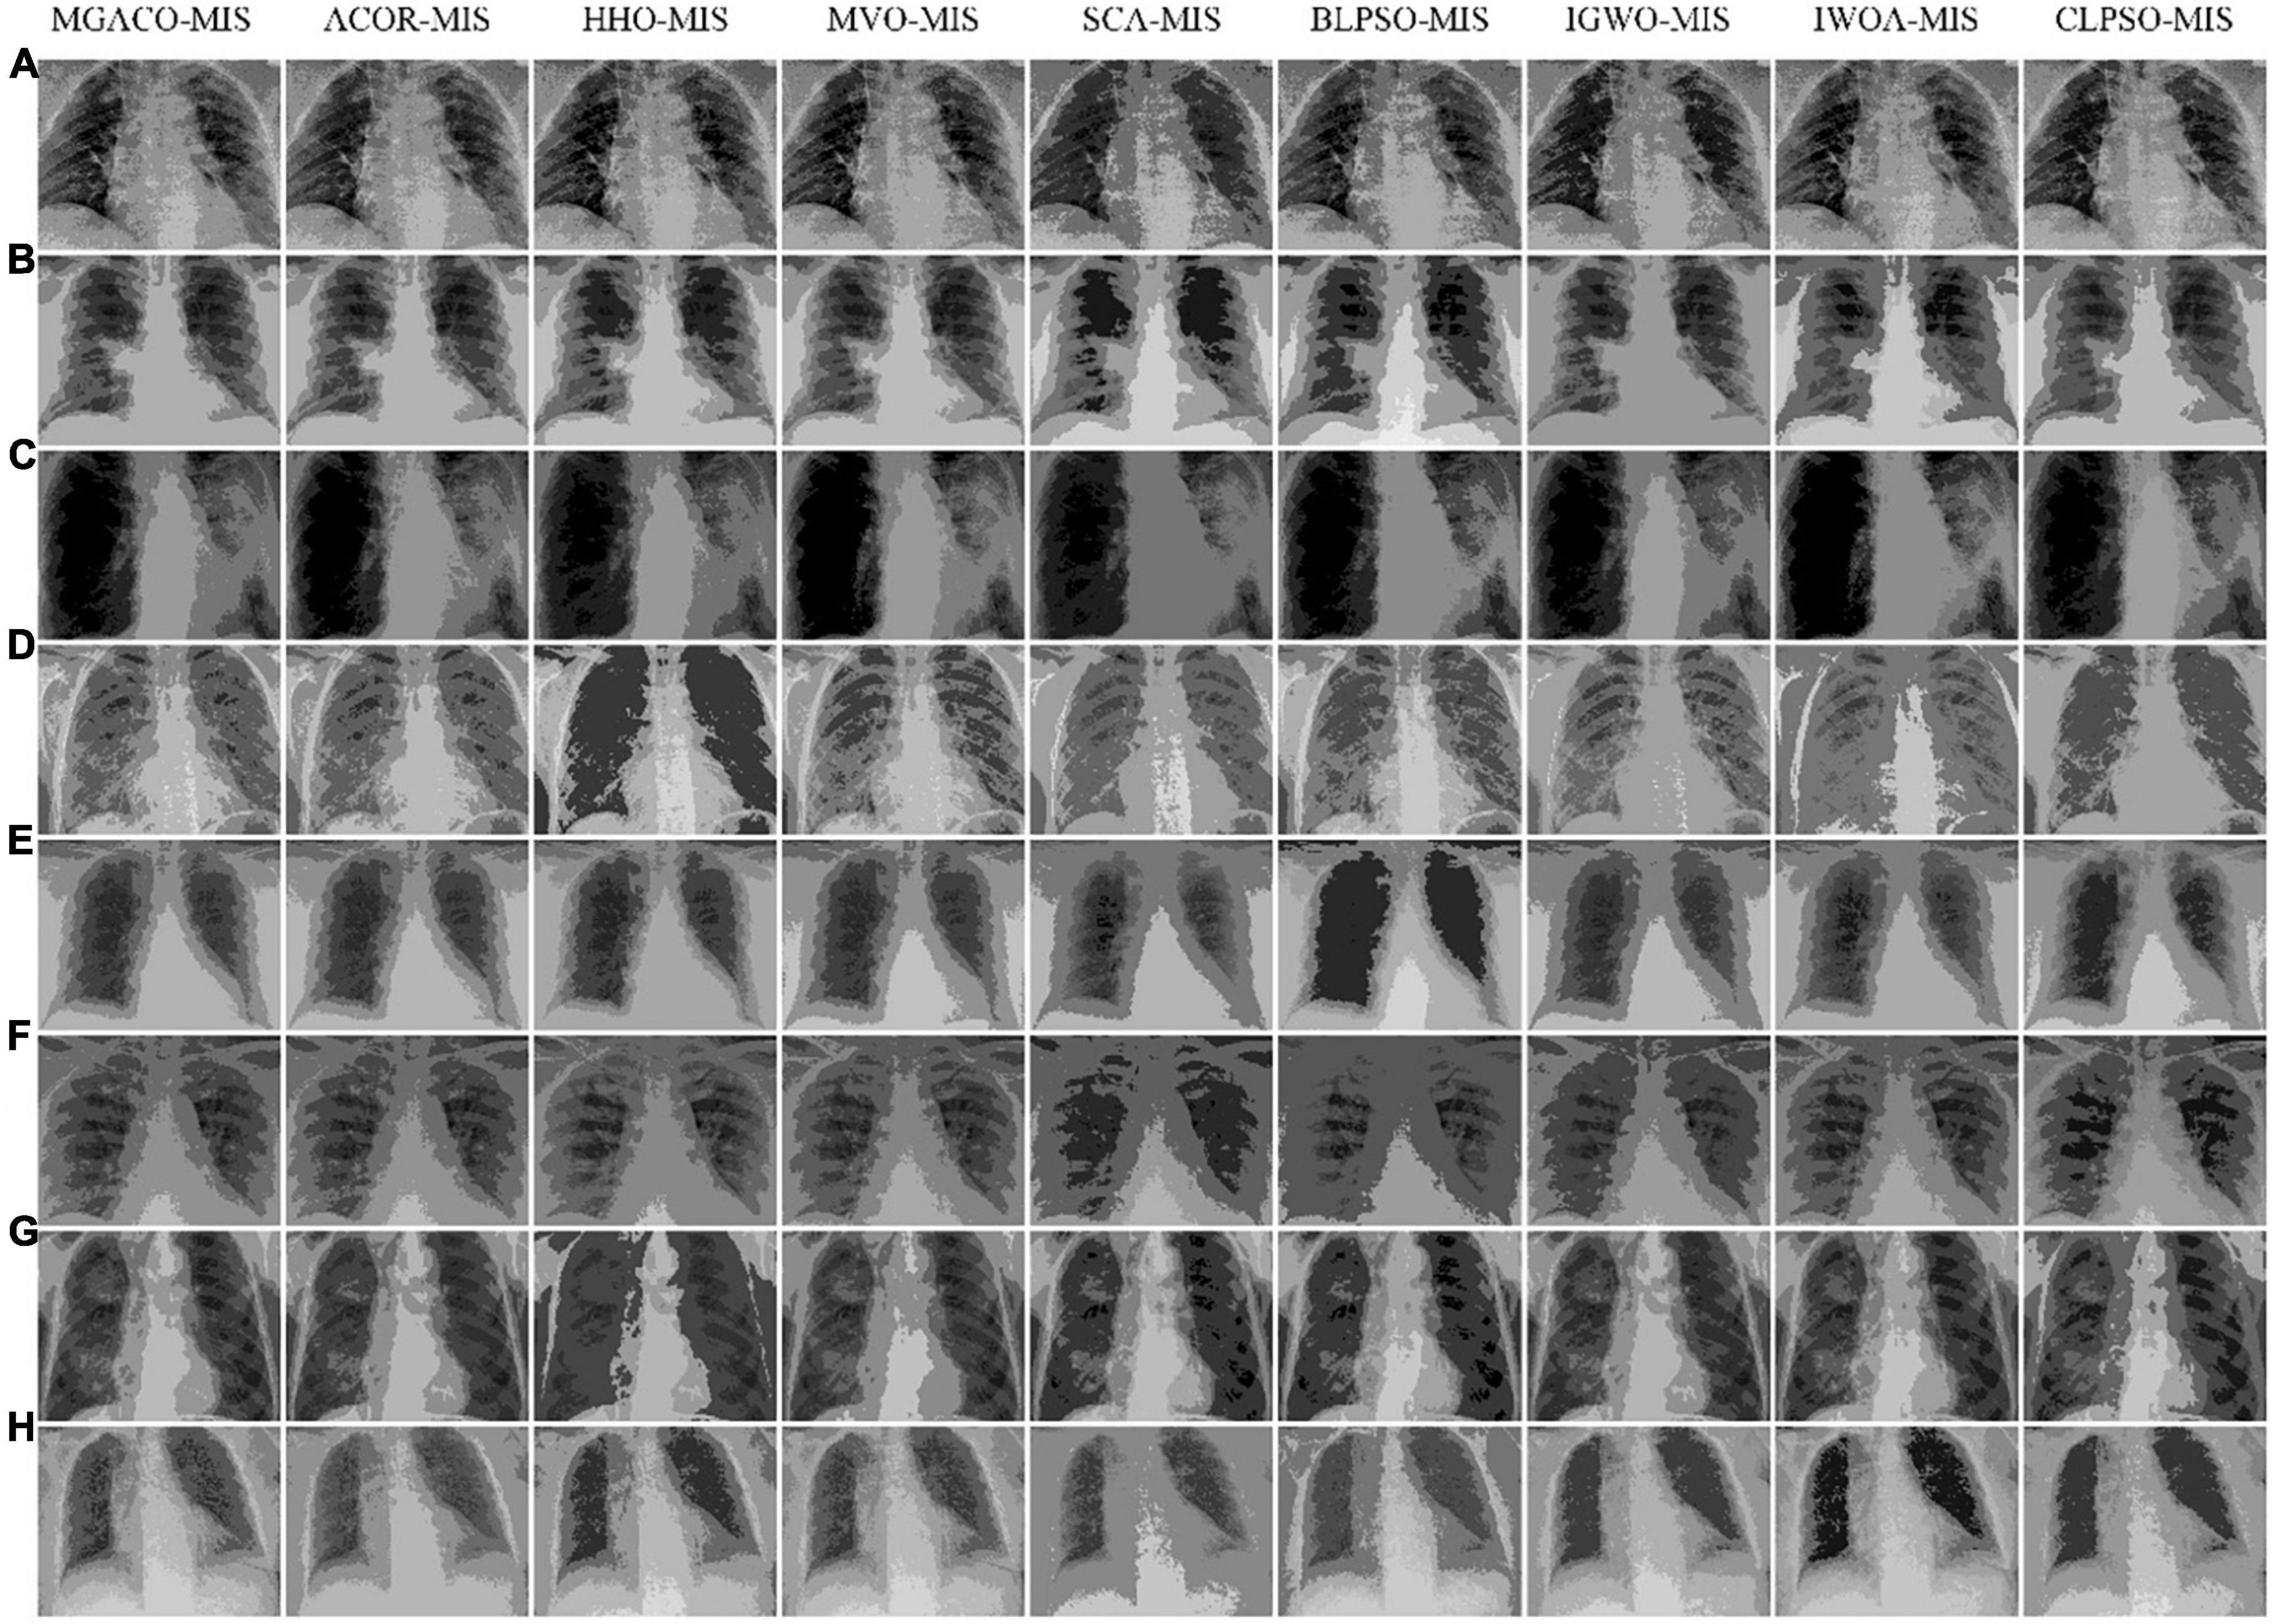
Then, to demonstrate that MGACO-MIS may provide improved segmentation results, we used X-ray images of 8 COVID-19 patients from a public database produced by Cohen et al. (2020). Segmentation experiments were first carried out to represent low threshold levels using MGACO-MIS and 8 other equivalent approaches at levels 4, 5, and 6. Second, to illustrate high threshold levels, we also ran segmentation trials at levels 15, 20, and 25. The letters A, B, C, D, E, F, G, and H in Figure 6 represent the X-ray images of the COVID-19 patients who participated in the segmentation investigations. These comparisons were conducted using the following methodologies: ACOR-MIS, MVO-MIS, HHO-MIS, SCA-MIS, BLPSO-MIS, IGWO-MIS, IWOA-MIS, and CLPSO-MIS. To guarantee fairness (Chen P. et al., 2022; Liu et al., 2022a,c; Yang et al., 2022), and the reliability of the findings, 100 iterations were used in each segmentation experiment. The population size for each segmentation technique included in the comparison was set to 20, the size of the selected segmentation pictures was set to 512 × 400, and each experiment was done 30 times separately to avoid randomization. We first evaluated the segmentation results using the three commonly used evaluation indices—PSNR, SSIM, and FSIM. Second, a detailed analysis of the assessment results was performed using the mean, variance, Wilcoxon signed-rank test, Friedman test, and other statistical techniques. The assessment and analysis results conclusively demonstrate that the suggested MGACO-MIS is suitable for producing outstanding segmentation results in image segmentation, which is the last but not least point.
Figure 6. The COVID-19 X-ray images used in the segmentation experiment.
5.2. Benchmark function validationIn this subsection, in order to demonstrate the core advantages of MGACO, firstly, a strategy analysis experiment is conducted; secondly, the scalability test of MGACO is conducted; and finally, MGACO is compared with some common basic algorithms and some variants of algorithms. All the results fully support that MGACO has a certain faster convergence rate and its ability to escape from the local optimum is significantly enhanced.
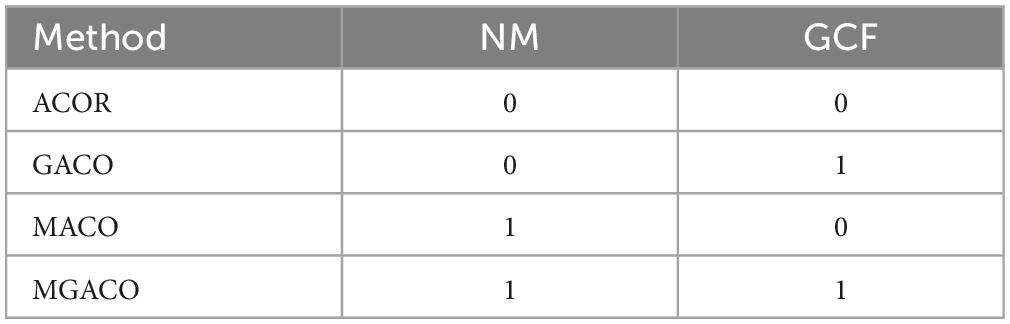
5.2.1. The impact of two novel enhanced strategiesThe new movement strategy and the Cauchy-Gaussian fusion strategy construct the four different variant algorithms of ACOR shown in Table 2, where “NM” denotes the new movement strategy, “GCF” denotes the Cauchy-Gaussian fusion strategy, “1” denotes that the strategy is included in the variant, and “0” denotes that the strategy is not included in the variant. This section first conducted comparative experiments using the four constructed variant algorithms, and its results fully demonstrate that the best performance is obtained only when both strategies are used for the MGACO variants formed in ACOR. The new movement strategy and the Cauchy-Gaussian fusion strategy construct the four different variant algorithms of ACOR shown in Table 2, where “NM” denotes the new movement strategy, “GCF” denotes the Gaussian fusion strategy, “1” denotes that the strategy is included in the variant, and “0” denotes that the strategy is not included in the variant. This section first conducted comparative experiments using the four constructed variant algorithms, and its results fully demonstrate that the best performance is obtained only when both strategies are used for the MGACO variants formed in ACOR. Then, this section continues to analyze MGACO and AOCR not only in multi-perspective but also in balance and diversity.
Table 2. The constructed four variants with two novel enhanced strategies.
Supplementary Table 1 contains the findings from testing the four variations on IEEE CEC2014, where “AVG” and “STD” stand for the mean and variance of the variants obtained after 30 separate runs, respectively. The terms “Mean” and “Rank” refer to ranking results based on the overall mean. The terms “+” and “-” refer to the number of functions where MGACO performs better than its peers, respectively, while “ = ” signifies the number of functions where MGACO performs equally with its peers. As shown in Supplementary Table 1, MGACO achieves the least mean by a significant margin, indicating that the ACOR improved by the two improvement procedures is the best. MGACO is ranked first with a “Mean” value of 1.57, which is substantially higher than GACO, which is ranked second with a “Mean” value of 2.20.
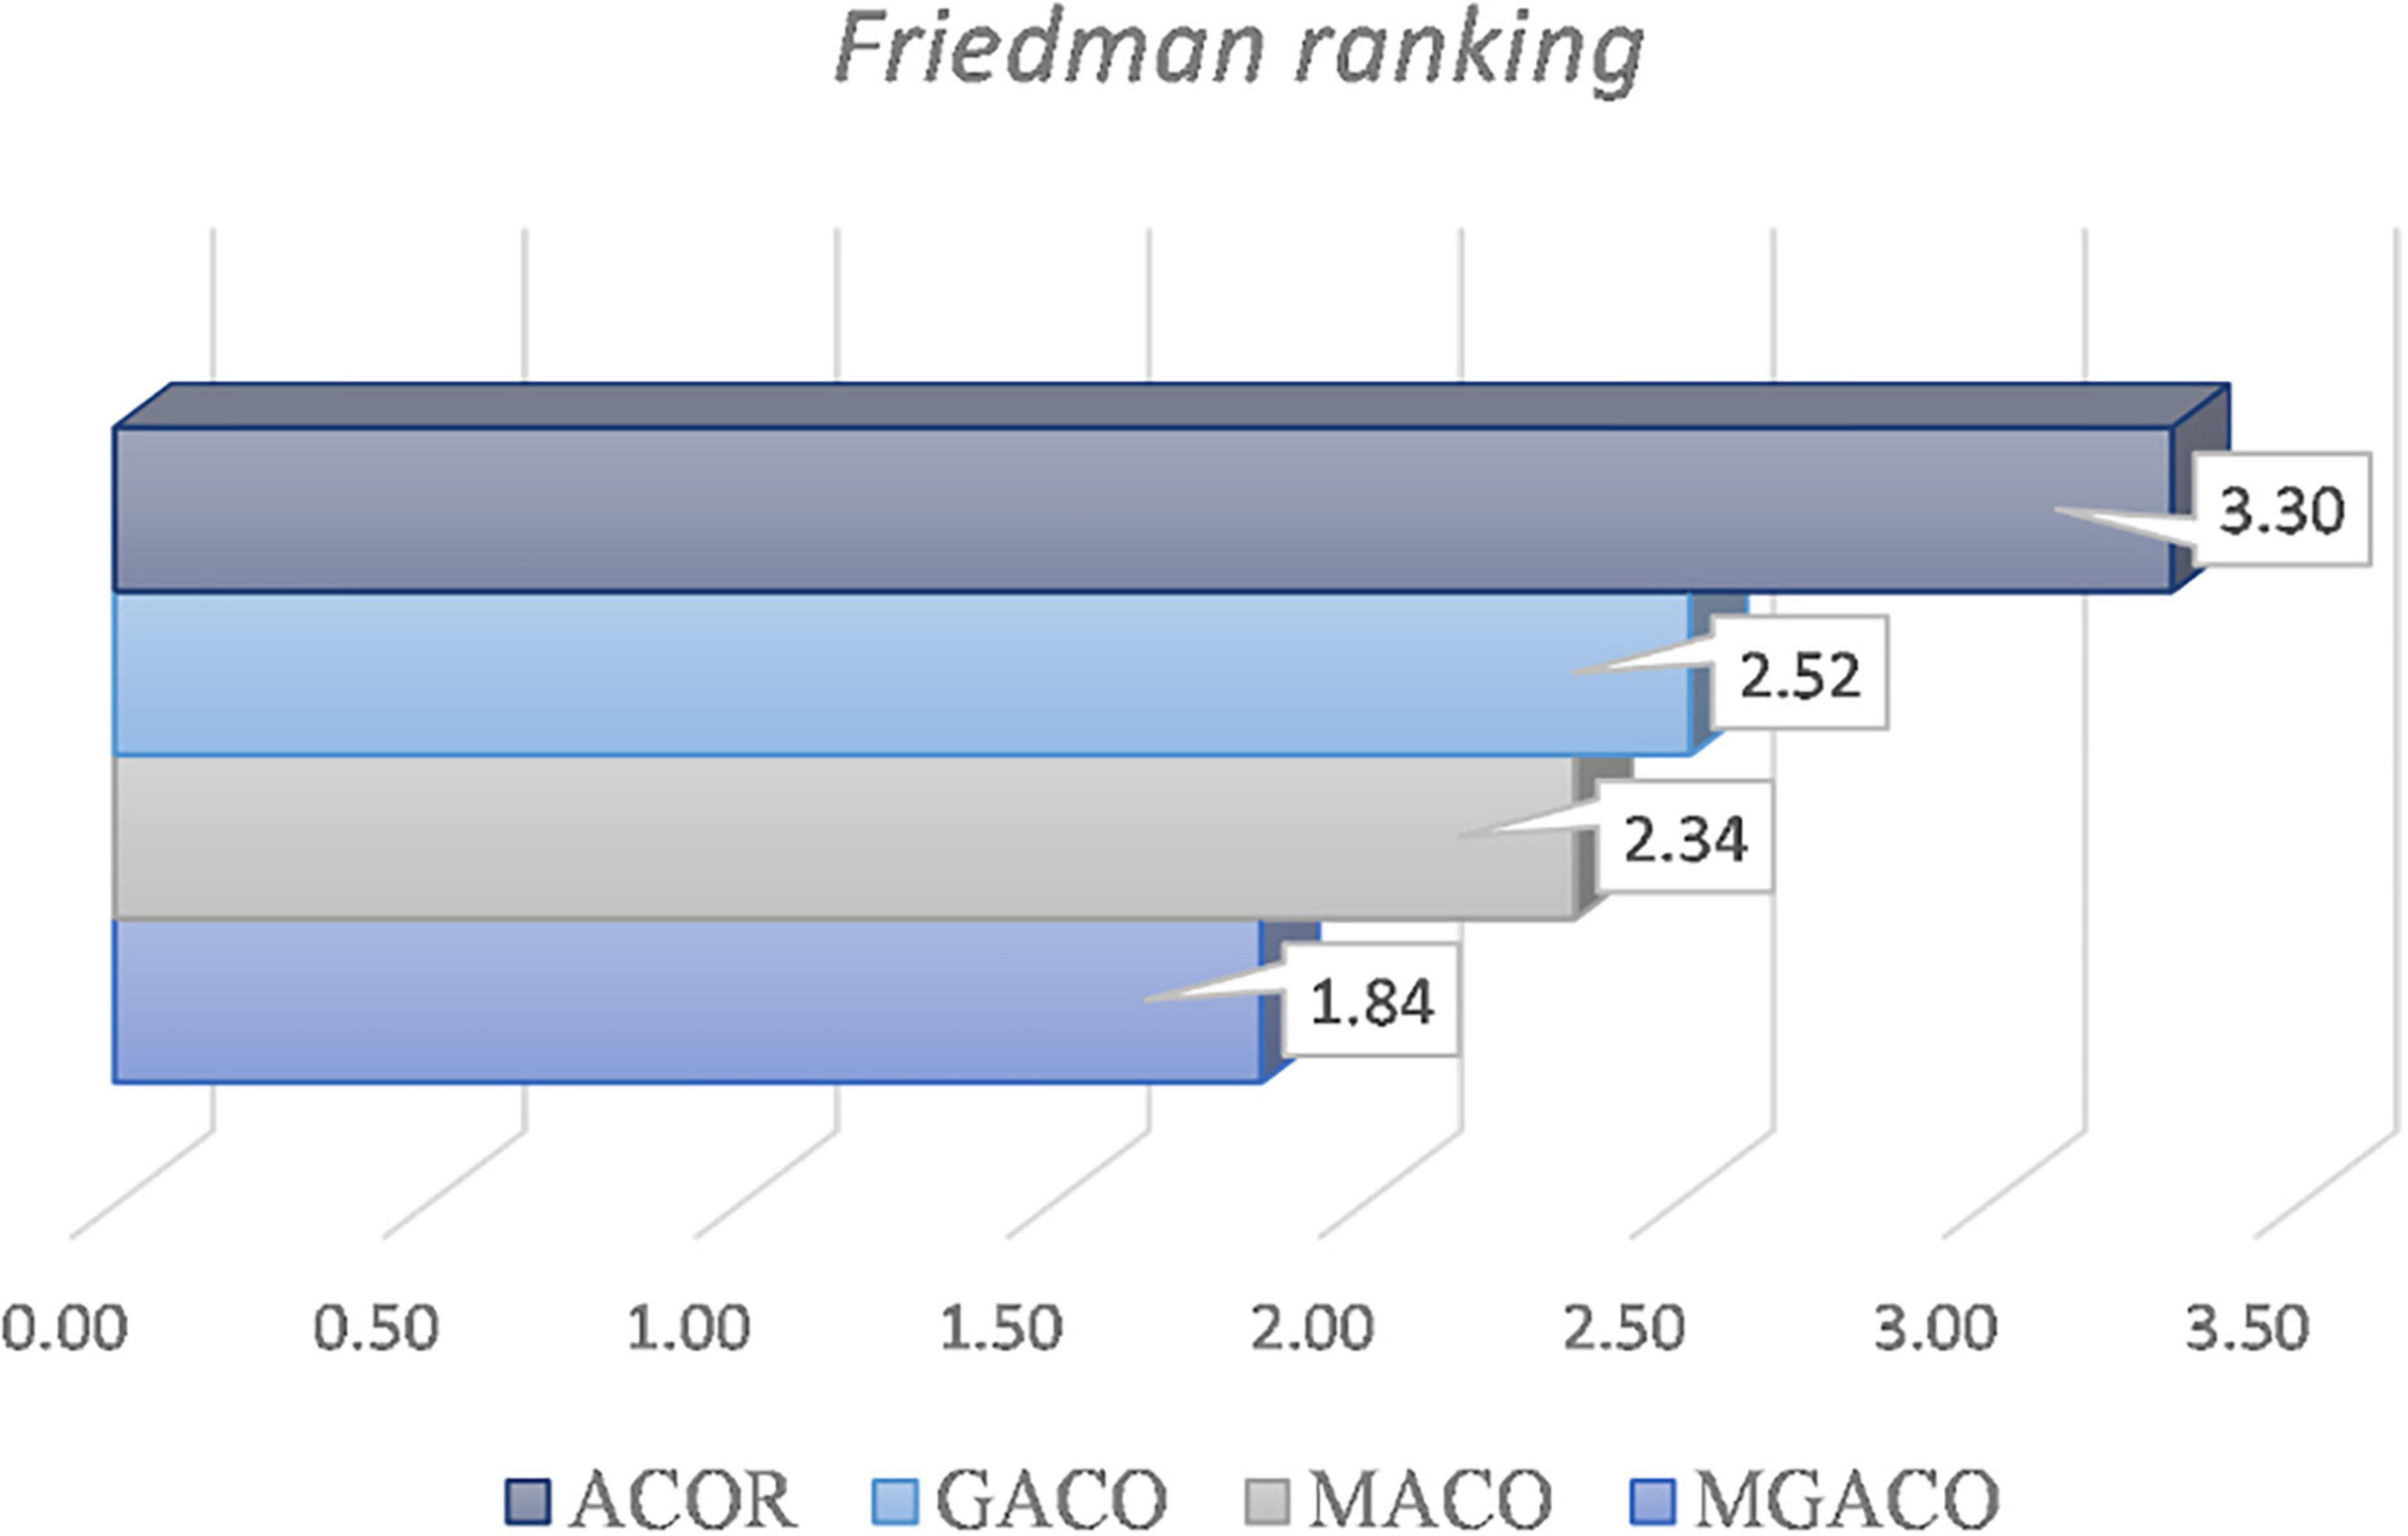
The convergence curves for the four versions are shown in Supplementary Figure 1, and the convergence processes for F9, F11, F16, and F18 demonstrate that MGACO has the strongest capacity to leap out of the local optimum as a slightly quicker convergence pace than the other variants. Figure 7 displays the findings from the Friedman test analysis of the four variants, where MGACO ranks first with a score of 1.84, outperforming the other three variants. This further demonstrates that the MGACO created using the new movement strategy and the Cauchy-Gaussian fusion strategy has the best outcomes.
Figure 7. Some convergence curves on benchmark functions.
Supplementary Figure 2 displays the findings from several viewpoints of research on MGACO. Supplementary Figure 2A shows the distribution of the benchmark functions from a 3D viewpoint. The ideal site is shown by a red dot in Supplementary Figure 2B, while black dots indicate investigated positions. Supplementary Figure 2B shows the 2D distribution of the searched locations. Supplementary Figure 2C displays the variation of the first dimension of the individual position over time. Supplementary Figure 2D illustrates how the average fitness of all subjects changed during the course of iteration. Supplementary Figure 2E shows the convergence curves for MGACO and ACOR. It can be demonstrated, through the distributions in two and three dimensions, that MGACO eventually locates the ideal solution after performing all potential iterations for benchmark functions of varying complexity. The initial oscillation of the individuals’ positions is large, but it gradually decreases and converges as they iterate through the search space, allowing them to avoid being stuck in a local optimum and improve their overall performance. According to the downward oscillation of the average fitness curve of all individuals, all persons may eventually sustain convergence to the optimum solution throughout the search process until they arrive at the perfect solution. The convergence curves from MGACO are more accurate overall than those from AOCR, and those from F9, F24, and F25 are also more accurate overall than those from AOCR. The convergence curves for the two approaches indicate that MGACO has superior final convergence accuracy than AOCR, and the convergence curves for F9, F24, and F25 also demonstrate that MGACO converges more rapidly than AOCR. The convergence curves on F6, F8, as well as MGACO’s higher potential to diverge from the local optimum, provide more evidence of this.
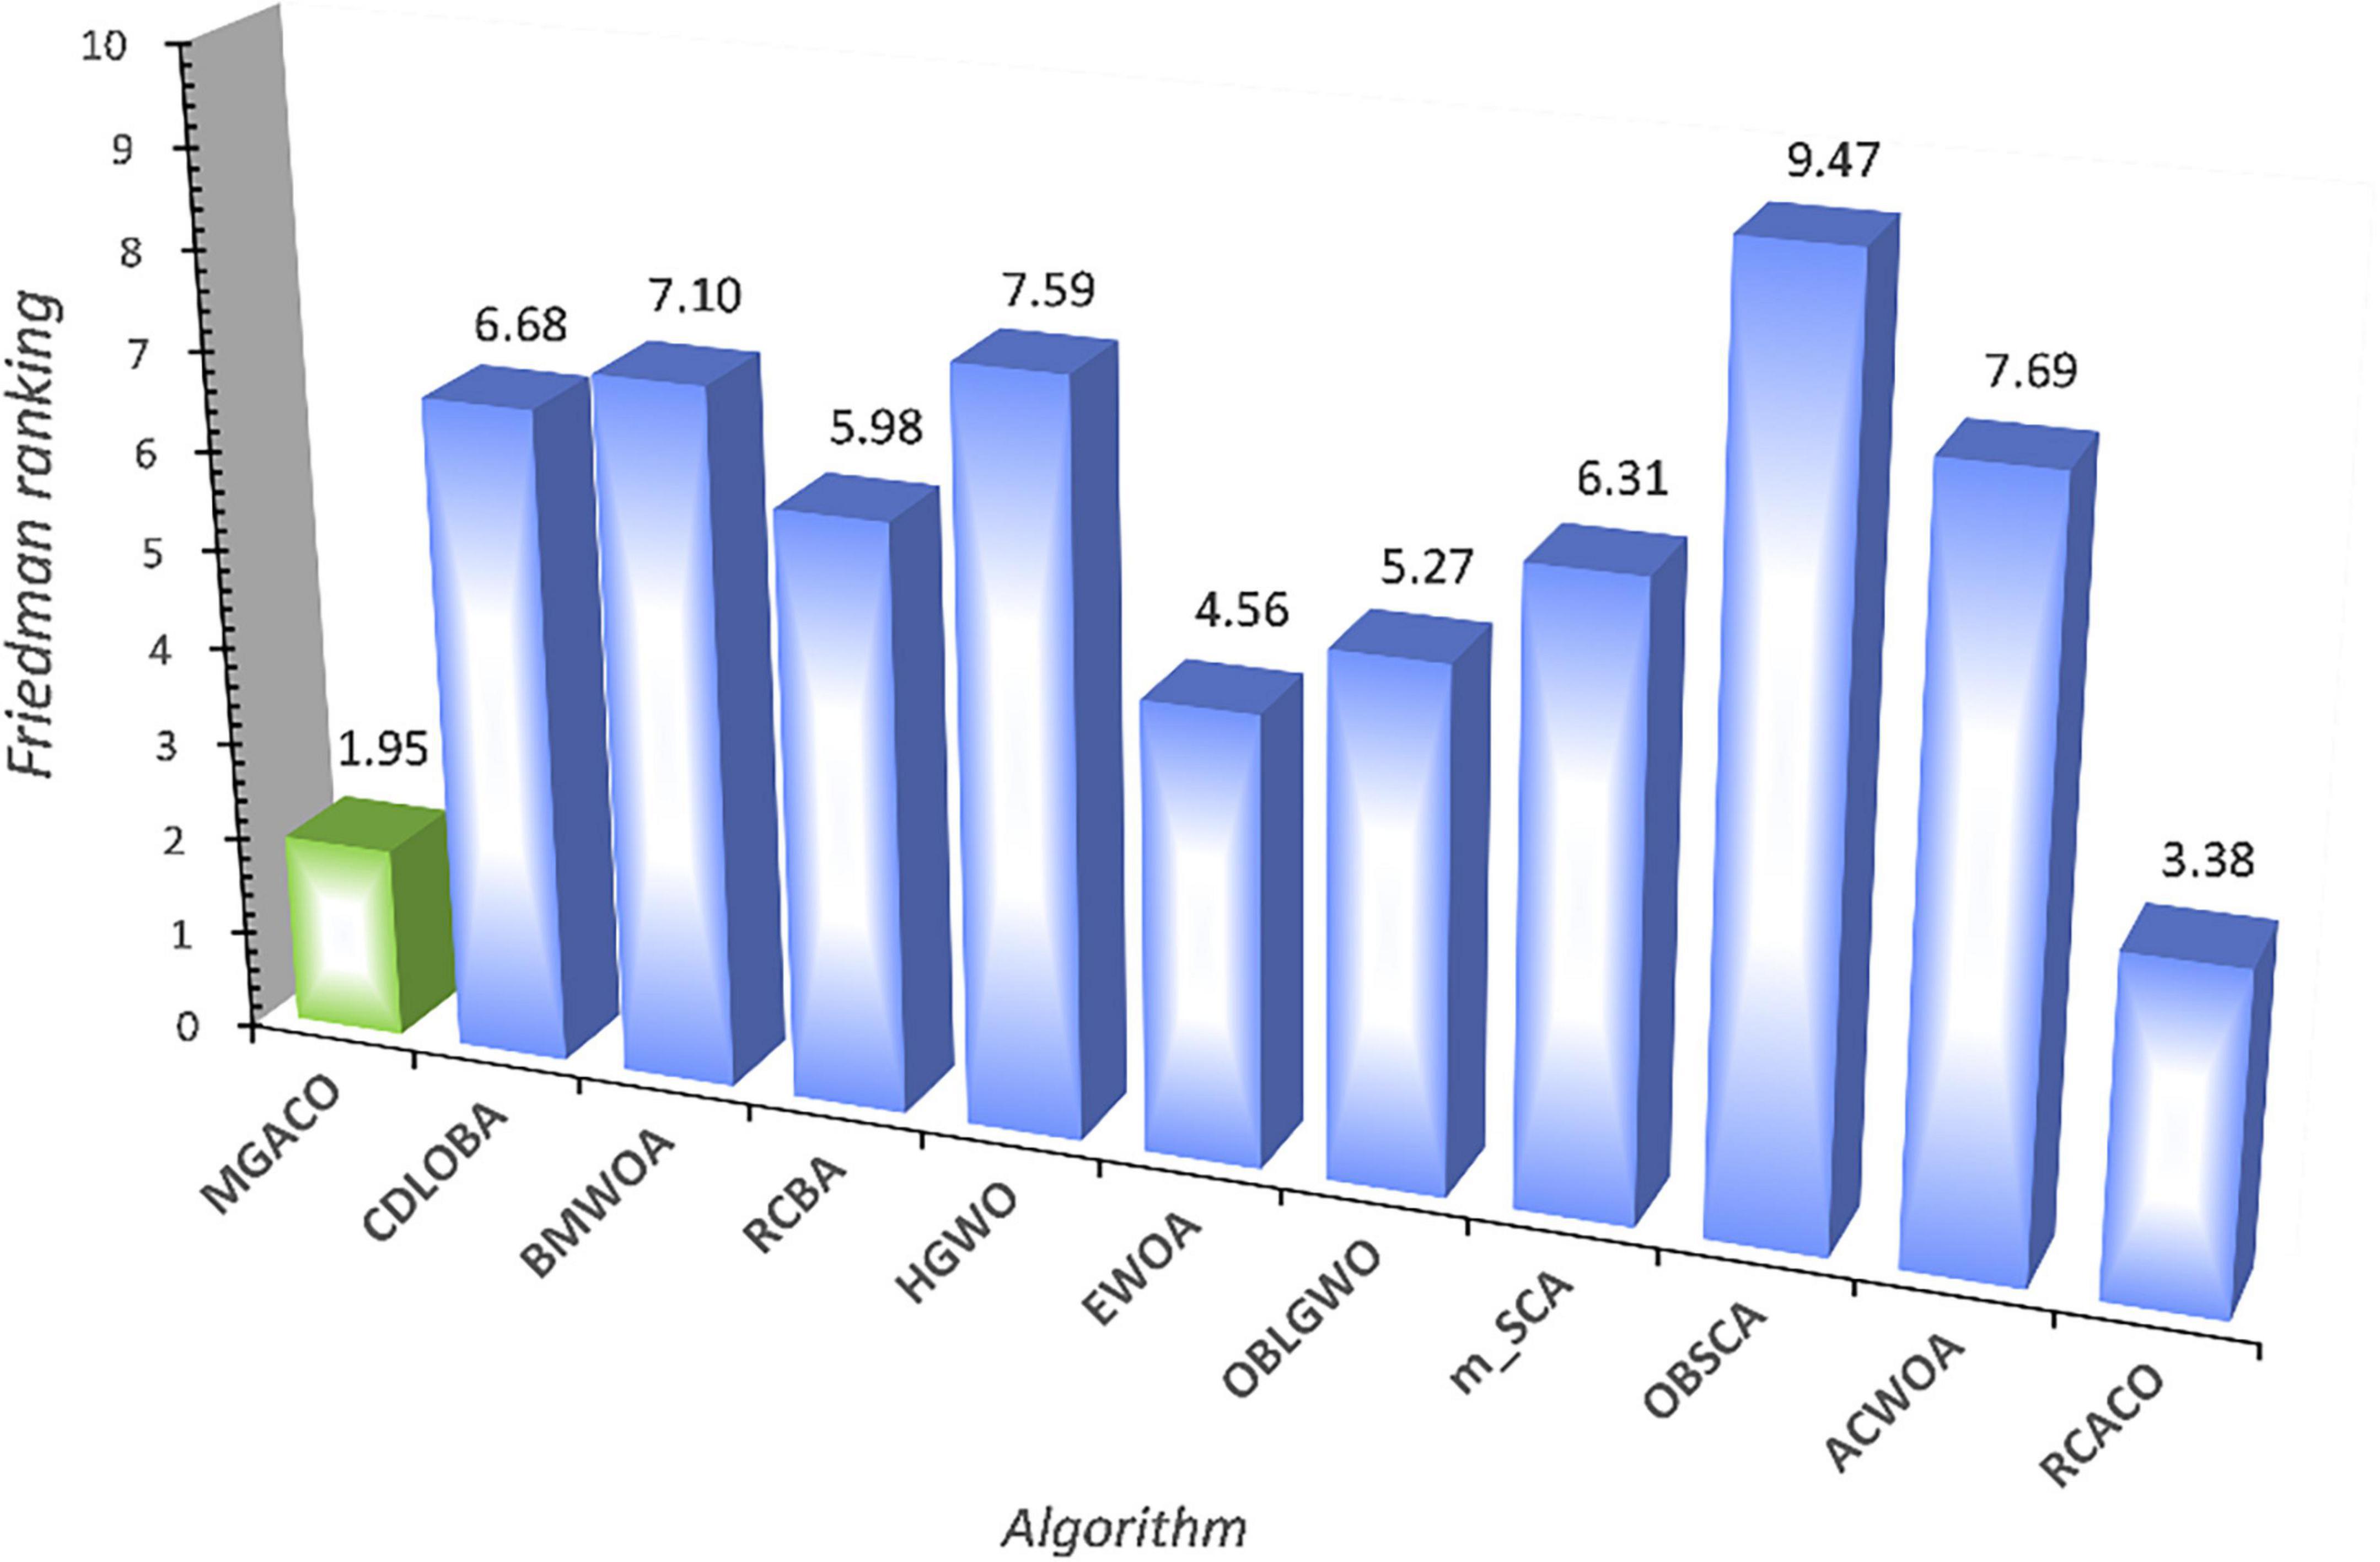
Figure 9. Friedman test results of MGACO and its 10 advanced peers.
Supplementary Figure 3 displays the analytical results for variety and balance on the pertinent benchmark functions. Supplementary Figure 3A displays the balance findings for MGACO, Supplementary Figure 3B displays the balance results for ACOR, and Supplementary Figure 3C displays the balance results for both MGACO and ACOR. It is evident by comparing the results of the exploration and exploitation balance between MGACO and ACOR that the unique movement strategy and Cauchy-Gaussian fusion technique aid MGACO in achieving a superior balance, enabling it to reach convergence more quickly and precisely than AOCR. Only on F8 and F9 do the diversity curves of MGACO converge slower than AOCR in the early stage and faster than ACOR in the late stage. This indicates that MGACO can more fully traverse the entire search space in the early stage and that the search individuals can approach the optimal position too quickly in the late stage.
5.2.2. The scalability test for MGACOTo make a more comprehensive comparison of the performance of MGACO and ACOR, this subsection sets the problem dimensions to 10, 30, 50, and 100 based on IEEE CEC 2014, followed by a comparative analysis of MGACO and ACOR. The corresponding experimental results are given in Supplementary Table 2, where the mean values of MGACO on all problem functions are smaller than ACOR when the problem dimensions are 30 and 50, and the mean values of MGACO on all 28 problem functions are smaller than ACOR when the problem dimensions are 10 and 100, which indicates that MGACO completely outperforms ACOR when dealing with different problems. The results of the Wilcoxon signed-rank test are also presented in Supplementary Table 2, where MGACO completely outperforms ACOR on 24 functions at dimension 10, 26 functions at dimension 30, and 25 functions at dimension 50, and on 26 functions at dimension 100. As can be seen, the results of the Wilcoxon signed-rank test also further illustrate that the advantage of MGACO over AOCR is huge regardless of the problem’s dimensionality. Moreover, Supplementary Figures 3–7 give the convergence curves on functions F1, F3, F12, F20, F24, F27, F28, F29, F30 when the problem dimensions are 10, 30, 50, 100, respectively. In the given convergence curves, it is well demonstrated that MGACO not only has a certain acceleration in the convergence speed, but also its ability to jump out of the local optimum has been significantly enhanced.
The aforementioned experimental findings comparing MGACO and AOCR on 30 function problems demonstrate that MGACO is more stable and can produce better outcomes when the difficulty of the issues varies. Additionally, MGACO has a superior capacity to resist entering local optima throughout the problem-solving process, which aids in coming up with a better solution. Additionally, the convergence accuracy and speed of MGACO have been enhanced. In conclusion, the suggested MGACO outperforms AOCR in terms of benefits and problem-solving strength.
5.2.3. Comparison with some conventional methodsThe major goal of this subsection is to contrast MGACO with a few relatively traditional basic algorithms in order to highlight the technology’s key benefits better. In this experiment, the fundamental algorithms up for comparison are MVO, ACOR, BA, DE, FA, GWO, MFO, PSO, SCA, and WOA, and the algorithms themselves choose the parameter values. The comparison between MGACO and the ten fundamental algorithms is shown in Supplementary Table 3, along with the mean, variance, and Wilcoxon signed-rank test analysis findings. According to the optimal values of the functions that were obtained, MGACO obtained the optimal value, or minimum mean value, on 20 function problems, whereas DE, MVO, and WOA only obtained the optimal value on 7 function problems, 2 function problems, and 1 function problem, respectively. This shows that MGACO still has a greater advantage over the fundamental algorithms. Additionally, according to the Wilcoxon signed-rank test findings, MGACO outperformed the DE, rated No. 2, on the 21 function problems to achieve the top spot with a mean value of 1.43. Figure 8 displays the results of the Friedman test for MGACO and the 10 fundamental techniques. MGACO ranks first with an attained value of 1.86, while DE ranks second with an obtained value of 3.73, further demonstrating that MGACO still has an edge over the fundamental algorithms. Supplementary Figure 8 compares the convergence curves of MGACO and 10 fundamental methods for a set of benchmark functions. The convergence curves F6, F23, F25, and F28 show how MGACO has improved in terms of convergence speed, while F1, F11, F16, and F17 demonstrate how MGACO outperforms other algorithms in terms of avoiding local optimums. Therefore, when MGACO is compared to other fundamental algorithms, its main benefits are also clearly shown.
Figure 8. Friedman test results of MGACO and its 10 basic peers.
5.2.4. Comparison with some excellent variantsThis section compares MGACO with various newly suggested enhanced variations to better highlight the fundamental benefits of the algorithm. The comparison included the algorithms OBLGWO, OBSCA, RCACO, RCBA, ACWOA, BMWOA, CDLOBA, EWOA, HGWO, and m_SCA. Supplementary Table 4 displays the experimental results for each algorithm after 30 separate runs, including the mean, variance, and Wilcoxon signed-rank test analysis findings. In terms of finding the best solutions to function problems, MGACO finds the best solutions to 16 of them, RCACO, CDLOBA, RCBA, EWOA, and HGWO each find the best solutions to just 4 of them, MGACO finds the best solutions to 3 function problems, and MGACO finds the best solutions to just 1 function problem. As a result, MGACO outperforms all other advanced peers and has the best performance among the optimum values found for function issues. Additionally, we can observe that MGACO only outperforms RCACO, which is rated. No. 2, on two function problems, further proving that it outperforms other approaches. The Friedman test results are shown in Figure 9, where MGACO comes out on top with a score of 1.95 and RCACO comes in second with a score of 3.38. This further proves that MGACO outperforms other techniques. MGACO has the best convergence accuracy on all benchmark functions, the fastest convergence rate on F4, F20, and F29 than other techniques, and the strongest capacity to jump out of local optimum on F9, F11, and F16 in the convergence curves shown in Figure 9. As a result of the above correlation research, its primary benefits are well highlighted when comparing MGACO to other advanced variations. However, the complexity of the algorithm inevitably increases because of the clever integration of multiple mechanisms into ACO, which can also be illustrated in the total CPU time consumption for 30 independent runs given in Figure 10, where although the time consumption of MGACO is higher than that of some competing algorithms, it is still at the average of its peers. Therefore, we consider such a complexity level to be acceptable.
Figure 10. The total CPU time consumption of all methods for 30 independent runs.
5.3. Experiment on COVID-19 X-ray image segmentationIn this part, we performed our research on the X-ray images of 8 COVID-19 patients to demonstrate the superior segmentation performance of MGACO-MIS. First, segmentation tests were performed at levels 4, 5, and 6 to reflect low threshold levels utilizing MGACO-MIS and another 8 equivalent methodologies. Second, segmentation studies were also performed using levels 15, 20, and 25 to represent high threshold levels.
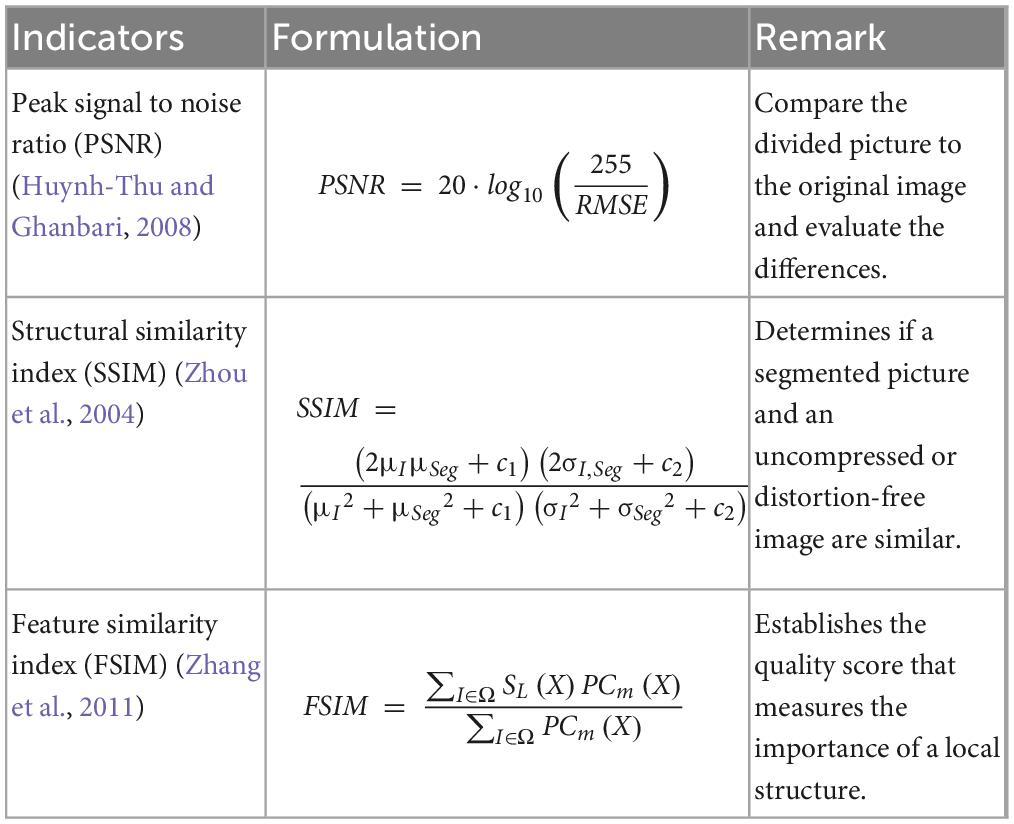
5.3.1. Performance measures indicatorsIn this study, three widely used evaluation measures are employed to more clearly show how well the algorithm performs and how well the picture segmentation is done. The three indicators utilized are PSNR, FSIM, and SSIM in the Table 3, with the following definitions for each.
Table 3. Indicators of the multi-level image segmentation techniques’ performance.
Furthermore, a higher value for any one of the three indices mentioned above indicates a better degree of segmented image quality. The SSIM and FSIM index values range is [0, 1]. Further in-depth analysis was performed on the obtained assessment results using the mean, variance, Wilcoxon signed-rank test, and Friedman test. Based on the study and comparison of those experimental outcomes, MGACO-superior MIS’s segmentation effect and its flexibility to different threshold levels are well shown when it is put up against other similar MIS approaches.
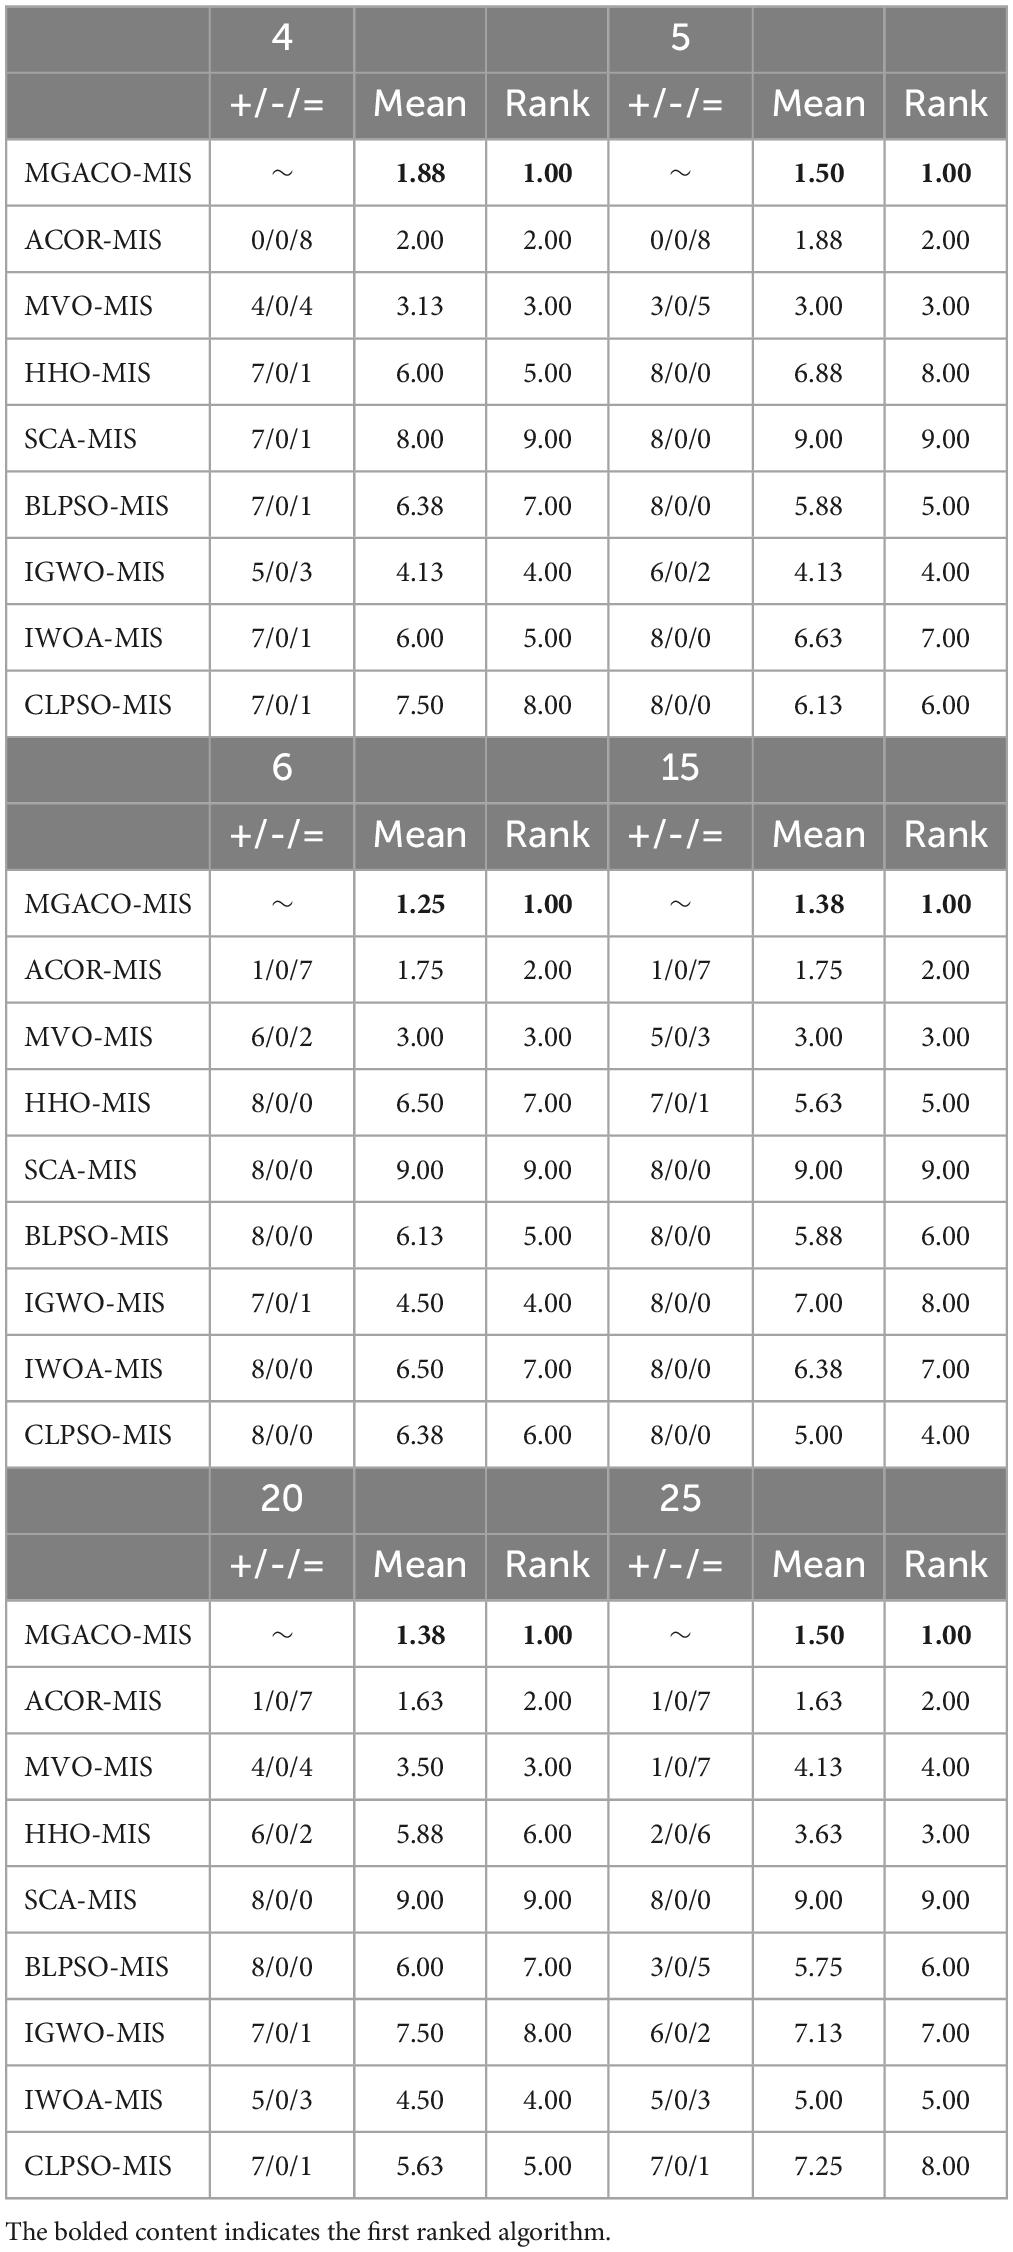
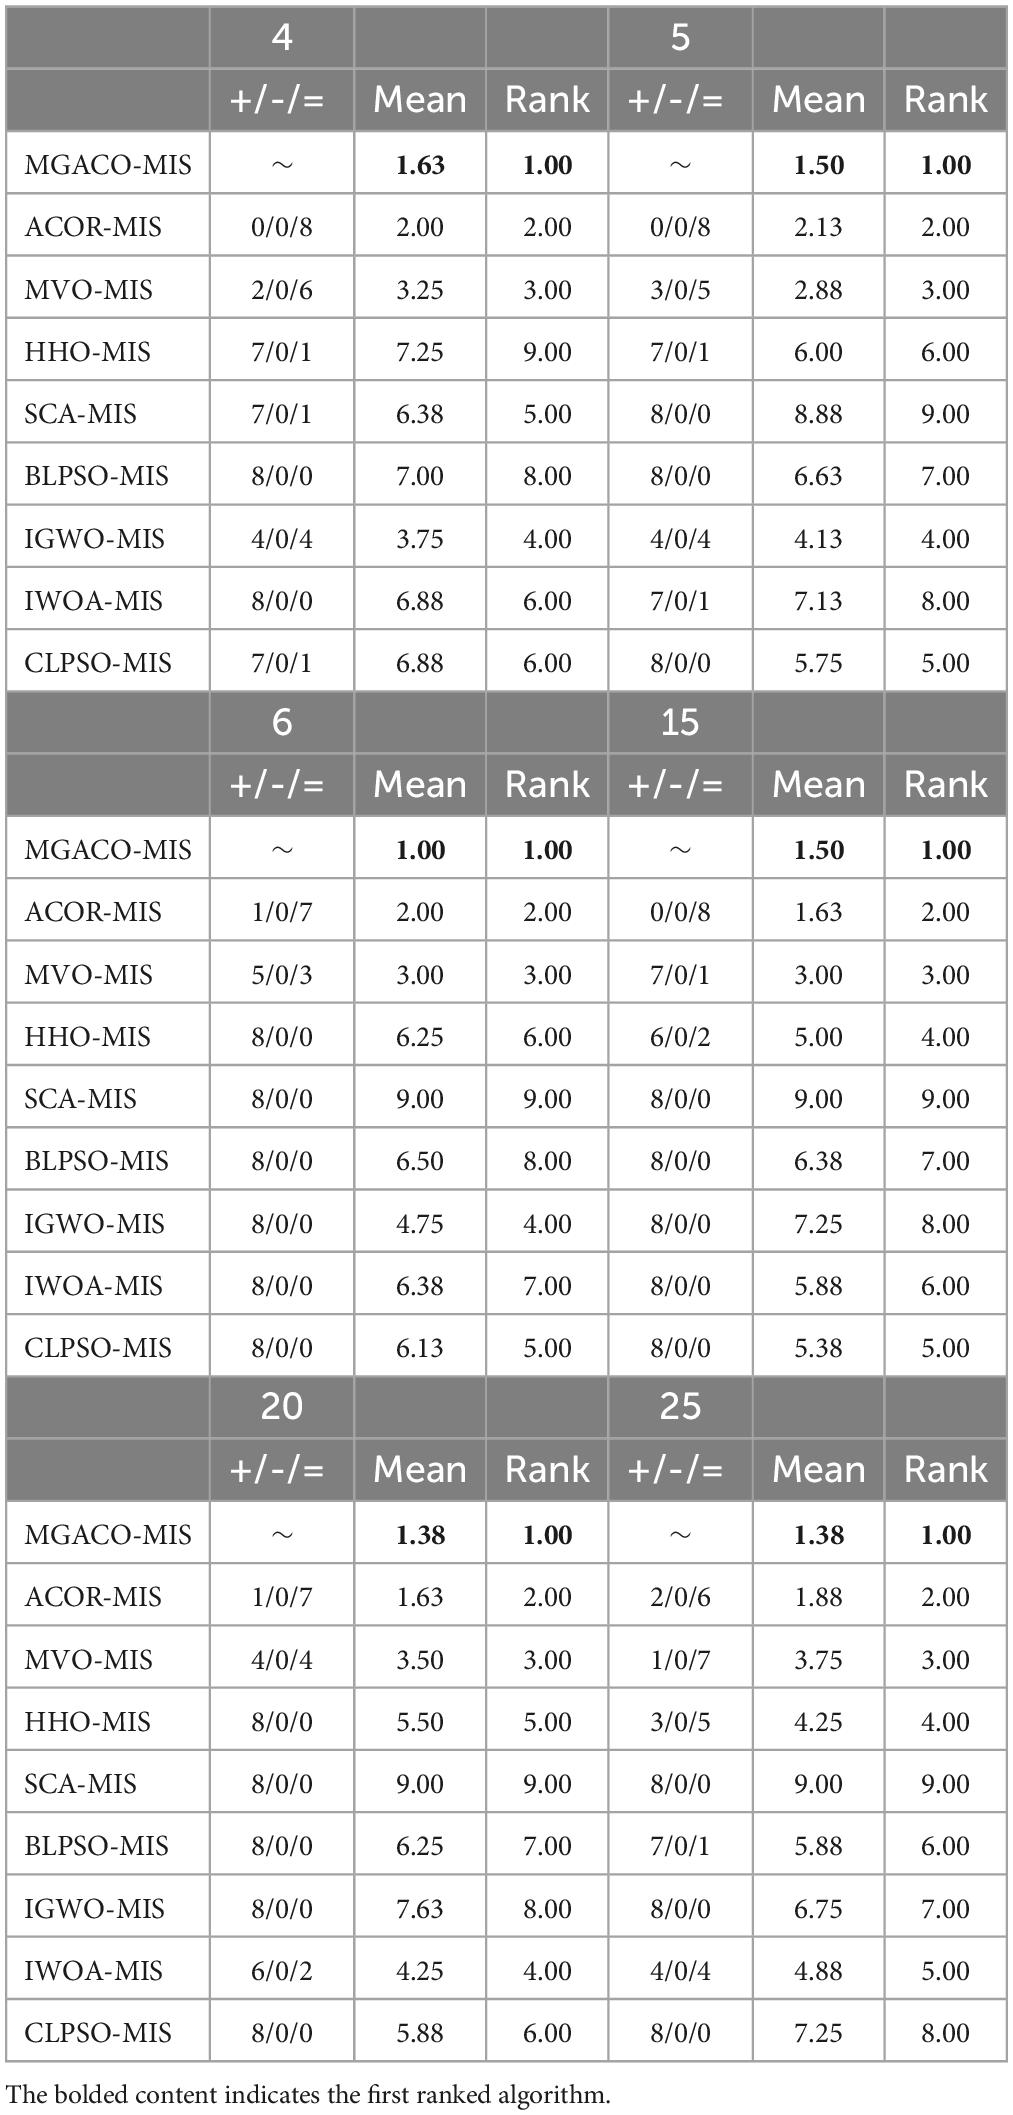
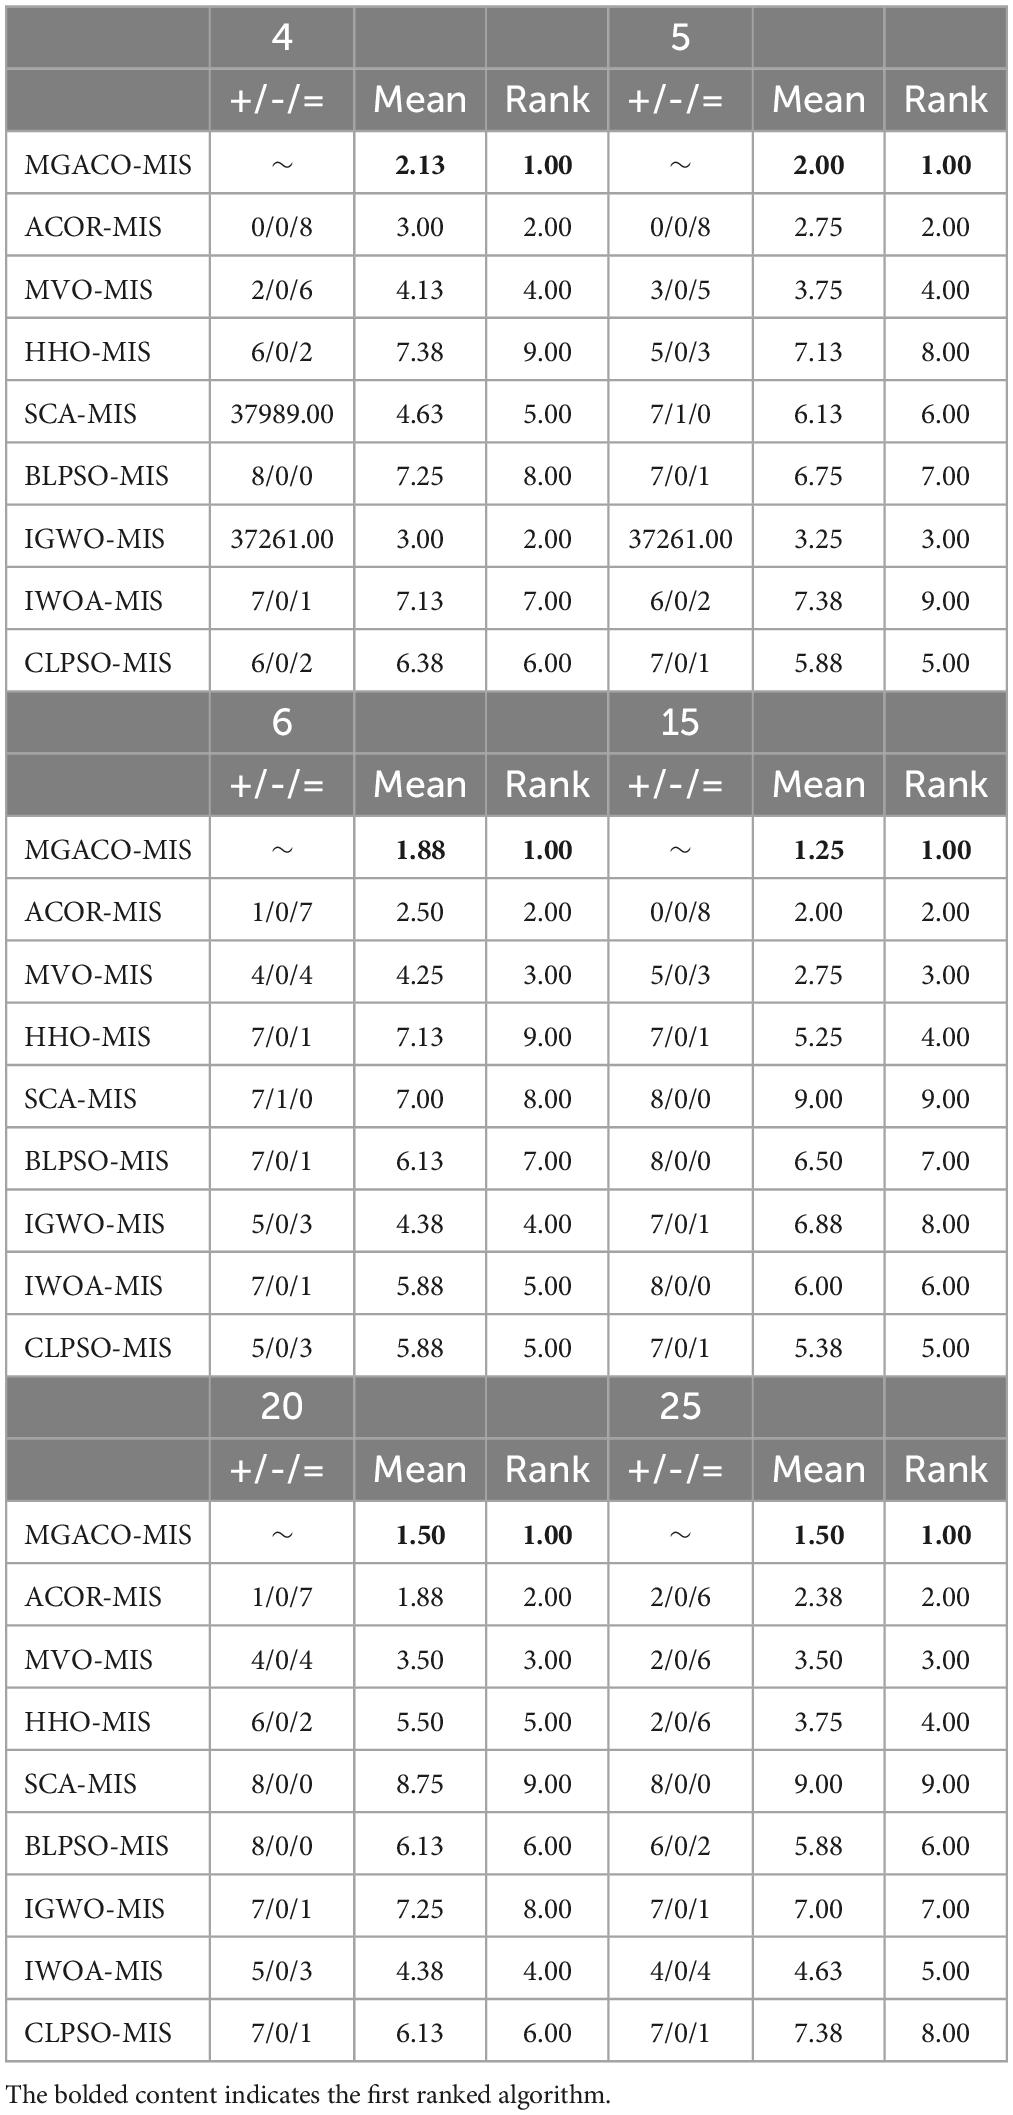
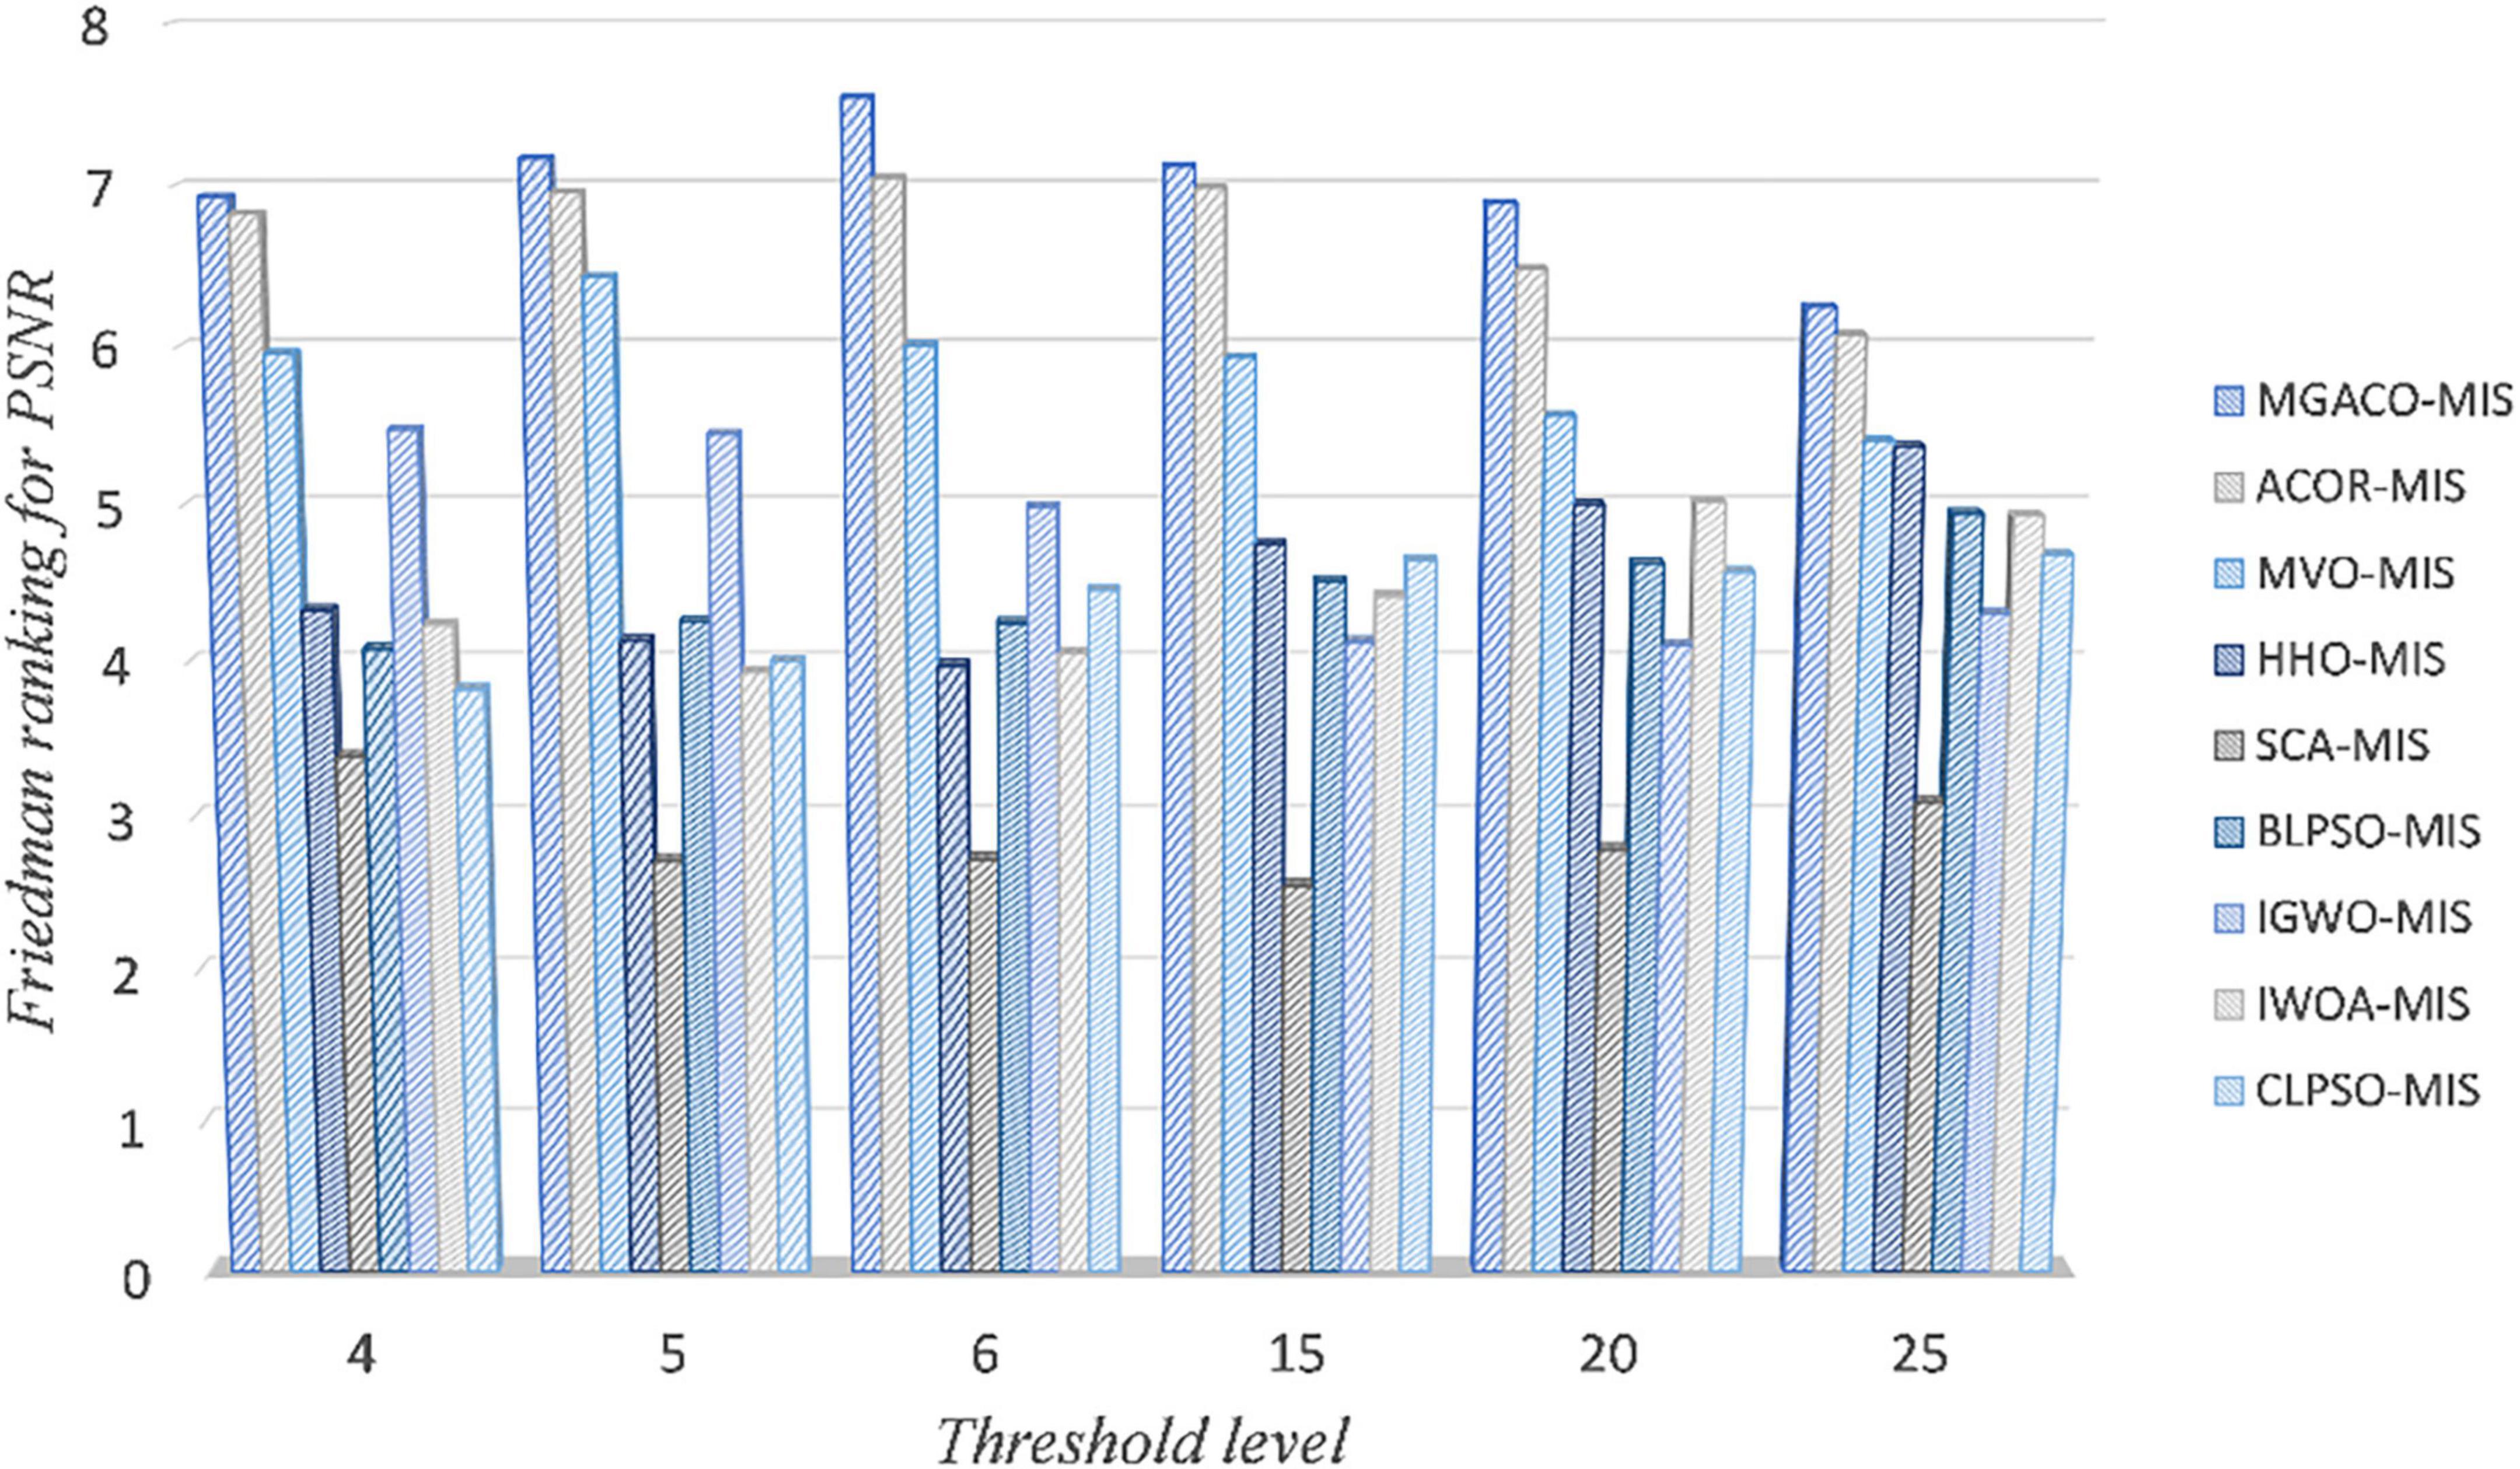
5.3.2. Experimental result analysesIn order to demonstrate that MGACO-MIS may yield better segmentation results on COVID-19 pathology images, this section compares MGACO-MIS with eight other peers at different threshold levels. These peers include the techniques ACOR-MIS, MVO-MIS, HHO-MIS, SCA-MIS, BLPSO-MIS, IGWO-MIS, IWOA-MIS, and CLPSO-MIS. The findings of the assessment using PSNR, FSIM, and SSIM are shown in Supplementary Tables 5–7, and they contain the mean and variance of PSNR, FSIM, and SSIM obtained using all segmentation techniques at threshold levels 4, 5, 6, 15, 20, and 25. It is clear that MGACO-MIS receives the maximum number of optimum evaluation values among the three evaluation results when looking at the number of optimal evaluation results achieved on PSNR, FSIM, and SSIM. This shows that MGACO-MIS is capable of producing extremely good segmentation results. Following additional examination of the PSNR, FSIM, and SSIM assessment findings using the Wilcoxon signed-rank test, the results are presented in Tables 4–6, where the bolded content indicates the first ranked algorithm. MGACO-MIS came in first at various threshold settings, and its performance on most pictures is comparable to that of other approaches. In order to further analyze the PSNR, FSIM, and SSIM assessment outcomes, the Friedman test results are presented in Figure 11 and Supplementary Figures 10, 11, 2. The MGACO-MIS was also able to achieve maximum values at various threshold levels. When the results of the Friedman test, Wilcoxon signed-rank test, Wilcoxon variance test, and PSNR, FSIM, and SSIM evaluations are combined, they show that MGACO-MIS can produce better segmentation results on pathological pictures of COVID-19. Supplementary Figures 12, 13 also show the 2D Kapur’s entropy convergence curves for all techniques used during level 6 and level 25 segmentation, where MGACO–MIS ultimately achieves the highest value of 2D Kapur’s entropy. It further demonstrates that MGACO-MIS can get superior segmentation results on the diseased pictures of COVID-19 when combined with examining the maximum 2D Kapur’s entropy and its convergence curves. Supplementary Table 8 lists the precise segmentation thresholds established using each approach on all pictures when the threshold levels were low. Figure 12 displays the precise segmentation results at threshold level 6, and Supplementary Figure 14 displays the results of the precise segmentation at threshold level 25. Combining the precise segmentation thresholds with the segmentation outcomes at threshold level 6, it is clear that MGACO-MIS produces better segmentation outcomes than other techniques regarding detail retention, local feature retention, and overall segmentation effect. This also suggests that the segmentation thresholds produced by MGACO-MIS are reasonable and capable of completing the segmentation task. Additionally, the precise segmentation outcomes at the threshold level of 25 further suggest that MGACO-MIS can achieve superior segmentation outcomes.
Table 4. The PSNR analysis results of MGACO and its peers at different threshold levels.
Table 5. The FSIM analysis results of MGACO and its peers at different threshold levels.
Table 6. The SSIM analysis results of MGACO and its peers at different threshold levels.
Figure 11. Friedman test results of MGACO-MIS and its peers for PSNR evaluation.
Figure 12. Segmentation results by using 2D Kapur’s entropy for all methods at threshold level 6.
6. DiscussionWe first conducted a comparison experiment based on the 30 test functions of IEEE CEC2014 between the new moving strategy and the variants created by the Cauchy-Gaussian fusion strategy, where MGACO obtained the minimum mean value the majority of the time on all function problems. MGACO also outperformed the other three variants of the algorithm in the analysis results. Additionally, the effect of the two new mechanisms on ACOR is thoroughly examined from a variety of angles, with an emphasis on diversity and balance. This analysis demonstrates that MGACO further optimizes the balance of exploration and development based on ACOR, enabling MGACO to handle more challenging issues. Then, to analyze the effectiveness of MGACO and ACOR more thoroughly, a comparison of the two programs is made across several aspects. The findings of this comparison conclusively show that MGACO can provide better outcomes and is more stable. MGACO has a superior capacity to resist entering a local optimum throughout the problem-solving process, which aids in developing a better solution. Finally, we evaluate MGACO against certain established, fundamental algorithms and some enhanced variations. The results of the Friedman test analysis, Wilcoxon signed-rank test analysis, and associated convergence curves clearly show that MGACO not only produces high-quality solutions but also has a little improvement in convergence speed and the capacity to depart from the local optimum. In conclusion, this paper’s proposal for the MGACO offers more advantages over the AOCR and a higher capacity for problem-solving. Additionally, we conducted MIS experiments based on actual COVID-19 pathology images, the evaluation results of PSNR, SSIM, and FSIM, and the additional Wilcoxon signed-rank test and Friedman test results can show that MGACO-MIS can achieve better segmentation results on the pathological images of COVID-19. The particular segmentation findings further demonstrate that MGACO-MIS outperforms its competitors in terms of detail preservation, local feature preservation, and overall segmentation outcomes.
As a result, it is undeniably established that MGACO is a very good swarm intelligence optimization algorithm and that MGACO-MIS is an even better segmentation technique when MGACO is used to segment problematic pictures from COVID-19. In future work, the proposed method can also be applied to more cases, such as the optimization of machine learning models iris segmentation and recognition (Chen et al., 2023), fine-grained alignment (Wang et al., 2023), remote pulse extraction (Zhao et al., 2022), Alzheimer’s disease identification (Yan et al., 2022), MRI reconstruction (Lv et al., 2021), renewable energy generation (Sun et al., 2022), power distribution network (Cao et al., 2022), retinal vessel segmentation (Li et al., 2022), privacy protection of personalized information retrieval (Wu Z. et al., 2020; Wu et al., 2021c,d, 2023), and privacy protection of location-based services (Wu et al., 2021b,2022).
7. Conclusion and future worksAn MIS approach (MGACO-MIS) based on an improved version of ACOR (MGACO) is developed in this study. Not only is a new move strategy included in MGACO, but also the Cauchy-Gaussian fusion approach. Due to the addition of the new movement strategy and the Cauchy-Gaussian fusion approach, MGACO’s convergence speed and capacity to jump out of the local optimum have been much improved. To highlight these fundamental benefits of MGACO, the 30 benchmark functions from IEEE CEC2014 are used to compare MGACO and ACOR with 10 conventional basic algorithms and 10 modifications. The outcomes show that MGACO increases convergence speed and considerably increases its capacity to exit the local optimum. In order to show that MGACO can produce high-quality segmentation results when performing image segmentation, a comparison experiment was carried out between MGACO-MIS and eight other comparable segmentation methods using real pathological images of COVID-19 at threshold levels 4, 5, 6, 15, and 25, where 4, 5, and 6 represent low threshold levels and 15, 20, and 25 represent high threshold levels. The final assessment and analysis findings conclusively show that the created MGACO-MIS can produce accurate image segmentation results. However, the proposed method achieves very good results, but the time consumption is still large. To better solve this problem, it will be solved by introducing parallel computing or high-performance computing in the future.
For future work, MGACO will be considered to be applied to more fields, such as bankruptcy prediction (Zhang et al., 2020), engineering design (Chen et al., 2019; Luo et al., 2019; Al-Betar et al., 2020; Tu et al., 2020; Wang et al., 2020), and financial stress prediction (Luo et al., 2018). Further, MGACO-MIS will be considered for the segmentation of more pathological images to achieve greater value and contribute to the advancement of medical diagnosis technology.
Data availability statementThe original contributions presented in this study are included in the article/Supplementary material, further inquiries can be directed to the corresponding authors.
Author contributionsXZ, AH, YC, and BM: writing—original draft, writing—review and editing, software, visualization, and investigation. LL and HC: conceptualization, methodology, formal analysis, investigation, writing—review and editing, funding acquisition, and supervision. All authors contributed to the article and approved the submitted version.
FundingThis work was supported in part by the Natural Science Foundation of Zhejiang Province (LZ22F020005), National Natural Science Foundation of China (62076185, U1809209), MIIT, PRC (2020NO.78), Wenzhou Science & Technology Bureau (Y20210097), Wenzhou Science and Technology Association Service Technology Innovation Project-General Practice Wisdom File Record System (2022-jczc54), the Second Batch of Educational Reform Research Projects of “13th Five-Year Plan” in Zhejiang Province (jg20190899), Zhejiang Provincial Education Sciences Planning Subject in 2022 (2022SCG263), the Ideological and Political Demonstration Course “Microcontroller Technology and Applications” of the Provincial-Level Curriculum Ideological and Political Teaching Project in 2022 [Zhejiang Teaching Letter (2022) No. 51].
Conflict of interestThe authors declare that the research was conducted in the absence of any commercial or financial relationships that could be construed as a potential conflict of interest.
Publisher’s noteAll claims expressed in this article are solely those of the authors and do not necessarily represent those of their affiliated organizations, or those of the publisher, the editors and the reviewers. Any product that may be evaluated in this article, or claim that may be made by its manufacturer, is not guaranteed or endorsed by the publisher.
Supplementary materialThe Supplementary Material for this article can be found online at: https://www.frontiersin.org/articles/10.3389/fninf.2023.1126783/full#supplementary-material
ReferencesAbd Elaziz, M., Oliva, D., and Xiong, S. (2017). An improved opposition-based sine cosine algorithm for global optimization. Expert Syst. Appl. 90, 484–500. doi: 10.1016/j.eswa.2017.07.043
CrossRef Full Text | Google Scholar
Abd Elaziz, M., Yousri, D., Al-qaness, M. A. A., AbdelAty, A. M., Radwan, A. G., and Ewees, A. A. (2021). A Grunwald–Letnikov based Manta ray foraging optimizer for global optimization and image segmentation. Eng. Appl. Artif. Intell. 98:104105. doi: 10.1016/j.engappai.2020.104105
CrossRef Full Text | Google Scholar
Abdel-Basset, M., Chang, V., and Mohamed, R. (2020). HSMA_WOA: A hybrid novel Slime mould algorithm with whale optimization algorithm for tackling the image segmentation problem of chest X-ray images. Appl. Soft Comput. 95:106642. doi: 10.1016/j.asoc.2020.106642
PubMed Abstract | CrossRef Full Text | Google Scholar
Al-Betar, M. A., Awadallah, M. A., Heidari, A. A., Chen, H., Al-khraisat, H., and Li, C. (2020). Survival exploration strategies for harris hawks optimizer. Expert Syst. Appl. 168:114243. doi: 10.1016/j.eswa.2020.114243
CrossRef Full Text | Google Scholar
Aranguren, I., Valdivia, A., Morales-Castañeda, B., Oliva, D., Abd Elaziz, M., and Perez-Cisneros, M. (2021). Improving the segmentation of magnetic resonance brain images using the LSHADE optimization algorithm. Biomed. Signal Proc. Control 64:102259. doi: 10.1016/j.bspc.2020.102259
CrossRef Full Text | Google Scholar
Ban, Y., Wang, Y., Liu, S., Yang, B., Liu, M., Yin, L., et al. (2022). 2D/3D multimode medical image alignment based on spatial histograms. Appl. Sci. 12:8261. doi: 10.3390/app12168261
CrossRef Full Text | Google Scholar
Bernheim, A., Mei, X., Huang, M., Yang, Y., Fayad, Z., Zhang, N., et al. (2020). Chest CT findings in coronavirus disease-19 (COVID-19): Relationship to duration of infection. Radiology 295:200463. doi: 10.1148/radiol.2020200463
PubMed Abstract | CrossRef Full Text | Google Scholar
Buades, A., Coll, B., and Morel, J. (2005). “A non-local algorithm for image denoising,” in 2005 IEEE computer society conference on computer vision and pattern recognition (CVPR’05), 20-25 June 2005, (San Diego, CA: IEEE), doi: 10.1109/CVPR.2005.38
CrossRef Full Text | Google Scholar
Cai, Z., Gu, J., Luo, J., Zhang, Q., Chen, H., Pan, Z., et al. (2019). Evolving an optimal kernel extreme learning machine by using an enhanced grey wolf optimization strategy. Expert Syst. Appl. 138:112814. doi: 10.1016/j.eswa.2019.07.031
CrossRef Full Text | Google Scholar
Cao, X., Cao, T., Xu, Z., Zeng, B., Gao, F., and Guan, X. (2022). “Resilience constrained scheduling of mobile emergency resources in electricity-hydrogen distribution network,” in IEEE transactions on sustainable energy, (Piscataway, NJ: IEEE), 1–15. doi: 10.1109/TSTE.2022.3217514
CrossRef Full Text | Google Scholar
Chakraborty, T., Banik, S. K., Bhadra, A. K., and Nandi, D. (2021). Dynamically learned PSO based neighborhood influenced fuzzy c-means for pre-treatment and post-treatment organ segmentation from CT images. Comput. Methods Prog. Biomed. 202:105971. doi: 10.1016/j.cmpb.2021.105971
PubMed Abstract | CrossRef Full Text | Google Scholar
Chen, C.-C., and Shen, L. P. (2018). Improve the accuracy of recurrent fuzzy system design using an efficient continuous ant colony optimization. Int. J. Fuzzy Syst. 20, 817–834. doi: 10.1007/s40815-018-0458-7
CrossRef Full Text | Google Scholar
Chen, H., Li, C., Mafarja, M., Heidari, A. A., Chen, Y., and Cai, Z. (2022). Slime mould algorithm: A comprehensive review of recent variants and applications. Int. J. Syst. Sci. 54, 1–32. doi: 10.1080/00207721.2022.2153635
CrossRef Full Text | Google Scholar
Chen, H., Xu, Y., Wang, M., and Zhao, X. (2019). A balanced whale optimization algorithm for constrained engineering design problems. Appl. Math. Model. 71, 45–59. doi: 10.1016/j.apm.2019.02.004
CrossRef Full Text | Google Scholar
Chen, P., Pei, J., Lu, W., Li, M., and deep, A. (2022). reinforcement learning based method for real-time path planning and dynamic obstacle avoidance. Neurocomputing 497, 64–75. doi: 10.1016/j.neucom.2022.05.006
CrossRef Full Text | Google Scholar
Chen, X., Tianfield, H., Mei, C., Du, W., and Liu, G. (2017). Biogeography-based learning particle swarm optimization. Soft Comput. 21, 7519–7541. doi: 10.1007/s00500-016-2307-7
CrossRef Full Text | Google Scholar
Chen, X., Yao, L., Zhou, T., Dong, J., and Zhang, Y. (2021). Momentum contrastive learning for few-shot COVID-19 diagnosis from chest CT images. Pattern Recognit. 113:107826. doi: 10.1016/j.patcog.2021.107826
PubMed Abstract | CrossRef Full Text | Google Scholar
Chen, Y., Gan, H., Chen, H., Zeng, Y., Xu, L., Heidari, A. A., et al. (2023). Accurate iris segmentation and recognition using an end-to-end unified framework based on MADNet and DSANet. Neurocomputing 517, 264–278. doi: 10.1016/j.neucom.2022.10.064
CrossRef Full Text | Google Scholar
Chen, Z., and Wang, R.-L. (2017). Ant colony optimization with different crossover schemes for global optimization. Cluster Comput. 20, 1247–1257. doi: 10.1007/s10586-017-0793-8
CrossRef Full Text | Google Scholar
Chen, Z., Zhou, S., and Luo, J. (2017). A robust ant colony optimization for continuous functions. Expert Syst. Appl. 81, 309–320. doi: 10.1016/j.eswa.2017.03.036
CrossRef Full Text | Google Scholar
Cohen, J. P., Morrison, P., Dao, L., Roth, K., Duong, T. Q., and Ghassemi, M. (2020). COVID-19 image data collection: Prospective predictions are the future, [Online]. arXiv [Preprint]. doi: 10.48550/arXiv.2006.11988
PubMed Abstract | CrossRef Full Text | Google Scholar
Deng, W., Xu, J., Gao, X. Z., and Zhao, H. (2022). An Enhanced MSIQDE algorithm with novel multiple strategies for global optimization problems. IEEE Trans. Syst. Man Cybern.
留言 (0)