
記住我
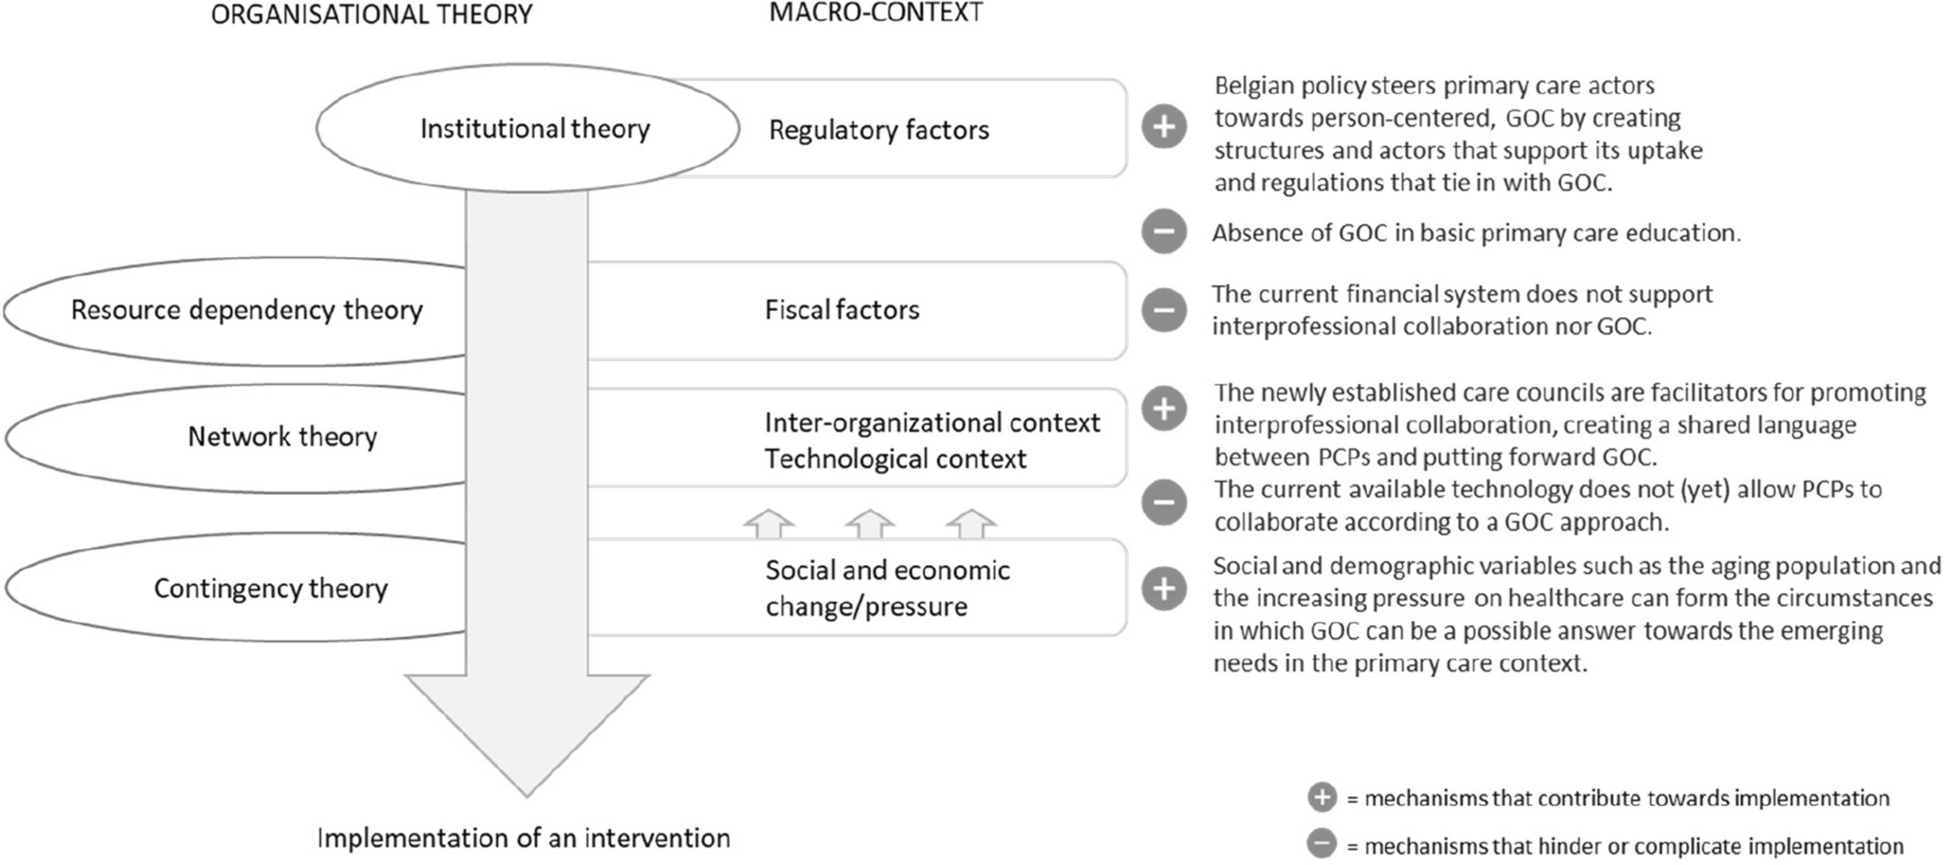


The TDF, mapped to the Behavior Change Wheel’s COM-B (capability, opportunity, motivation—behavior) system, informed our conceptual model (Fig. 1) [37, 67]. The TDF is an integrative theoretical framework that has been used across healthcare settings to inform implementation strategies, especially those requiring behavior change [68, 69]. It underwent rigorous refinement using discriminant content validation and fuzzy cluster analysis and was then mapped to the COM-B system to provide theory-based relationships between the barriers laid out in the TDF. In our conceptual model, we identify relevant TDF domains for each of the COM-B’s major categories as contributing to the target behavior, interpreter use. These COM-B categories are capability, divided into psychological, which includes knowledge and decision-making, and physical, which includes skills for interpreter access; motivation, divided into reflective, including provider beliefs about their abilities and the consequences of their decisions, and automatic, which includes professional identity and positive reinforcement; and opportunity, divided into social, which includes clinic interpreter use norms, and physical, which includes environmental context and resources, such as current interpreter access (see Table 1 for detailed list). We expect both of our study strategies to influence provider capability and motivation to use interpreters, but we expect education to influence provider capability more markedly and mobile video interpreting to have a strong and unique influence on opportunity.
Fig. 1
Conceptual model depicting relationships between determinants, behavior, and outcomes related to professional interpreter use, based on the Theoretical Domains Framework as mapped to the Behavior Change Wheel’s COM-B system. Each barrier has one example listed; additional barriers are in Table 1. Expected areas of effect with our two implementation strategies are depicted on the right; wider arrows represent larger expected effects
Table 1 Study measures and data sourcesStudy design and randomizationThis type 3 hybrid implementation-effectiveness study will test two discrete implementation strategies for improving professional interpreter use (primary implementation outcome) and patient comprehension (secondary effectiveness outcome) in primary care. The implementation strategies—interactive web-based educational modules and access to mobile video interpreting—target different sets of barriers to professional interpreter use, an evidence-based practice [20, 21, 34, 82, 83]. Our results will therefore provide insights into how best to promote implementation of a well-studied, well-established practice known to improve outcomes but inconsistently used. As the potency of barriers may vary by provider and clinic, we will test the strategies alone and in combination, using a SMART design, with provider-level randomization.
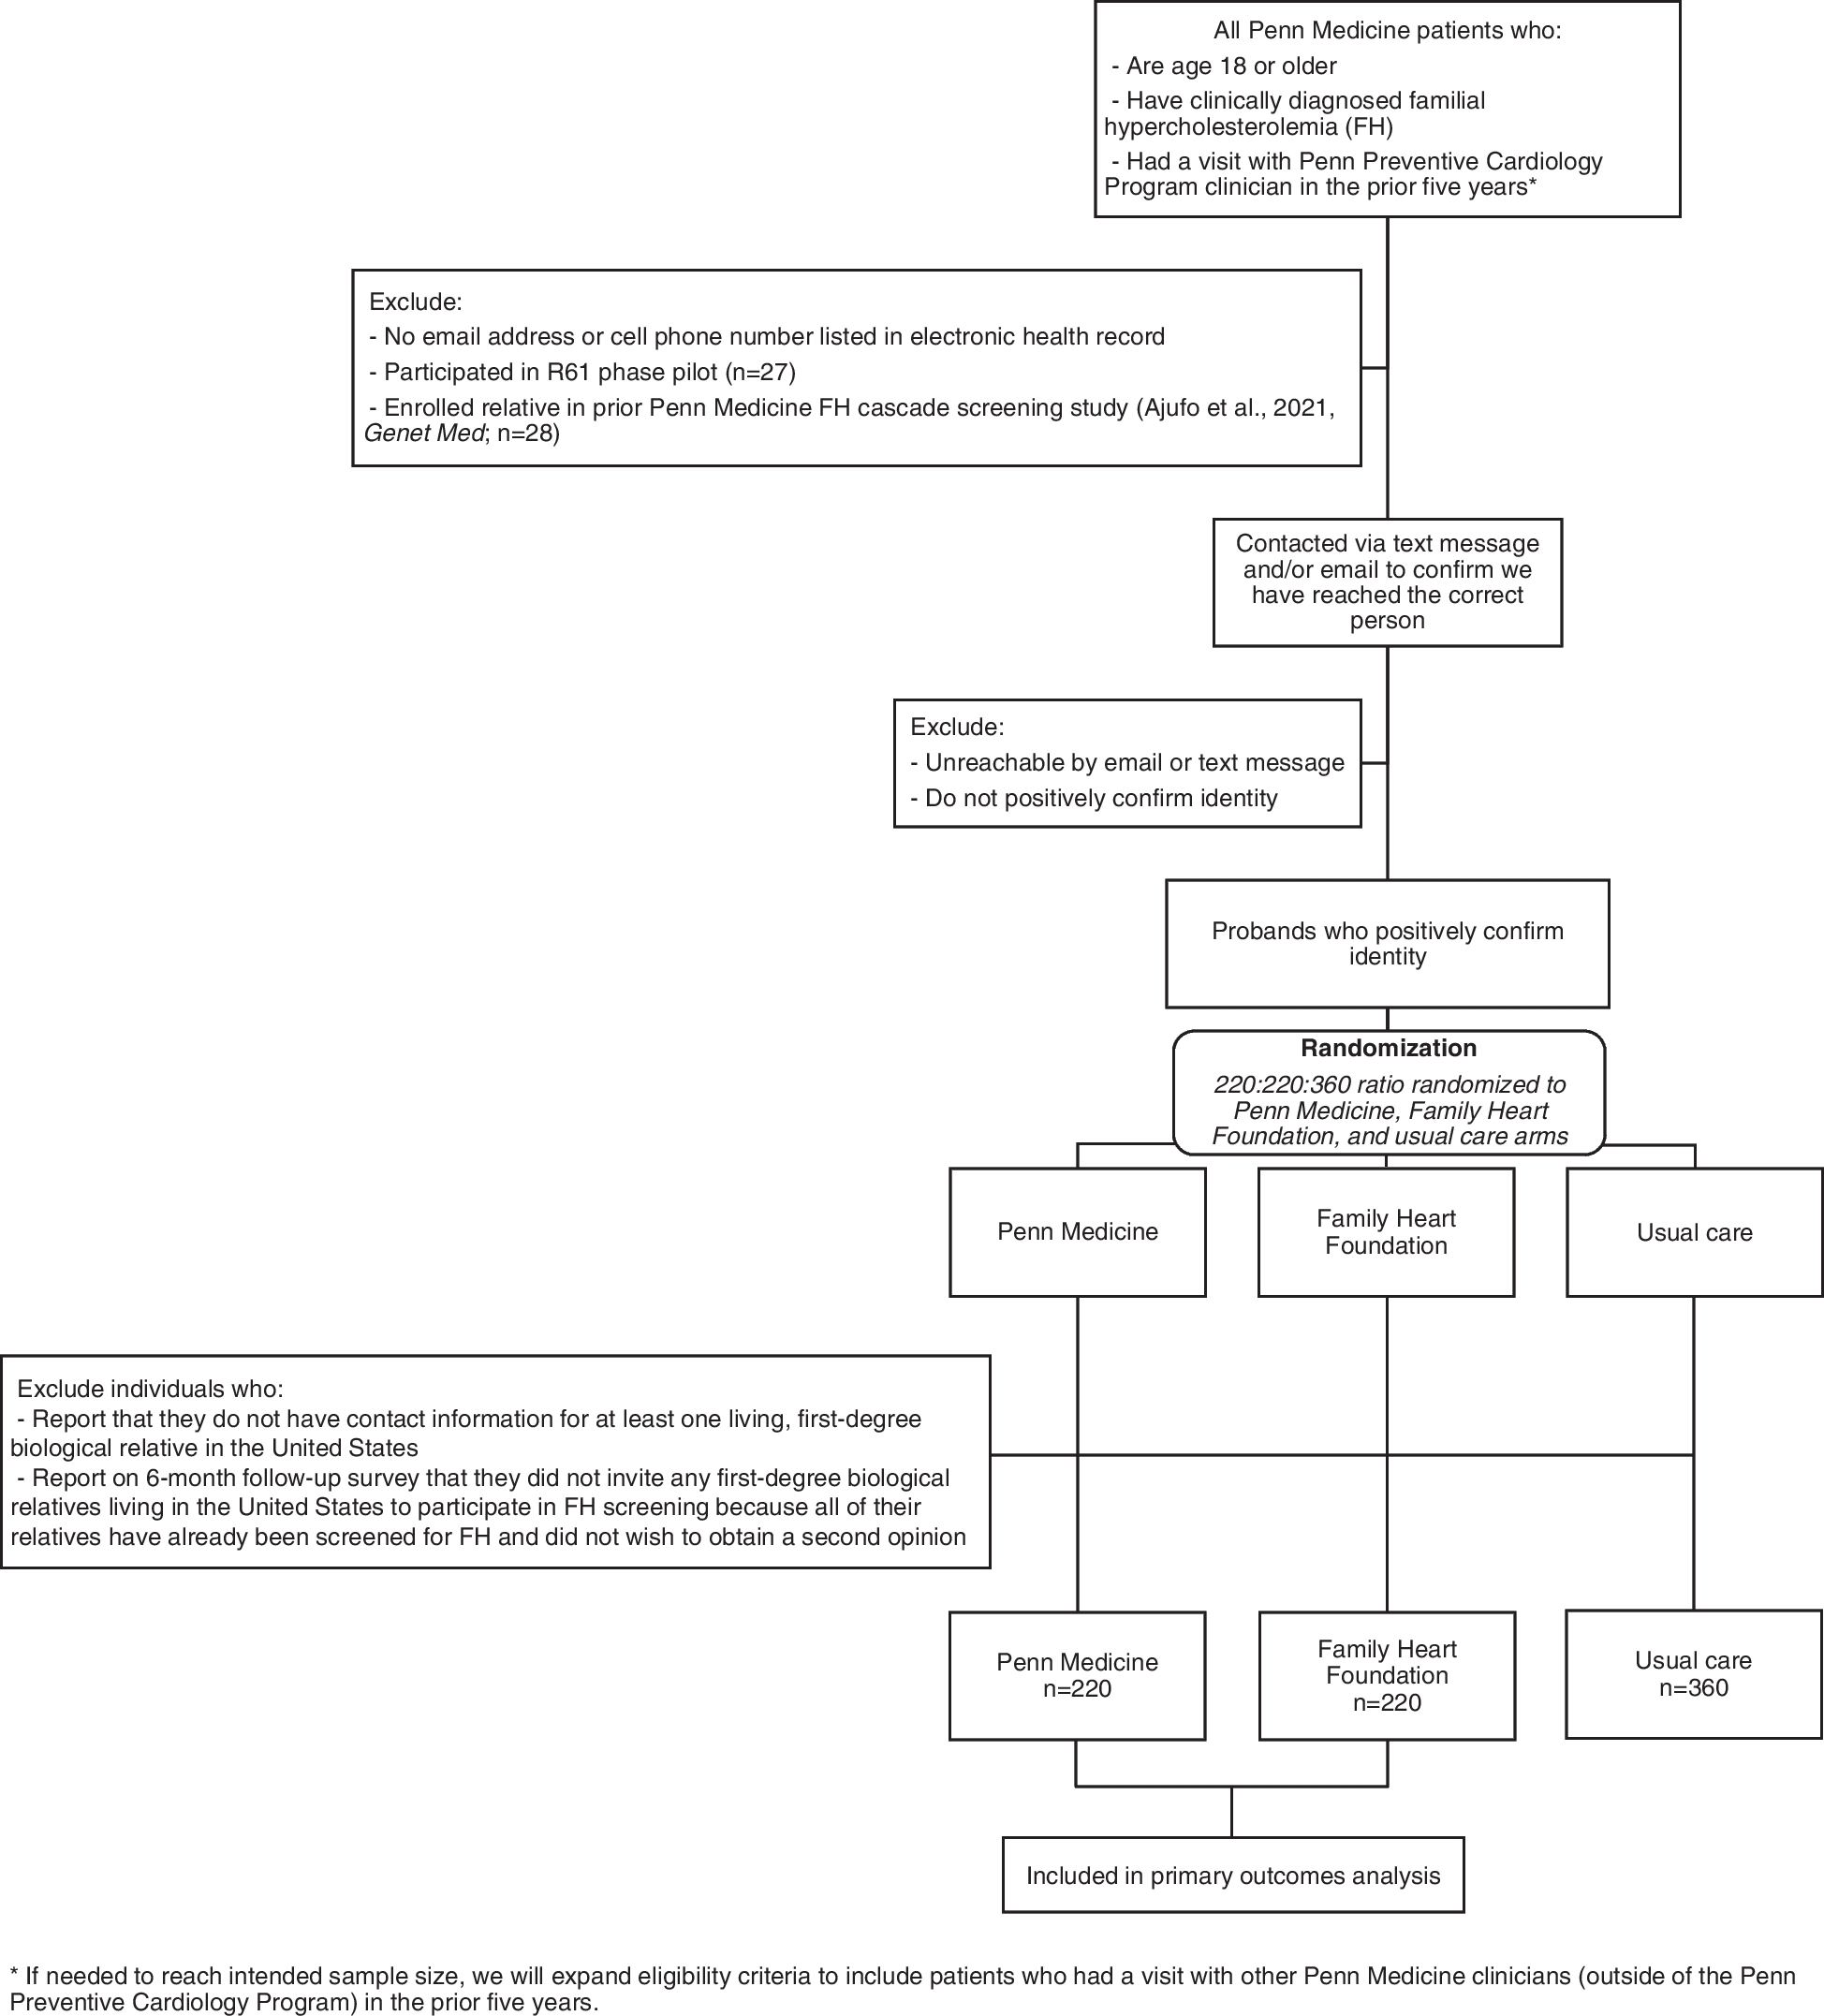
A total of 55 providers from 3 to 5 primary care clinical organizations will be randomized 1:1 to either education or mobile video interpreting access, stratified by baseline interpreter use and clinic (phase 1; Fig. 2). Randomization will occur within REDCap, using a sequence generated by the study biostatistician and implemented by a research coordinator. After 9 months, providers with interpreter use in the top tertile (within strategy) will remain with the original strategy; those in the bottom two tertiles will be randomized 1:1 again, to continue the original strategy or to add the second strategy to the first (phase 2). After another 9 months of data collection, we will provide free access to both mobile video interpreting and educational modules to all enrolled providers and then track voluntary uptake by those not previously exposed for another 9 months (phase 3). Data collection will include administrative data to track interpreter use (primary outcome); patient surveys and qualitative interviews to determine diagnosis comprehension (secondary outcome) and communication quality; provider surveys and qualitative interviews to assess contextual and intrapersonal barriers and moderators; and visit video recording to capture additional barriers and determine fidelity of strategy implementation. We will assess each strategy’s effectiveness, alone and in combination, for improving professional interpreter use and patient comprehension. We will explore mechanisms by which these strategies work and evaluate the relative strategy-specific costs.
Fig. 2
SMART design depicting 2 rounds of provider randomization over 18 months with active data collection and 9 months of follow-up
Implementation strategiesOur selected implementation strategies target primarily intrapersonal barriers to interpreter use, although mobile video interpreting does so by altering the environment and resources (i.e., opportunities) available to that provider [37, 84]. Strategy assignment will thus happen by individual provider. However, knowing the importance of team, clinic, and patient-level factors for influencing provider behavior, we will also capture data at these levels. Detailed strategy specification, following Proctor’s recommendations [85, 86], is presented in Table 2.
Table 2 Detailed implementation strategy specification, following Proctor’s recommendationsWeb-based educational modulesThe education implementation strategy will consist of six 10- to 15-min web-based modules, a tip sheet with clinic-specific interpreter access and use information, and four 5-min booster modules, all delivered online, along with quarterly reports on interpreter use to the enrolled provider. Education aims to improve provider motivation and capability related to interpreter use, by increasing conceptual and technical knowledge, enhancing interpreter access skills, shifting beliefs about their own capabilities and the consequences of use or nonuse, and increasing the intention to use an interpreter.
The educational module content is based on Seattle Children’s Hospital’s rigorously developed in-person workshop series, CONNECTing Through Interpreters [49,50,51,52]. In partnership with the interactive Medical Training Resources (iMTR) group at the University of Washington (UW; depts.washington.edu/imtr/) and content experts including experienced interpreters and providers, we transformed the workshops into interactive web-based modules. Modules were pilot tested with 15 primary care providers (PCPs) and revised based on feedback. Module-assigned providers will view them at a time and place they choose. We will track when participants access and complete modules as a marker of engagement.
The online modules cover 5 topics: (1) importance and fundamentals of good communication (delivered in 2 modules), (2) importance of professional interpreter use and disparities for populations with language barriers, (3) how to use an interpreter effectively, (4) what to do when the interpreted encounter is not going well, and (5) remote interpreter use and system’s challenges. Each module is 10–15 min long with audio, visual, and video content, developed using best practices from adult learning theory. Providers will be prompted to view a new module each week until all have been viewed.
During months 3–6 post-randomization, 4 brief (5 min) booster modules will be released, reviewing crucial points from initial modules. Boosters have been found to support behavior change in other settings [87]. Weekly reminders will be sent until they are complete. Providers who complete all modules will be eligible for points for continuing medical education (CME) and/or Maintenance of Certification (MOC); these points must be earned to maintain medical licensure and board certification and thus provide incentive for completion.
The clinic-specific interpreter access and use information will be distributed via email. This sheet will include instructions for accessing interpreters in their clinic via the normal process, including the vendor phone number, tips for using the clinic telephones (e.g., how to adjust the speakerphone volume), ideas for streamlining the process, where shared equipment is stored, and how to report problems.
Feedback to enrolled providers will be provided quarterly with both strategies, as a report of the percent of visits with patients who use a language other than English for which the provider used professional interpretation.
Mobile video interpreting accessThe mobile video interpreting access strategy will provide access to mobile video interpreting, technical support, a tip sheet for mobile video interpreting use, and an extra charger, shock-resistant case, disposable antimicrobial sleeves, and a positioning stand to support clinical use of the provider’s own device, along with quarterly reports on the enrolled provider’s interpreter use. Mobile video interpreting-assigned providers can use a study-issued smartphone instead of their own. The mobile video interpreting strategy aims to improve provider motivation, capability, and opportunity related to interpreter use, by decreasing cognitive overload, enhancing interpreter access skills, shifting provider beliefs about capabilities and the consequences of interpreter use, reinforcing use via satisfaction, and altering the environmental context and resources to make access easier and use more rewarding (Table 2).
Access to mobile video interpreting is achieved by downloading the application (app) online and then entering an access code linked to a billing account; after being entered, the code is no longer visible. Access can thus be controlled by study staff. Study staff will download and orient providers to the app, demonstrate use, and answer questions. Technical support will be offered on demand. A tip sheet will be emailed that includes mobile video interpreting instructions and best practices.
Several interpretation vendors have similar apps that can be downloaded onto personal devices but are rarely used in this way. These apps are HIPAA compliant, use end-to-end encryption, and are accessed with one touch (i.e., no additional log in or passwords); no data is downloaded to the device.
Feedback to enrolled providers will be provided quarterly with both strategies, as a report of the percent of visits with patients who use a language other than English for which the provider used professional interpretation.
Study populations and settingProvidersWe will enroll 55 PCPs from 3 to 5 primary care organizations in Washington state. These organizations will include both academically affiliated and nonacademic sites and vary in terms of leadership and governance structures. Clinics will enroll based on provider interest, but each provider will choose whether to enroll. Eligible providers will practice at the enrolled clinic at least 40% time and see at least 7 patients requiring interpretation per month, on average. If the provider is proficient in a non-English language, they will see at least 7 patients per month who use a different language (in which they are not proficient). We will enroll and initially randomize 55 providers, to retain 47 through the second interview and 40 through the third (73% retention; see next section for sample size considerations).
PatientsWe will enroll 3 populations of adult patients or parents of pediatric patients (henceforth “patients”) who use a language other than English, all being seen by enrolled providers. For our administrative population, we will include administrative data from all patients who were recorded as using a language other than English in the medical record and were seen by enrolled providers, for the interpreter use outcome. For our survey population, we will enroll patients who prefer medical care in the four most common non-English languages across clinics, who are in clinic for an acute concern (e.g., sore throat, new ankle pain). These individuals will be invited to complete a survey (n = 648), and a subset will be invited to complete a 20–30 min qualitative interview (n = 75). We will also recruit patients for our video-recording population (n = 100). Patients who use a language other than English with any visit type who consent will be eligible for video recording.
Data collection, study measures, and sample sizeOutcome measures include our primary implementation outcome of interpreter use and our secondary effectiveness outcome of patient/parent comprehension. Additional measures related to organizational context, provider-reported barriers and facilitators of interpreter use, and intervention fidelity are laid out in Table 1.
Interpreter useInterpreter vendor invoices will be collected from companies that clinics currently contract with; mobile video interpreting invoices will be managed by the study team. All professional interpreter invoices (not just mobile video interpreting) will be matched to clinic visits for patients who use a language other than English (all languages) for enrolled providers. We will calculate baseline interpreter use for enrolled providers for the six months pre-randomization and then randomize 1:1 to education or mobile video interpreting, stratified by baseline use and clinic. We will calculate interpreter use, both overall and strategy consistent, continuously throughout phases 1–3; other data collection will end after phase 2.
For analysis, interpreter use will be defined as a dichotomous variable at the level of the clinic visit. Visits with patients who use a language other than English with any billed professional interpreter use will be coded as “yes,” and the remainder will be coded as “no.”
Sample size calculations consider aim 1 group comparisons (mobile video interpreting, education, combination) at the end of phase 2. We assume loss of up to 9 providers (e.g., to job change; 16%) over the study; we expect attrition (up to 27%) in provider interviews and surveys, but that will not impact aim 1 power. With 5796 total encounters with patients who use a language other than English (7 visits/provider/month), we expect 1932 non-English visits per group, which will provide > 80% power to detect a 5% difference in proportion of professionally interpreted visits by groups [46, 57]. This will be readily feasible with administrative data.
Patient/parent comprehensionPatient comprehension will be determined by asking surveyed patients (n = 648) to report the diagnosis they received during their visit with an enrolled provider. The parent-reported diagnosis will then be compared to the provider-documented diagnosis, which trained abstractors will have abstracted from the EMR. Two coders blinded to study assignment will compare the documented diagnosis to the patient-reported diagnosis to determine comprehension, coded as yes, concordant; no, not concordant; or unclear, based on the standard of whether a different follow-up provider would likely know the diagnosis based on the information provided by the patient. For analysis, comprehension will be coded as yes or no/unclear. We have successfully used these procedures previously [46].
In addition to measuring comprehension, the survey will use validated measures to collect demographics and satisfaction with communication and interpretation. The tablet-based survey will have an audio feature to allow patients to read or hear the questions in 4 non-English languages. The survey will be completed in the clinic whenever possible; otherwise, the patient will complete it within 7 days, independently online or over the telephone with a bilingual research coordinator or professional interpreter.
Based on aim 1 analyses, with 216 completed patient surveys per group (648 total), we will have ≥ 80% power to detect a 14% difference in diagnosis comprehension by group [46]. This will also be feasible, achieved by surveying 7–12 patients per clinic per month for 18 months.
Provider attributes and organizational contextThese data will be collected via 2 surveys and 3 interviews over the course of the study. Providers will complete a web-based survey at baseline, before initial randomization, to assess demographics and barriers to interpreter use via the TDF Questionnaire, [74] Organizational Readiness for Implementing Change (ORIC) questionnaire [80], and the Implementation Leadership Scale (ILS) [81]. We will repeat the survey at the end of phase 2, to capture changes over time and provider time and costs associated with the implementation strategies.
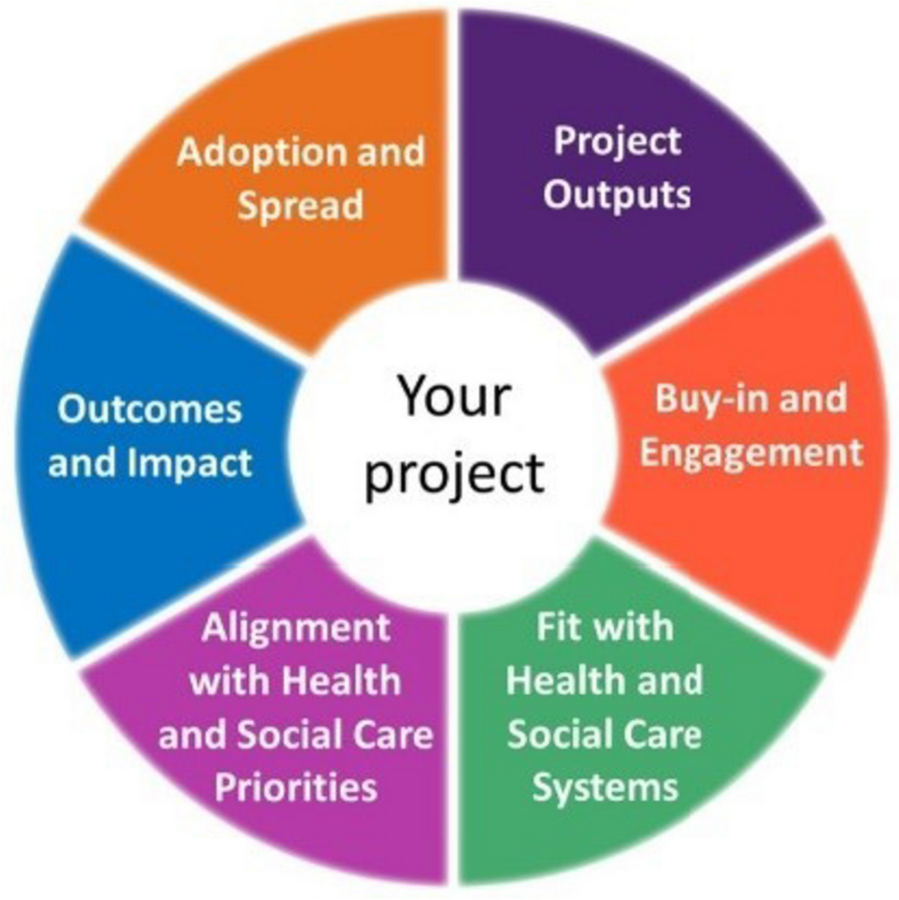
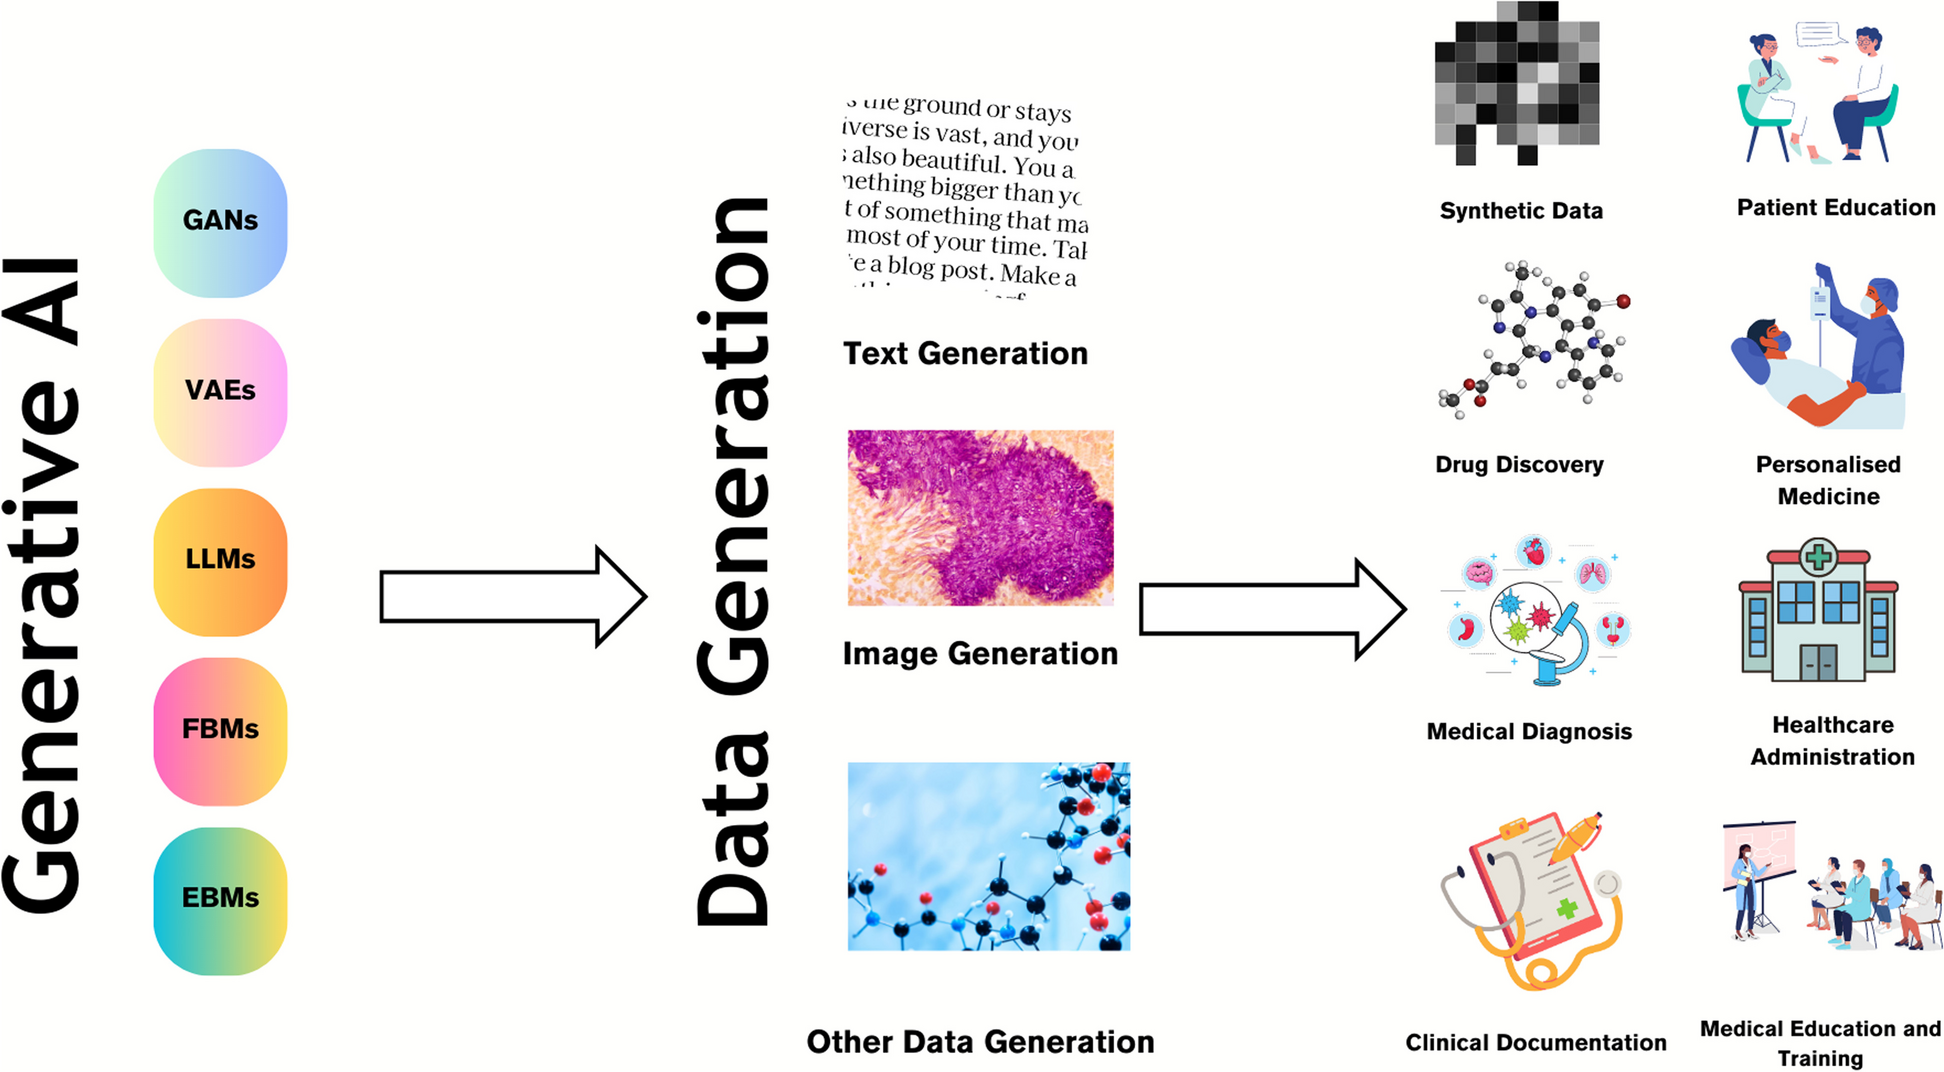
Enrolled providers will also complete qualitative interviews (1) before initial randomization, (2) during phase 1, and (3) during phase 2. Interviews will explore contextual and personal factors that serve as barriers, moderators, mechanisms, and proximal outcomes of interpreter use (see Figs. 3 & 4 for preliminary causal pathway diagrams). We will use qualitative interviews given the lack of survey measures for many factors, and concern for social desirability bias, as providers may not endorse interpreter nonuse on surveys but may be more likely to in the context of a conversation. Provider qualitative and quantitative data will be analyzed together (see “Data analysis”).
Fig. 3
Preliminary causal pathway diagram for mechanisms associated with education as a strategy
Fig. 4
Preliminary causal pathway diagram for mechanisms associated with mobile video interpreting as a strategy
Patient communication experiencesA subset of patients completing the survey will be invited to complete a 30-min qualitative interview [88]. Survey respondents who endorse having a concern about how their provider communicated with them will be invited to interview [89], as will a random sample of others (total n = 75). Our goal is to understand how communication occurred during the visit, how effective the patient found that communication to be and why, and the details of any concerns the patient had. The interview will be completed in the clinic prior to departure whenever possible; otherwise, the patient will have 7 days to complete it, over the telephone with a bilingual research coordinator or via professional interpreter, in one of our 4 eligible non-English languages.
We estimated initial qualitative sample size based on the heterogeneity of our target group, the number of research sites, and the complexity of the areas of inquiry. The initial sample estimates will be adjusted as needed to achieve data sufficiency [90].
Video recordingVideo-recorded visits with patients who use a language other than English (n = 100) will provide granular, objective data regarding interpreter use, technical difficulties, communication delays, and provider use of best-practice techniques for communicating with an interpreter, to supplement provider- and patient-reported data. Trained coders will code videos for specific behaviors, based on the coding scheme developed previously [36], to provide data on barriers, mechanisms, proximal outcomes of interpreter use, and strategy fidelity (Table 1). The video recording sample size is based on our previous work and logistical considerations, with 100 recordings both feasible and likely to achieve data sufficiency.
Cost dataAdministrative cost data collected from clinics will include costs associated with interpreter vendor invoices and contracts; interpreter-specific clinic hardware (e.g., dedicated speakerphones); wireless Internet; and educational module development, following recommendations for economic analysis in implementation science [91]. Provider-incurred time and costs will be collected via the final survey, including time spent on each strategy, excess data charges associated with mobile video interpreting use (if any), and wear or damage to personal devices. Study team time related to implementing each strategy (e.g., installing mobile video interpreting, reminder emails) will be tracked in real time, as they would be performed by clinic staff with real-world implementation. We do not expect changes in clinic visit length, based on time-motion studies of interpreted patient visits [92, 93].
Data analysisPrimary quantitative analyses will be conducted using an intention-to-treat approach. Provider and patient characteristics will be summarized overall and by strategy. Missing data will be minimized through communication with participants regarding the importance of completing surveys and interviews, participant incentives, offering multiple languages and modalities for survey and interview completion, and completing surveys and interviews on-site when possible. For our primary outcome, we expect interpreter invoice data to be complete, given our previous experience [12, 46, 57]. We will track interpreter use for all enrolled providers for the entire study, even if they do not complete interviews or surveys. For our secondary outcome, diagnosis comprehension, patterns of data missingness will be examined. We expect randomization will help protect against imbalance in unobserved confounders, so our main concern will be with missing data. We will conduct sensitivity analyses based on multiple imputations to assess the impact of missing data, in which we will generate multiple imputed datasets with missing values imputed by pooling information from observed data, and then combine statistical inferences across the multiply-imputed datasets [94,95,96].
Aim 1: Compare the effectiveness of two implementation strategies, alone and in combination, to improve use of interpretation and comprehension for patients/parents with language barriers seen in adult/pediatric primary care settingsWe hypothesize that, compared to educational modules, provider access to mobile video interpreting will lead to (H1) greater odds of interpreter use for visits with patients/parents with language barriers (primary outcome) and (H2) better comprehension among patients/parents with language barriers. We also hypothesize (H3) that mobile video interpreting and educational modules together will yield greater odds of interpreter use than either strategy alone.
To test H1 and H3, we will use assigned strategy and data collected during phases 1 and 2. Under the SMART design, comparisons of first-stage interventions, comparisons of second-stage interventions, and comparisons of the adaptive intervention with both stages can be conducted simultaneously using standard software with a technique called a “weighted and replicated” regression approach, using weighted generalized estimating equations (GEE) [66, 97]. Weighted GEE allows us to work with binary outcomes and weights and adjust for clustering within providers. Within-clinic correlations will be assessed by including clinic-specific random effects in our regression models and estimating the intra-cluster correlation coefficients. Significance of the intra-cluster correlation coefficients will be examined by comparing models with and without clinic-specific random effects using likelihood ratio tests. If no strong within-clinic correlation is detected, we will use fixed-effects regression models for their better power; otherwise, estimates and inference based on random-effects regression models will be reported. H1 and H3 will be tested using the Wald test and robust standard error estimates [66, 97]. Model-based estimates of odds ratio comparing education to mobile video interpreting or both will be reported, along with 95% confidence intervals [98].
To test H2, our analytic sample will include only patients who completed a post-visit survey (n = 648). A weighted GEE logistic regression model predicting patient/parent comprehension at the visit level will be estimated. Baseline covariates will include the clinic, patient demographics (age, sex, language), and patient comorbid conditions [99,100,101,102], pooled at the provider level. Model-based estimates of the odds ratio comparing education to mobile video interpreting or both will be reported, along with 95% confidence intervals computed via parametric bootstrapping [98].
Aim 2 Explore mobile video interpreting and education implementation strategies’ ability to activate putative provider-level mechanismsWe predict that implementation via mobile video interpreting will activate mechanisms that are more directly and strongly linked to provider behavior, while education’s mechanism activation will more often affect intrapersonal barriers without changing behavior.
We will use a quantitative plus qualitative approach to explore putative mechanisms, where both are analyzed together to understand data in context [88]. Interviews will be audio-recorded, transcribed, translated as appropriate, and reviewed for accuracy. Using an iteratively developed codebook, we will code all data stratified by interpreter use and TDF attributes, upload data into Dedoose Version 9.0.17 for thematic analysis [103,104,105], and use the 6 analysis steps outlined by Braun and Clarke [106]. Data synthesis will be conducted from code reports utilizing an annotation and tabular system. We will analyze provider and patient data separately.
Video-recording analysis will be based on our previously developed coding scheme [36], with modifications based on coding the first 5 videos. We expect coding to include communication/interpretation method, duration, interpretation technical difficulties (e.g., dropped calls), interpreter or device positioning in room, provider use of jargon and acronyms, and clarifications between provider and interpreter. Initial videos will be double coded, until kappa statistics for interrater reliability are greater than 0.75. Subsequent videos will be single coded, with a random 10% double coded. Fidelity to assigned strategy will be defined as use of mobile video interpreting for assigned providers and use of best practices for communicating through an interpreter for education-assigned providers.
Qua
留言 (0)