Clinical sample collection
Serum samples from healthy volunteers (female 9 and male 11, average age 42.7 ± 6.3 year) and RA patients (female 12 and male 8, average age 47.5 ± 5.6 year) who received joint replacement of the knee joint were collected in the Hainan General Hospital (20 samples for each group). All RA patients fulfilled the American College of Rheumatology criteria for classification of disease [18]. The healthy control specimens were from patients with joint trauma undergoing joint replacement surgery, who were free from autoimmune or inflammatory diseases. Participants signed the informed consent forms and the Ethics Committee of Hainan General Hospital approved the procotol (approval number: 2012233).
Cell culture and treatment
Synoviocytes (HUM-CELL-0060, Wuhan PriCells Biomedical Technology, China) were cultured in Dulbecco’s modified Eagle’s medium (DMEM; HyClone, South Logan, UT, USA) supplemented with 10% heat-inactivated fetal bovine serum (FBS, GIBCO, Grand Island, NY, USA), 100 U/mL penicillin, and 100 μg/mL streptomycin (HyClone) and were incubated in a 5% CO2 incubator at 37 °C. For RA cell model treatment, synoviocytes were treated with 1 µg/mL lipopolysaccharide (LPS; Sigma-Aldrich, St. Louis, MO, USA) for 24 h.
Cell transfection
The full-length cDNA of YY1 and SIRT1 was amplified and integrated into the pcDNA-3.1 expression vector (Invitrogen, Carlsbad, CA, USA). Cell transfection was carried out according to the standard protocol using Lipofectamine 3000 (Invitrogen). After 48 h, the cells were used for subsequent experiments.
Cell counting kit-8 (CCK-8) assay
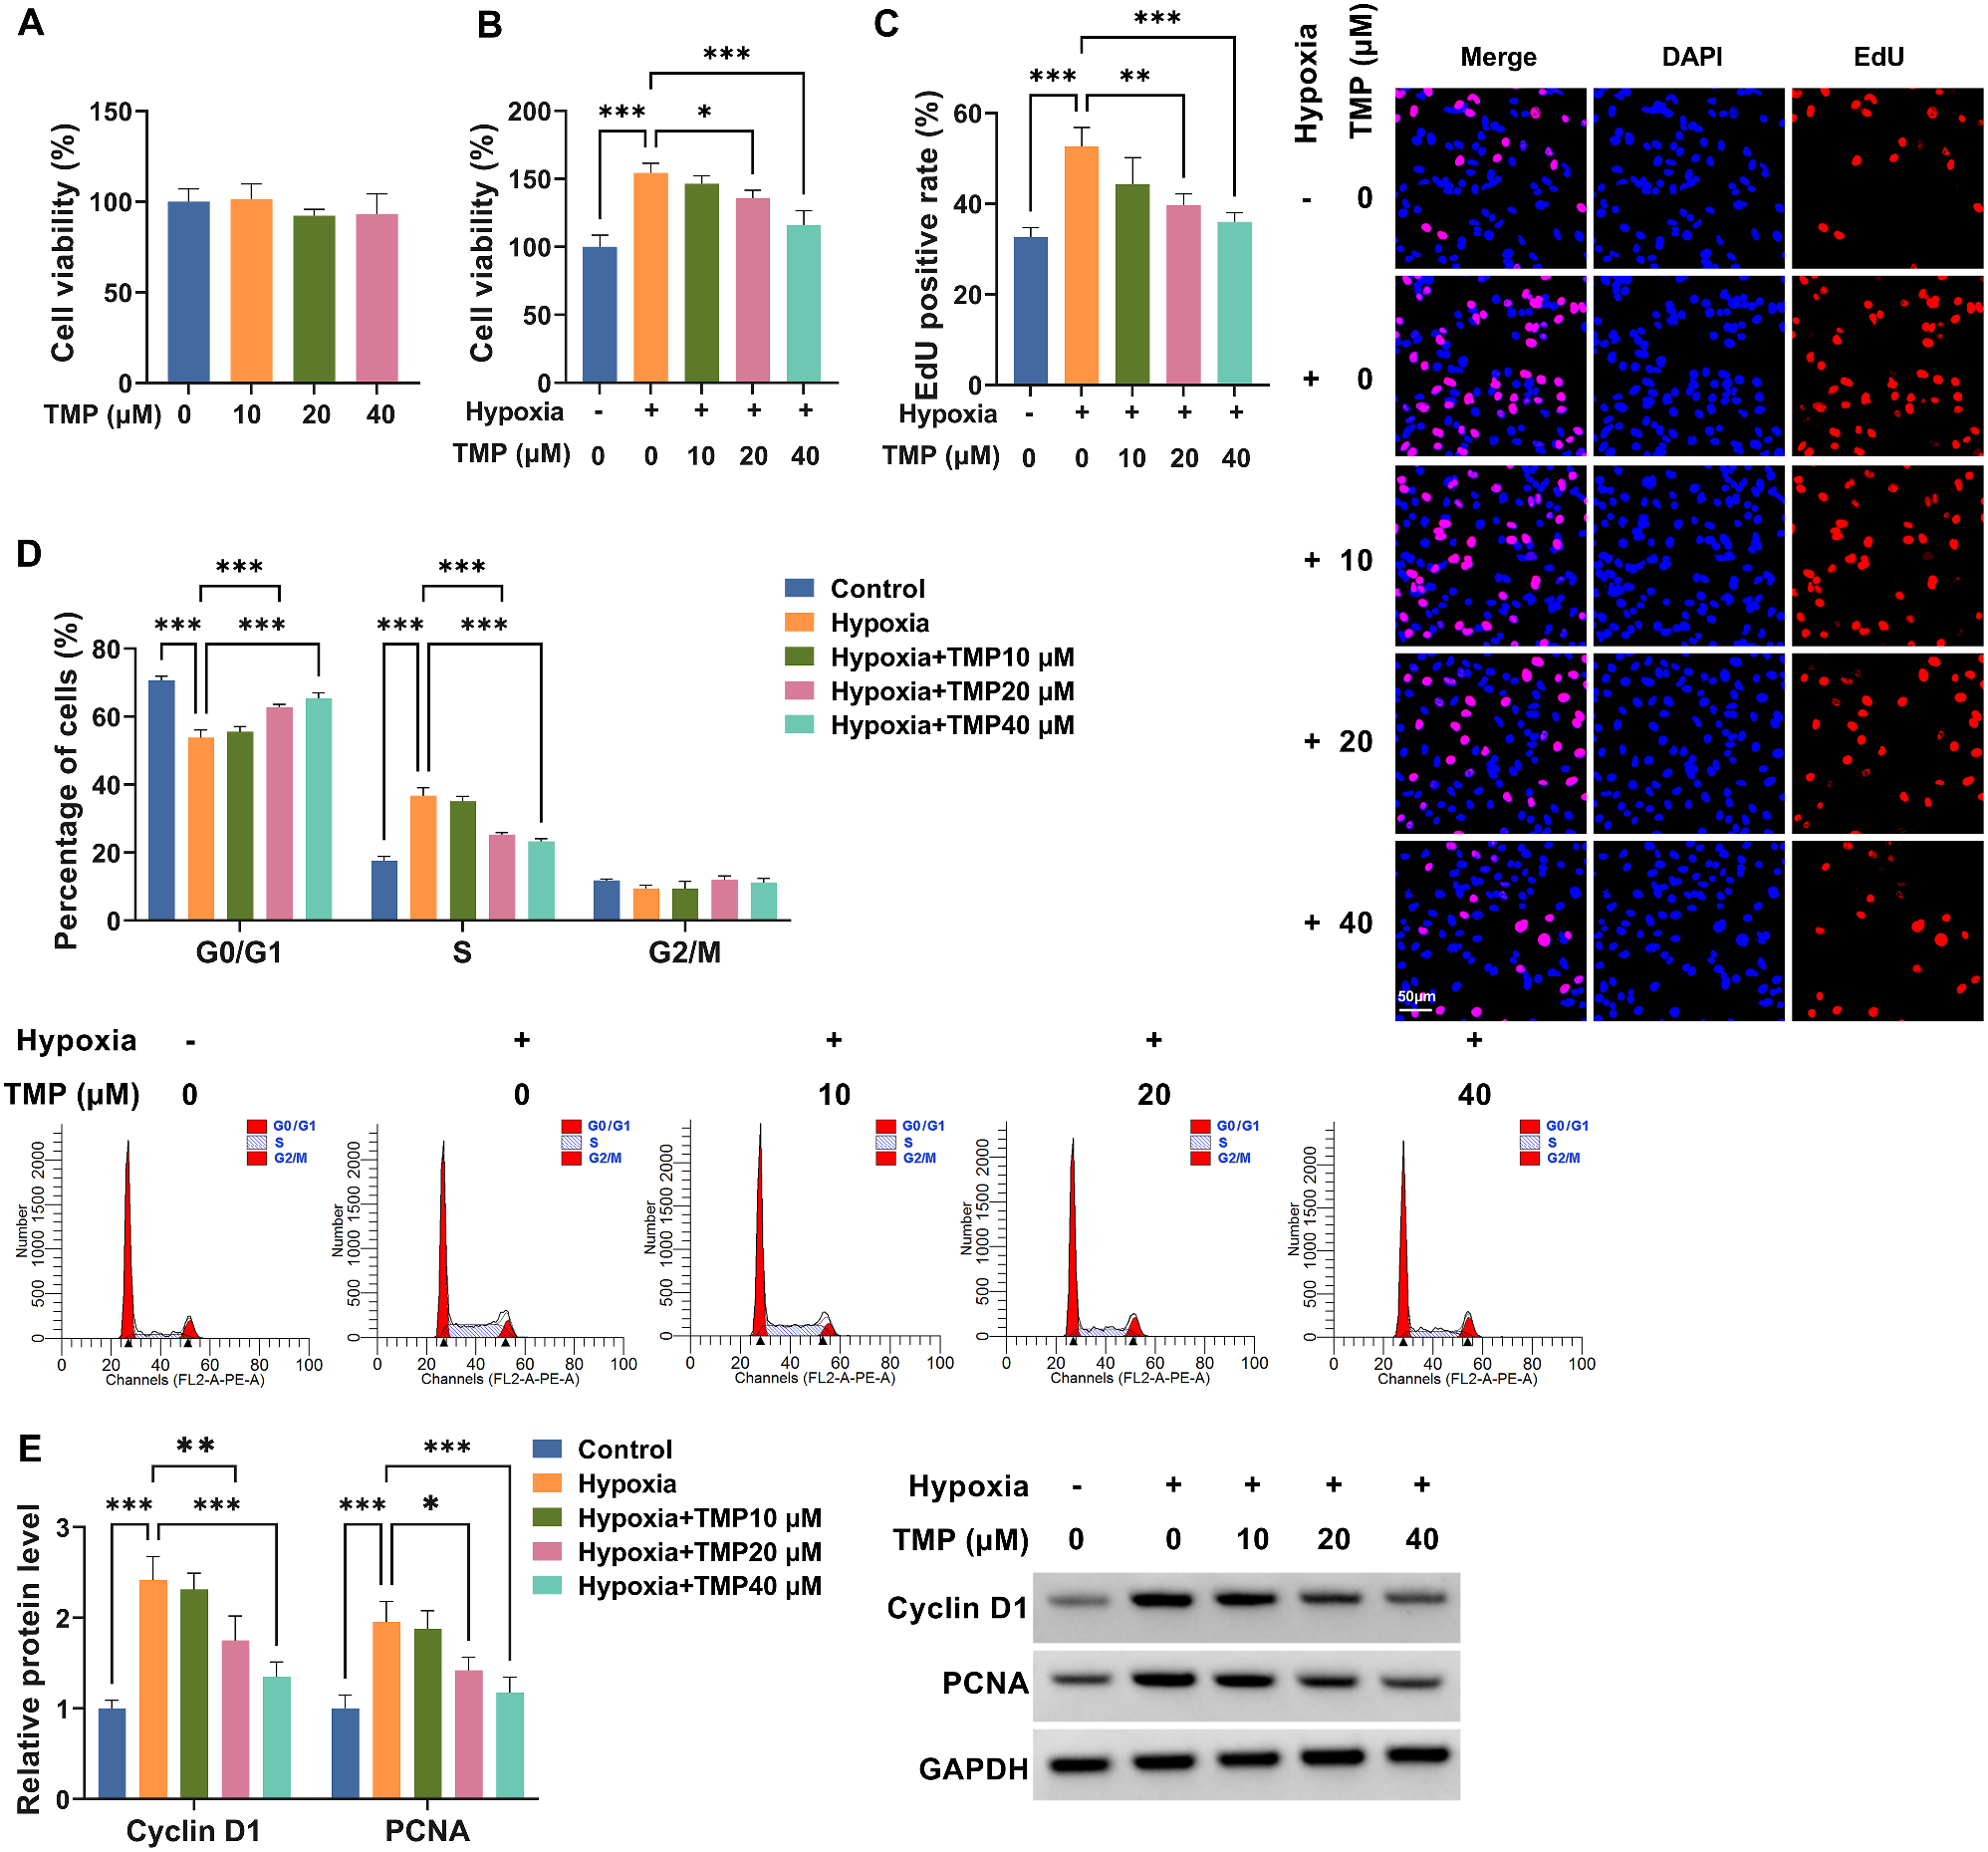
The cell viability was assessed by a CCK-8 assay (Beyotime, Jiangsu, China). The cells were seeded into a 96-well plate and then cultured at 37℃ for 48 h. Next, 10 µL of CCK-8 reagent was added, and the cells were incubated at 37℃ for an additional 2 h. The optical density (OD) of the solution was then measured at 450 nm to assess cell viability.
Glutathione (GSH)/oxidized GSH (GSSG) detection
Anticoagulant treated blood samples were centrifuged at 1000 × g for 10 min at 4 °C. Then, the top plasma layer was transferred to a new tube, followed by addition with 1/4 vol of 5% SSA. The samples were added in a 96-well plate and GSH/GSSG ratio was detected using a GSH/GSSG Detection Assay kit (#ab138881; Abcam, Cambridge, MA, USA), following the manufacturer's protocols.
Iron level measurement
The intracellular ferrous iron level (Fe2+) were detected using the iron assay kit (#ab83366, Abcam). Synoviocytes seeded in 24-well plate were washed with cold PBS twice and then lysed with cell lysis buffer for 2 h, followed by addition with the iron reducer into the collected supernatants. Finally, iron probe was added for 1 h, and the content was immediately measured on a colorimetric microplate reader (OD 593 nm).
Detection of ROS level
After relevant stimulation and/or treatment, cells were cultivated in a 24-well plate at 37 °C in serum-free medium for 6 h. Cells were then rinsed using PBS and stained with 10 μM DCFH-DA (Sigma-Aldrich) for 20 min in dark. Finally, these cells were washed with PBS and the fluorescence was observed with a confocal laser scanning microscope.
RNA extraction and quantitative real-time (qPCR)
TRIzol reagent (Thermo Fisher Scientific, Waltham, MA, USA) was used to obtain total RNA from the synoviocytes or clinical samples. A NanoDropTM 2000 spectrophotometer (Thermo Fisher Scientific) was utilized to assess the RNA quality. The RNA samples were used to synthesize cDNA by using a Primescript RT reagent kit (Takara, Dalian, China). qPCR was then performed according to the directions of the SYBRTM Green master mix (TaKaRa, Tokyo, Japan). The primers used in this study were listed in Table 1.
Table 1 Primer sequences for qPCRWestern blot
The cells were collected and lysed in RIPA buffer (Beyotime) to extract total proteins. Equal amounts of protein (30 µg) were separated on a 10% SDS-PAGE gel, and then transferred to a PVDF membrane (Invitrogen). The membrane was blocked with 5% skim milk powder in tris-buffered saline tween (TBST). The membrane was then incubated overnight at 4℃ with the following primary antibodies: SIRT1 (#ab110304, Abcam), YY1 (#ab227269, Abcam). Next, the membrane was washed 3 times in TBST for 5 min each and then incubated with HRP-conjugated secondary antibody for 2 h at room temperature. After washing, the protein bands were analyzed by an ECL detection kit (Beyotime).
Dual-luciferase reporter assay
Synoviocytes were seeded into a 24-well plate, and the cell density had increased to 60–70% per well on the second day. Two groups were set up as pcDNA3.1 and pcDNA-YY1 (dual-luciferase reporter plasmid was purchased from HonorGene, China). After 48 h, luciferase activity was detected by a dual-luciferase reporter kit (Promega, Madison, WI, USA) and expressed as relative activity.
Chromatin immunoprecipitation (ChIP) assay
The binding of YY1 to the SIRT1 promoter was examined using ChIP assay with pierce magnetic ChIP kit (Thermo Fisher Scientific), according to the manufacturer's protocol. Cells were fixed with formaldehyde (1%) for 10 min at room temperature. YY1 antibody (#ab227269, Abcam) was utilized to generate immunoprecipitants, whereas an IgG antibody (#sc-69786, Santa Cruz Biotechnology, CA, USA) was used as the blank control group. The recuperated DNA fragments were evaluated via qPCR. The relative level of SIRT1 promoter was normalized to the average level of the IgG group.
Statistical analysis
Statistical analysis was performed with SPSS 22.0 software and GraphPad Prism 8.0. The data were expressed as the mean ± SD and assessed normality by Shapiro–Wilk test, followed by analyzed homogeneity of variance utilizing Bartlett's test. After analysis, all the data were consistent with normal distribution and homogeneity of variance. Then, the unpaired student's t-test was used for statistical analysis between two groups, and one-way analysis of variance followed by Tukey's test was used for comparison between multiple groups of data. The correlations were analyzed using Pearson's correlation coefficients. P < 0.05 was defined as indicating statistical significance.


留言 (0)