
記住我
The United States spent 19.7% of the gross domestic product on health care in 2020.1 This is almost twice as much as the average OECD country, yet the United states continues to lag in many population health measures.2 As a result, policymakers are deeply interested in leveraging alternative payment models (APMs) as a tool for controlling the growth in health care costs and improving care quality.
In 1977, Maryland received a waiver from the Centers for Medicare and Medicaid Services (CMS) that allowed the state’s rate-setting commission to establish a hospital-specific uniform rate for health care services across all payers (ie, Medicare, Medicaid, and commercial patients).3 This waiver granted significant control over their health care spending. Later, when concerns about excessive volume and spending arose, Maryland introduced the global budget revenue (GBR) model in 2014.4 Implemented statewide, each hospital’s budget is prospectively set by trending its historical revenue forward and adjusting for factors such as inflation, patient volume shifts, attainment of quality benchmarks, and market trends.5–7 This policy similarly includes all payers (Medicare, Medicaid, and commercial) and requires the state to meet specific spending (eg, expectation for $330 million or more in Medicare savings over 5 years) and quality targets, including reductions in rates of hospital readmissions and hospital-acquired conditions.8 The latter entails participation in the Maryland Hospital-Acquired Conditions Program, which focuses on complications that result from the course of care and treatment delivered and not on the progression of the underlying disease.9
Prior research has documented a statistically significant association between Maryland’s implementation of a GBR model and a dampening of hospitalization cost growth and reductions in the rate of avoidable complications and readmissions following major surgery.10,11 However, there is growing recognition among policymakers and health service researchers that broad-based APMs, such as GBR, might have wider consequences or “spillover effects” than those intended at the onset.12,13 These spillovers have significant ramifications for the evaluation of the performance of these APMs and the design of future payment reform.13 We postulate that the post-GBR period will be associated with an increase in the centralization of care for patients with complex surgical needs. This is because the clinical accountability for cost and outcomes is significantly stronger for hospitals in Maryland relative to other states where the prevailing fee-for-service system reimburses any activity, for example, 30-day readmission or avoidable complication. Consequently, Maryland hospitals are strongly incented by the GBR to allocate effort and resources towards the provision of cost-efficient and high-quality surgical services. In this environment, patients with complex surgical care needs may represent an excessive financial risk for low-volume hospitals and result in steerage towards high-volume hospitals where the necessary infrastructure and processes in place, for example, the use of care redesign pathways, investments in ancillary services and technologies (eg, interventional radiology, advanced imaging, intensive care), use of multidisciplinary treatment teams, and care transition programs.14
Our aim was to examine the association between Maryland’s implementation of the GBR model and the extent to which complex surgical procedures were centralized, if at all. We focused on a broad range of complex surgical patients and hypothesized that GBR implementation would incentivize Maryland hospitals to reallocate the care for these patients around high-concentration hospitals (HCHs), ie, centralization, as a strategy to reduce cost overruns and improve outcomes.
METHODS Study DesignThis synthetic panel study leveraged a difference-in-differences (DiD) framework to compare the change in centralization for complex surgery before (2010–2013) and after (2014–2017) implementation of the GBR model in Maryland. This study was approved by the Johns Hopkins Hospital Institutional Review Boards and was deemed exempt from informed consent, given our use of publicly available and de-identified data. Our reporting of results followed the Strengthening the Reporting of Observational Studies in Epidemiology reporting guidelines.15
Data SourceWe utilized the Healthcare Cost and Utilization Project state inpatient databases (SIDs) from 2010 to 2017. Given the statewide implementation of the GBR model in Maryland, our comparison population was drawn from New Jersey and New York. These states were selected because they shared a similar record and timing of Medicaid expansion with Maryland (January 1, 2014). This also satisfies the “common shocks” assumption for our DiD analysis, that is, an exogenous event that could potentially influence our outcome of interest but affects both treatment and control groups equally.16,17 Due to our interest in events associated with the index hospitalization (ie, site of care receipt), the all-payer SIDs provided the most complete and representative study population, capturing 97% of all eligible hospital discharges. Other databases would have been more segmented, that is, focused on public (Medicare, Medicaid) or commercial payers (Optum Clinformatics Data Mart, Health Care Cost Institute, or IBM MarketScan Research Databases) alone.10
Study PopulationThe study sample included adult patients (≥18 y) who underwent elective gastrectomy, pneumonectomy/lobectomy, proctectomy, or revision hip/knee arthroplasty between January 1, 2010, and December 31, 2017. These procedures were chosen because they are high cost, associated with considerable morbidity, and frequently the focus of centralization policies.18–29 Three eligible complex procedures (esophagectomy, cystectomy, and pancreatectomy) were excluded as they were noted to be highly centralized in Maryland before GBR enactment (Supplemental Figure S1, Supplemental Digital Content 1, https://links.lww.com/SLA/E319 and Supplemental Table S1, Supplemental Digital Content 1, https://links.lww.com/SLA/E319).30 Emergency procedures were excluded given their noted association with increased costs and higher risk of major complications.31 In addition, the Emergency Medical Treatment and Labor Act (EMTALA) mandates the stabilization and initial treatment for emergency conditions before transfer, potentially confounding our calculation of HCHs and our ability to reliably identify the site of receipt of definitive surgical care.32 We also initially excluded patients who received surgeries in the 10 rural hospitals participating in the Total Patient Revenue (TPR) model, an antecedent program to the GBR, starting in 2010. For these 10 hospitals, the payment policy (ie, implementation of caps on hospital revenue) changed in 2010 instead of 2014. Patients undergoing gastrectomy, pneumonectomy/lobectomy, or proctectomy were identified using the appropriate codes from the International Classification of Diseases, Ninth Revision, Clinical Modification (ICD-9-CM) and the International Classification of Diseases, Tenth Revision, Procedure Coding System (ICD-10-PCS). Patients receiving gastrectomy with morbid obesity (ICD-9-CM 278.01; ICD-10-CM E66.01) as the primary diagnosis were excluded. We did not limit other procedures by diagnosis. Health care Cost and Utilization Project assigned the Diagnosis Related Group (DRG) for each discharge record, regardless of the payer, using the Medicare DRG Grouper algorithm. Patients with hip/knee revision were identified using DRG 466, 467, and 468.
Assessment of CentralizationTo evaluate the degree of centralization for each complex surgical procedure, we calculated the hospital “concentration” each year, defined as the hospital volume divided by the total volume in the state. The hospital concentration was then joined to the patient sample.26 We then used our first observation period (2010) to establish the quartiles for hospital concentration and defined the top quartile (> 75th percentile) as the cut-off for designating HCHs in each subsequent year. This means the cut-off was held constant throughout the succeeding time periods of 2011 to 2017.26 This approach is consistent with published work and allows us to see the changes in the distribution of patients in HCHs, that is, the degree of centralization, with time.26
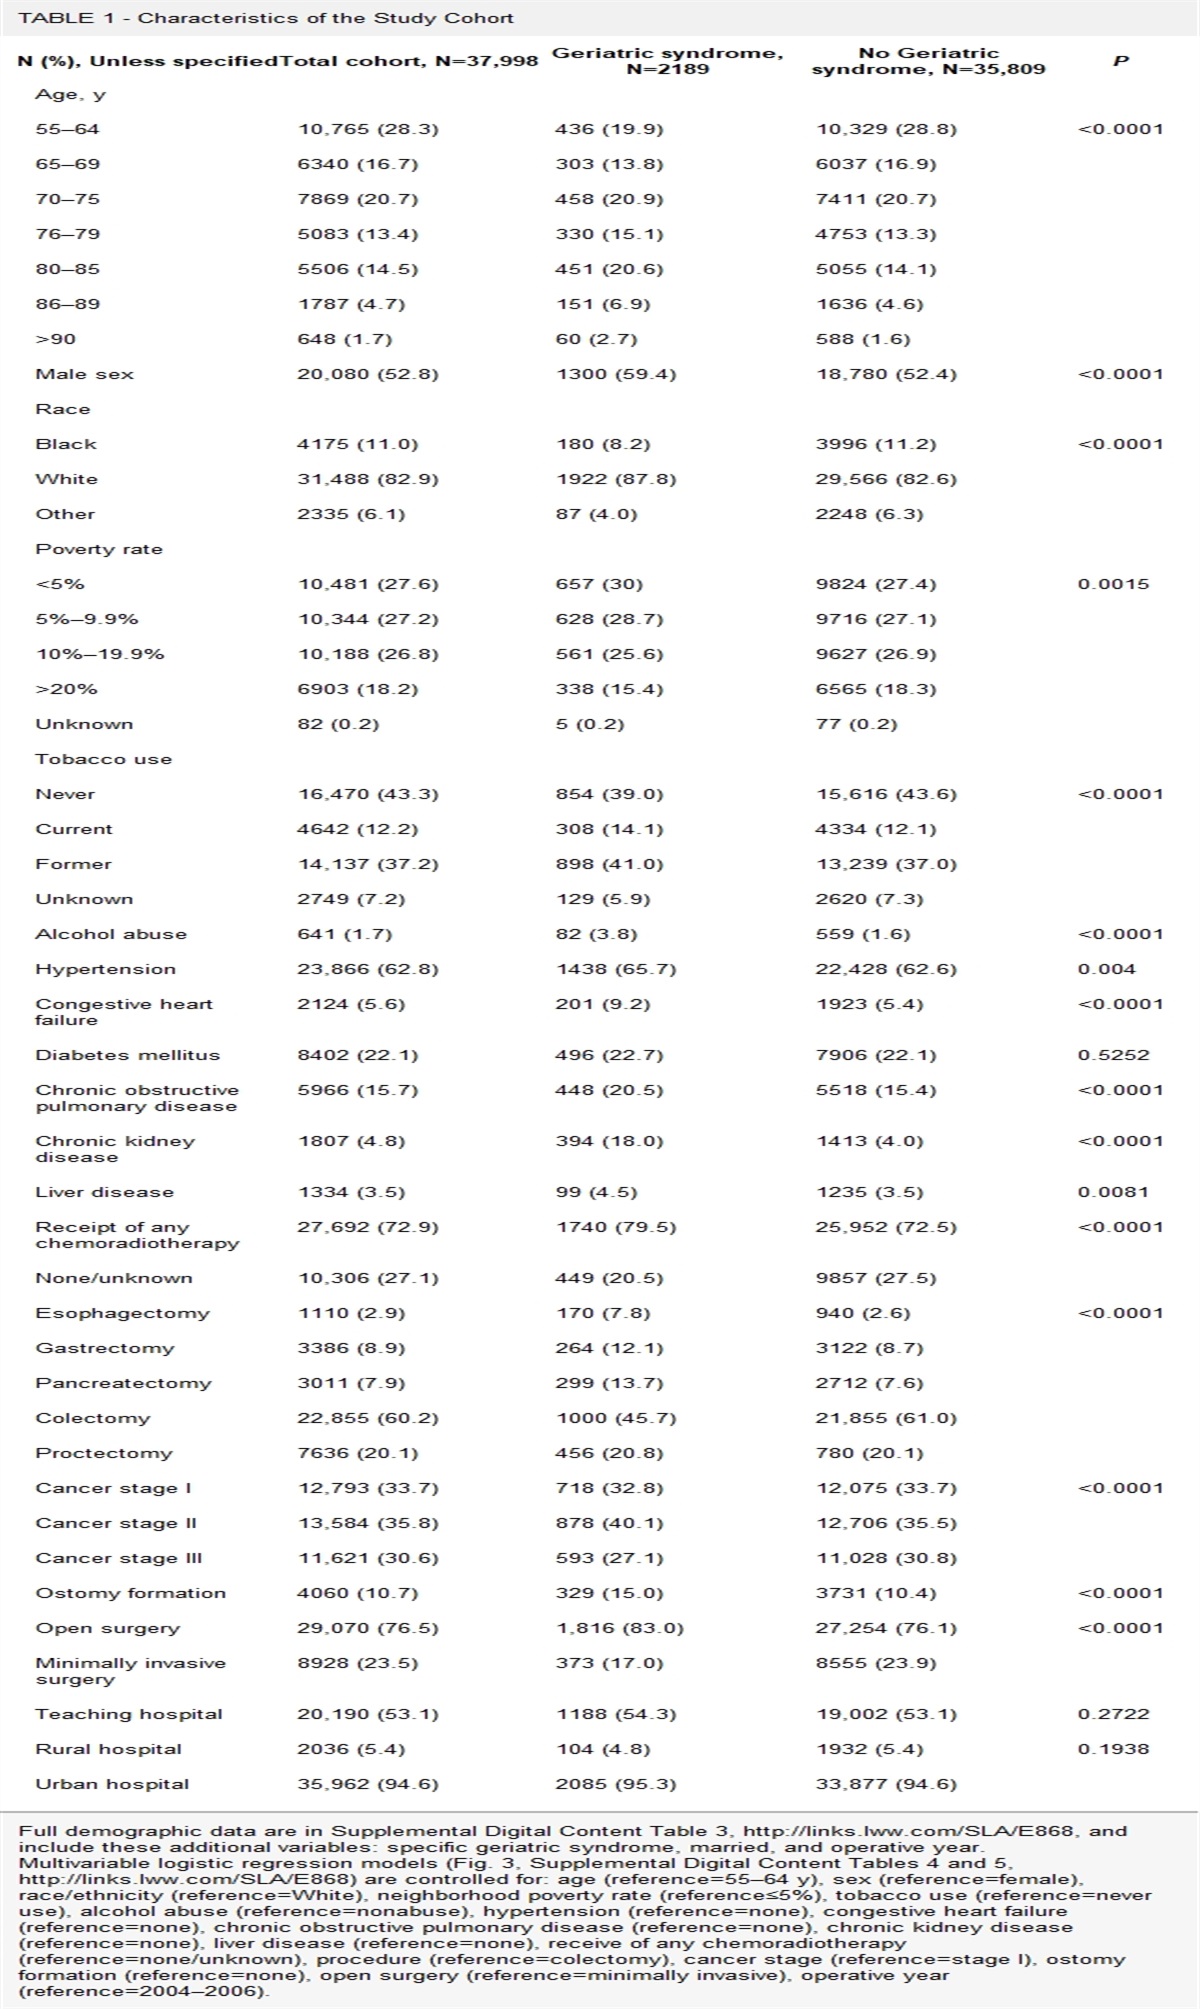
Statistical AnalysisDemographic and clinical characteristics of the study population in both Maryland and comparison states were described in Table 1. For each surgery, the proportions of patients receiving surgery in HCHs each year was calculated for both Maryland and comparison states (Fig. 1). To evaluate the difference of changes in centralization between Maryland and comparison states, we estimated the DiD in the probability of having surgery done is an HCH using a linear probability model, adjusted for patient age, sex, race/ethnicity (Asian/Pacific Islander, Black, Hispanic, Native American, White, or other), insurance type (Medicare, Medicaid, private insurance, self-pay, no charge, or other), comorbidity, hospital teaching status, health system membership, bed size, and location (rural or urban). These covariates were chosen on account of their established relationships with inter-facility surgical transfers, referrals to high-volume hospitals, and care regionalization.32,33 Patients with unknown sex, race/ethnicity, or insurance type (< 1%) were excluded from the adjusted analysis. In this model, the DiD estimator is expressed as an interaction term between the dichotomous indicator for Maryland versus comparison states and another dichotomous indicator for the years before GBR (2010–2013) versus after (2014–2017). The parallel trends assumption was examined using the data before GBR implementation.
TABLE 1 - Patient Characteristics in Maryland and Control States Gastrectomy Pneumonectomy/Lobectomy Proctectomy Hip/Knee Revision MD Control Std. Diff MD Control Std. Diff MD Control Std. Diff MD Control Std. Diff n, discharges 2708 13776 — 4847 25132 — 3383 20970 — 10124 41942 — n, hospitals 37 192 — 32 162 — 37 204 — 38 202 — Patient characteristics, n (%) Age, mean±SD 61.5±13.3 61.0±14.1 0.03 65.5±11.0 66.5±10.9 0.09 60.2±14.4 61.4±14.5 0.09 64.2±11.6 65.2±11.7 0.09 <50 487 (18.0) 2840 (20.6) — 355 (7.3) 1624 (6.5) — 723 (21.4) 4078 (19.4) — 959 (9.5) 3663 (8.7) — 50-59 606 (22.4) 3015 (21.9) — 952 (19.6) 4379 (17.4) — 869 (25.7) 5139 (24.5) — 2577 (25.5) 9535 (22.7) — 60-69 835 (30.8) 3759 (27.3) — 1692 (34.9) 8375 (33.3) — 899 (26.6) 5379 (25.7) — 3262 (32.2) 13283 (31.7) — 70-79 575 (21.2) 3019 (21.9) — 1445 (29.8) 8427 (33.5) — 582 (17.2) 4058 (19.4) — 2315 (22.9) 10513 (25.1) — 80+ 205 (7.6) 1143 (8.3) — 403 (8.3) 2327 (9.3) — 310 (9.2) 2316 (11.0) — 1011 (10.0) 4948 (11.8) — Sex — — 0.02 — — 0.02 — — 0.02 — — 0.04 Male 1372 (50.7) 7174 (52.1) — 2177 (44.9) 11146 (44.3) — 1667 (49.3) 10098 (48.2) — 4120 (40.7) 17830 (42.5) — Female 1335 (49.3) 6596 (47.9) — 2669 (55.1) 13980 (55.6) — 1715 (50.7) 10871 (51.8) — 6003 (59.3) 24109 (57.5) — Unknown 1 (0.0) 6 (0.0) — 1 (0.0) 6 (0.0) — 1 (0.0) 1 (0.0) — 1 (0.0) 3 (0.0) — Race/ethnicity — — 0.49 — — 0.47 — — 0.52 — — 0.61 Asian/Pacific Islander 117 (4.3) 1142 (8.3) — 126 (2.6) 1189 (4.7) — 101 (3.0) 825 (3.9) — 68 (0.7) 367 (0.9) — Black 603 (22.3) 1592 (11.6) — 911 (18.8) 1793 (7.1) — 580 (17.1) 1413 (6.7) — 2532 (25.0) 4708 (11.2) — Hispanic 83 (3.1) 1435 (10.4) — 48 (1.0) 1126 (4.5) — 80 (2.4) 1474 (7.0) — 141 (1.4) 2463 (5.9) — Native American 5 (0.2) 15 (0.1) — 7 (0.1) 26 (0.1) — 4 (0.1) 27 (0.1) — 13 (0.1) 64 (0.2) — Other 69 (2.5) 1207 (8.8) — 97 (2.0) 1776 (7.1) — 80 (2.4) 1388 (6.6) — 113 (1.1) 2315 (5.5) — White 1812 (66.9) 8331 (60.5) — 3590 (74.1) 19143 (76.2) — 2472 (73.1) 15756 (75.1) — 6914 (68.3) 31880 (76.0) — Unknown 19 (0.7) 54 (0.4) — 68 (1.4) 79 (0.3) — 66 (2.0) 87 (0.4) — 343 (3.4) 145 (0.3) — Insurance type — — 0.26 — — 0.04 — — 0.17 — — 0.23 Medicare 1163 (42.9) 5489 (39.8) — 2692 (55.5) 13988 (55.7) — 1261 (37.3) 8471 (40.4) — 5321 (52.6) 22720 (54.2) — Medicaid 178 (6.6) 1835 (13.3) — 270 (5.6) 1824 (7.3) — 249 (7.4) 1852 (8.8) — 532 (5.3) 2047 (4.9) — Private insurance 1271 (46.9) 6083 (44.2) — 1763 (36.4) 8779 (34.9) — 1732 (51.2) 10065 (48.0) — 3779 (37.3) 14053 (33.5) — Self-pay 19 (0.7) 185 (1.3) — 31 (0.6) 221 (0.9) — 38 (1.1) 300 (1.4) — 31 (0.3) 399 (1.0) — No charge 7 (0.3) 30 (0.2) — 10 (0.2) 27 (0.1) — 11 (0.3) 55 (0.3) — 7 (0.1) 24 (0.1) — Other 67 (2.5) 154 (1.1) — 80 (1.7) 292 (1.2) — 91 (2.7) 225 (1.1) — 452 (4.5) 2698 (6.4) — Unknown 3 (0.1) 0 (0.0) — 1 (0.0) 1 (0.0) — 1 (0.0) 2 (0.0) — 2 (0.0) 1 (0.0) — Elixhauser comorbidity 0.33 — 0.26 — 0.29 — — 0.22 — 0 165 (6.1) 1563 (11.3) — 359 (7.4) 2325 (9.3) — 502 (14.8) 4184 (20.0) — 986 (9.7) 5546 (13.2) — 1 424 (15.7) 3085 (22.4) — 722 (14.9) 5149 (20.5) — 721 (21.3) 5634 (26.9) — 2009 (19.8) 9972 (23.8) — 2 535 (19.8) 3300 (24.0) — 1025 (21.1) 6081 (24.2) — 738 (21.8) 4840 (23.1) — 2318 (22.9) 10782 (25.7) — 3 574 (21.2) 2525 (18.3) — 954 (19.7) 5223 (20.8) — 594 (17.6) 3116 (14.9) — 2111 (20.9) 7729 (18.4) — 4 440 (16.2) 1569 (11.4) — 806 (16.6) 3208 (12.8) — 383 (11.3) 1667 (7.9) — 1324 (13.1) 4370 (10.4) — 5+ 570 (21.0) 1734 (12.6) — 981 (20.2) 3146 (12.5) — 445 (13.2) 1529 (7.3) — 1376 (13.6) 3543 (8.4) — Hospital characteristics, n (%) Location — — 0.07 — — 0.12 — — 0.06 0.08 Rural 5 (0.2) 92 (0.7) — 0 (0.0) 190 (0.8) — 42 (1.2) 408 (1.9) — 113 (1.1) 896 (2.1) Urban 2703 (99.8) 13684 (99.3) — 4847 (100) 24942 (99.2) — 3341 (98.8) 20562 (98.1) — 10011 (98.9) 41046 (97.9) Teaching status — — 0.15 — — 0.56 — — 0.21 0.67 No 1033 (38.1) 4250 (30.9) — 2949 (60.8) 8557 (34.0) — 1812 (53.6) 9079 (43.3) — 8467 (83.6) 22704 (54.1) — Yes 1675 (61.9) 9526 (69.1) — 1898 (39.2) 16575 (66.0) — 1571 (46.4) 11891 (56.7) — 1657 (16.4) 19238 (45.9) — System membership — 0.50 — — 0.27 — — 0.31 — — 0.24 — No 523 (19.3) 5764 (41.8) — 1482 (30.6) 10900 (43.4) — 913 (27.0) 8680 (41.4) — 2711 (26.8) 15884 (37.9) — Yes 2185 (80.7) 8012 (58.2) — 3365 (69.4) 14232 (56.6) — 2470 (73.0) 12290 (58.6) — 7413 (73.2) 26058 (62.1) — Licensed beds — — 0.67 — — 0.78 — — 0.64 — 0.89 <250 233 (8.6) 1525 (11.1) —
留言 (0)