
記住我

To examine how STING is delivered to lysosomes, Sting−/− mouse embryonic fibroblasts (MEFs) were stably transduced with mRuby3-tagged mouse STING and enhanced green fluorescent protein (EGFP)-tagged Lamp1 (a lysosomal protein), and imaged with Airyscan super-resolution microscopy. Without stimulation, mRuby3-STING localized to a reticular network throughout the cytoplasm (Fig. 1a), suggesting that STING localized at ER5. mRuby3-STING diminished 12 h after stimulation with DMXAA (a membrane-permeable STING agonist). In contrast, addition of lysosomal protease inhibitors (E64d/pepstatin A) restored the fluorescence, with mRuby3-STING mostly in the lumen of Lamp1-positive compartments (Lamp1+), not at the limiting membrane of Lamp1+ (Fig. 1b,c and Extended Data Fig. 1a–c). These results suggested that degradation of STING proceeded in lysosomal lumen. The stimulation of STING with double-stranded DNA (herring testis (HT)-DNA) by lipofection3 also induced STING degradation in lysosomal lumen (Extended Data Fig. 1d,e).
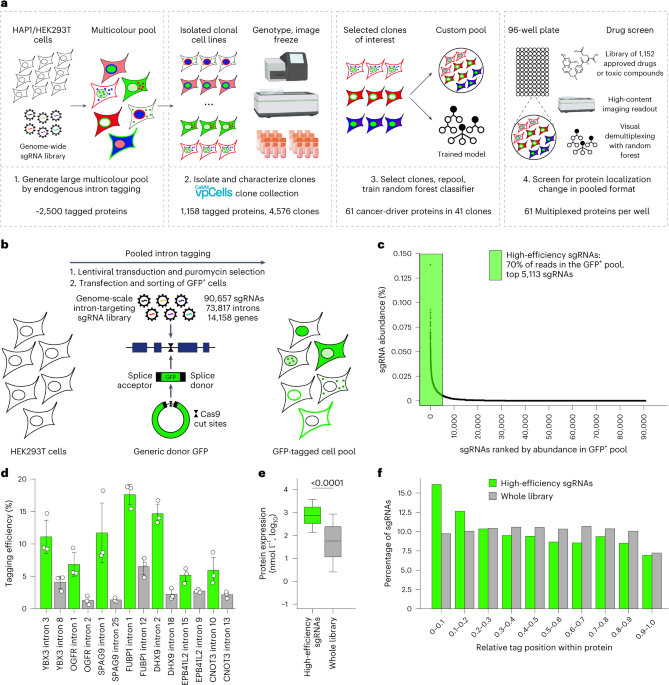
Fig. 1: Direct encapsulation of STING into the lumen of Lamp1-positive compartments.
a, Sting−/− MEFs stably expressing mRuby3-STING and Lamp1-EGFP were treated with DMXAA. For the inhibition of lysosomal proteolysis, E64d and pepstatin A were added to the medium. Cells were fixed and imaged. b, The fluorescence intensity of mRuby3-STING in a was quantified. c, Cells were stimulated with DMXAA in the presence of E64d/pepstatin A for the indicated times. Data are presented as the ratio (%) of [mRuby3-STING in Lamp1-positive areas (Lamp1+)]/[mRuby3-STING in whole cell]. d, (1) ‘Macroautophagy’; STING vesicles are first occluded into autophagosomes, which then fuse with lysosome. (2) ‘Membrane fusion’; STING vesicles fuse with endosome or lysosome, followed by invagination of limiting membrane of endosome or lysosome, yielding intraluminal STING vesicles. (3) ‘Encapsulation by endosome or lysosome’; STING vesicles are directly encapsulated into endosome or lysosomes. e–g, TfnR-EGFP and mRuby3-STING were stably expressed in Sting−/− MEFs. Cells were treated with DMXAA and then with LysoTracker Deep Red. The boxed area in the bottom panels is magnified in the top panels (e). Fluorescence intensity profile along the white line in e is shown (f). Cells were treated with DMXAA or HT-DNA and then with LysoTracker Deep Red. Data are presented as the ratio (%) of [TfnR-EGFP in LysoTracker-positive areas (LysoTracker+)]/[TfnR-EGFP in whole cell] (g). h, Sting−/− MEFs stably expressing mRuby3-STING, Lamp1-EGFP and mTagBFP2-Rab5 were treated with DMXAA. The white boxed area is magnified in the right panels. mTagBFP2-Rab5-positive area and Lamp1-EGFP-positive area are magnified at the bottom, respectively. The fluorescence intensity of mRuby3-STING within Rab5+ or Lamp1+ compartments was quantified. i, EGFP-Rab5 or Lamp1-EGFP was stably expressed in Sting−/− MEFs reconstituted with mRuby3-STING. Data are presented as the ratio (%) of [mRuby3-STING inside Rab5+ or Lamp1+]/[mRuby3-STING in whole cell]. NS, not significant. Scale bars, 5 µm (a), 10 µm (e,h) and 1 µm (magnified images in e and h). Data are presented in box-and-whisker plots with the minimum, maximum, sample median and first versus third quartiles (b,c,g–i). The sample size (n) represents the number of cells (b,c,g,i) or vesicles (h). Source numerical data are available in source data.
Membrane proteins, such as STING, may have access to lysosomal lumen by three ways, that is, (1) macroautophagy, (2) membrane fusion or (3) direct encapsulation (Fig. 1d). Several reports suggested that STING degradation did not require macroautophagy12,14,16, and we confirmed this in Atg5 tet-off MEFs in which macroautophagy was impaired in the presence of doxycycline24 (Extended Data Fig. 1f). Importantly, with lysosomal protease inhibitors, mRuby3-STING accumulated in lysosomal lumen in Atg5-depleted cells (Extended Data Fig. 1g,h). Furthermore, PI3K inhibitors (wortmannin and 3-methyladenine) did not inhibit STING degradation (Extended Data Fig. 2a–e), suggesting that macroautophagy was not involved in the delivery of STING into lysosomal lumen. The other two scenarios can be distinguished by probing the luminal pH of STING vesicles. We exploited an RE protein transferrin receptor (TfnR). TfnR was C-terminally tagged with EGFP, which thus faced the lumen of REs. If ‘membrane fusion’ occurs, the fluorescence of EGFP should be quenched because of its exposure to lysosomal acidic milieu25. If ‘direct encapsulation’ occurs, the fluorescence of EGFP should linger until two membranes surrounding EGFP are digested by lysosomal lipases. TfnR-EGFP was expressed together with mRuby3-STING. mRuby3-STING started to co-localize with TfnR-EGFP 60 min after DMXAA stimulation (Extended Data Fig. 3a and Supplementary Video 1), showing that STING reached REs by that time6,8. Intriguingly, the fluorescence of TfnR-EGFP was detected at lysotracker-positive acidic compartments together with mRuby3-STING 3 h after DMXAA stimulation (Fig. 1e–g and Extended Data Fig. 3b–d). These results suggested that the STING delivery to lysosomal lumen was mediated by ‘direct encapsulation’.
We then examined whether lysosomes and/or endosomes encapsulated STING. Cells were stably transduced with mRuby3-STING, mTagBFP2-Rab5 and Lamp1-EGFP, so that endosomes and lysosomes were simultaneously monitored. Three hours after DMXAA stimulation, when STING started to be in acidic compartments (Fig. 1e), STING was found inside Lamp1+, but not inside Rab5-positive endosomes (Rab5+) (Fig. 1h). The quantitation also revealed that at any time point up to 12 h after stimulation, STING was not found inside Rab5+ (Fig. 1h, i, Extended Data Fig. 4a), EEA1-positive early endosomes (Extended Data Fig. 4b), or LBPA-positive late endosomes (Extended Data Fig. 4b). These results suggested that Lamp1+ directly encapsulated STING for degradation.
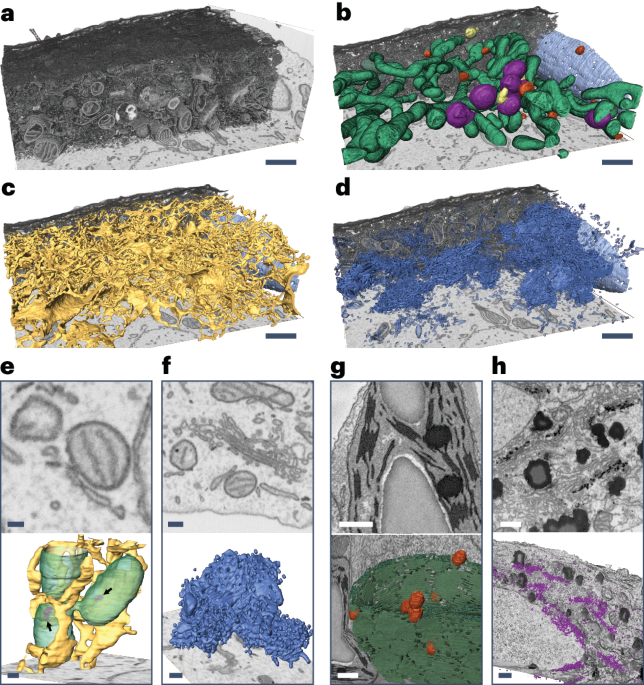
We then performed time-lapse imaging of live cells. Cells were imaged every 0.4 s from 3 h after DMXAA stimulation. We often found that a portion of irregularly shaped mRuby3-STING-positive chunk in close proximity to Lamp1+ translocated into the lumen of Lamp1+ (Fig. 2, Extended Data Fig. 4c–e and Supplementary Video 2). During this process, mRuby3-STING appeared not to diffuse along the limiting membrane of Lamp1+, further supporting the mechanism of ‘direct encapsulation’.
Fig. 2: Evidence of ‘direct encapsulation’ of STING by live-cell imaging.
a–c, Sting−/−MEFs stably expressing mRuby3-STING and Lamp1-EGFP were imaged by Airyscan super-resolution microscopy every 0.4 s from 3 h after DMXAA stimulation (related to Extended Data Fig. 4b–d): the perinuclear region of cell (a); the time-lapse images of the region outlined by the yellow box in a shown sequentially (b); the schematic corresponding to the individual time-lapse images (c). The yellow arrows indicate a cytosolic STING chunk in close proximity to the limiting membrane of Lamp1+. A cytosolic STING chunk is depicted as the cluster of vesicles (see also Fig. 3). The cyan arrows indicate STING inside Lamp1+. Scale bars, 500 nm (a–c).
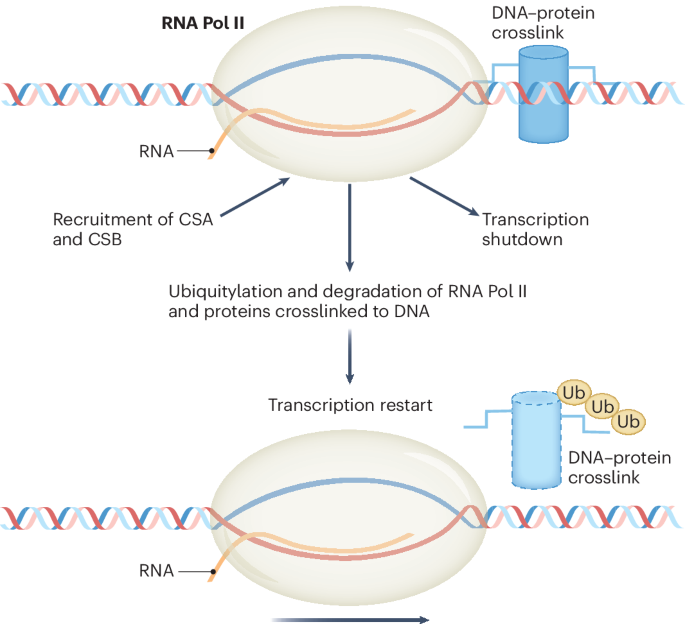
Evidence of ‘direct encapsulation’ by CLEMWe sought to validate ‘direct encapsulation’ by another approach. ‘Direct encapsulation’, but not ‘membrane fusion’, will result in the generation of a limiting membrane (indicated by an orange arrowhead in Fig. 3f) that surrounds STING vesicles. To examine whether STING vesicles in lysosomal lumen is surrounded by membrane, correlative light and electron microscopy (CLEM) was exploited. Cells were fixed and imaged with Airyscan super-resolution microscopy 3 h after DMXAA stimulation. The same cells were then processed for electron microscopy (EM). Two images in the same region of cells from fluorescence microscopy and EM were aligned according to multiple lysosomal positions (Fig. 3a). The CLEM analysis revealed that a STING-positive chunk inside lysosomes (magenta in Fig. 3b,c and Extended Data Fig. 5a,b) was composed of a cluster of membrane vesicles. Importantly, the cluster of membrane vesicles was surrounded by single membrane (indicated by orange arrowheads), demonstrating that ‘direct encapsulation’ is a mechanism underlying the STING delivery into lysosomal lumen. The CLEM analysis also showed the nature of STING membranes that were free from or associated with lysosomes (Fig. 3d,e and Extended Data Fig. 5c,d). These irregularly shaped STING-positive chunks were indeed clusters of vesicles with electron-dense coat (60–130 nm in diameter) (Fig. 3g). We also performed the CLEM analysis with Rab11, the authentic RE protein, and found that STING within lysosomes co-localized with Rab11 6 h after stimulation (Fig. 3h,i and Extended Data Fig. 6). Together with the data of live-cell imaging (Fig. 1e,h), these results suggested that a cluster of vesicles with an RE origin was directly encapsulated into Lamp1+.
Fig. 3: Evidence of ‘direct encapsulation’ of STING by CLEM.
a–g, Sting−/− MEFs stably expressing mRuby3-STING (magenta) and Lamp1-EGFP (green) were treated with DMXAA in the presence of E64d/pepstatin A/orlistat (lipase inhibitor): Lamp1-positive endosomes/lysosomes and STING-positive vesicles (or structures) were identified by Airyscan super-resolution microscopy before processing for transmission EM to examine their ultrastructure (a); magnification of the boxed areas in a (b–e), with orange arrowheads in b and c indicating the membrane that surrounds STING vesicles (for EM images of serial sections, see Extended Data Fig. 5); a graphical image of lysosome containing membrane-encapsulated STING vesicles (f) (green arrowheads indicate limiting membrane of lysosome); the diameter of STING-positive membrane vesicles was measured and plotted as histograms (g). h, Sting−/− MEFs stably expressing mRuby3-STING (magenta), Lamp1-EGFP (cyan) and Halo-Rab11a (green) were treated with DMXAA for 6 h in the presence of E64d/pepstatin A/orlistat. i, The fluorescence intensity of Halo-Rab11a in lysosomes (Lamp1-positive areas) or in whole cell was quantified. Data are presented in box-and-whisker plots with the minimum, maximum, sample median and first versus third quartiles as the ratio (%) of [Halo-Rab11a in Lamp1+]/[Halo-Rab11a in whole cell]. j, Sting−/− MEFs stably expressing EGFP-STING (green) were treated with or without DMXAA. Cells were immunostained with anti-clathrin-heavy chain (CHC) antibody (magenta). k, TfnR-EGFP (green) and mRuby3-STING (magenta) were stably expressed in Sting−/− MEFs. Cells were treated with the indicated siRNAs, and then stimulated with DMXAA. Scale bars, 10 µm (a,j,k), 500 nm in (b–e,h) and 500 nm (magnified images in j and k). The sample size (n) represents the number of cells (i) or vesicles (g). Source numerical data are available in source data.
The observation that STING-positive vesicles had electron-dense coat with 60–130 nm diameter led us to examine if these were clathrin-coated vesicles. EGFP-STING co-localized well with clathrin heavy chain (CHC) 2 h after DMXAA stimulation (Fig. 3j). Knockdown of CHC inhibited the degradation of STING, arresting STING in TfnR-positive compartments (Fig. 3k). These results suggested that packaging of STING into clathrin-coated vesicles at REs was essential process for STING degradation. In line with this notion, the contribution of clathrin-adaptor AP-1 and clathrin in STING degradation has recently been reported in ref. 26.
ESCRT regulates STING degradation and signallingIn yeast, more than 40 proteins were designated vacuolar protein sorting (Vps) proteins27,28, which function in sorting of newly synthesized vacuolar proteins from late Golgi to vacuole (the yeast equivalent of lysosome). Given the analogous trafficking pathways that STING and vacuolar proteins follow, we reasoned that mammalian Vps homologues regulate STING traffic to lysosomes. The impaired traffic of STING to lysosomes should result in the suppression of STING degradation8,11,12,13,14,15,16, and may also in the duration of the STING-triggered type I interferon response.
We screened 75 Vps mammalian homologues with short interfering RNAs (siRNAs) in two criteria, that is, the effect on STING degradation and termination of the type I interferon response. The degree of degradation and that of the type I interferon response were quantitated using flow cytometer and type I interferon bioassay, respectively (Fig. 4a). Knockdown of 55 Vps genes showed enhanced suppression of STING degradation, compared with that with control siRNA (Fig. 4b and Extended Data Fig. 7a). Atp6v1b2, a component of subunit B of vacuolar ATPase (v-ATPase), was included in this assay as a positive control. Knockdown of 40 Vps genes showed an increased type I interferon response, compared with that with control siRNA (Fig. 4c and Extended Data Fig. 7b). The genes that were ranked within top 25 in both criteria were selected and listed (Fig. 4d). These genes included 4 Vps genes (Vps28, Tsg101, Vps37a and Chmp4b) that belong to ESCRT29, Vps4 (AAA-ATPase) and Vps39 (a subunit of homotypic fusion and vacuole protein sorting (HOPS) complex). Knockdown of these genes significantly enhanced the expression of Cxcl10, a STING-downstream gene, compared with that with control siRNA (Fig. 4e and Extended Data Fig. 7c), corroborating the results with the type I interferon bioassay (Fig. 4c).
Fig. 4: Mammalian Vps genes essential for STING degradation and termination of type I interferon response.
a, Schematic overview of the screening procedures. b, Screening of mammalian Vps genes required for STING degradation. Sting−/− MEFs reconstituted with mRuby3-STING were treated with siRNA against individual Vps genes, and stimulated with DMXAA for 18 h. Cells were analysed by flow cytometry. MFI of mRuby3 in stimulated cells was divided by MFI of mRuby3 in the corresponding unstimulated cells. The calculated value from cells treated with Vps siRNA was then normalized to that of cells treated with control siRNA. The top 25 genes are highlighted in red. Bright red bars indicate the genes that were also ranked within top 25 in c. c, Screening for mammalian Vps genes required for suppression of STING-dependent type I interferon response. MEFs were treated with siRNA against individual Vps genes, and stimulated with DMXAA for 10 h. Cell supernatants were analysed for type I interferon (IFN). IFN activity from cells treated with Vps siRNA was normalized to that of cells treated with control siRNA. The top 25 genes are highlighted in blue. Bright blue bars indicate the genes that were also ranked within top 25 in b. d, Vps genes ranked within top 25 both in b and c are shown. e, The expression of Cxcl10 in MEFs that were treated with siRNA against the indicated Vps genes, and then stimulated with DMXAA for 12 h. Data are presented as mean ± standard deviation (s.d.). Statistical significances between control siRNA/DMXAA (+) and the indicated siRNAs/DMXAA (+) were determined by performing Student’s unpaired t-test with Bonferroni multiple correction. f, FLAG-STING-reconstituted Sting−/− MEFs were stimulated with DMXAA for 3 h, and lysed. FLAG-STING in the lysates was immunoprecipitated. Co-immunoprecipitated proteins were identified by MS. The ratio of abundance of identified proteins before and after stimulation was then calculated individually. The listed are lysosomal proteins that showed increased abundance after stimulation. Gene Ontology analysis in Uniprot was performed to identify lysosomal proteins. N/A indicates a protein that was not detected without stimulation. The sample size (n) represents the number of the biological replicates (e). Source numerical data are available in source data.
We also performed proteomic analysis of FLAG-STING-binding proteins, aiming at identifying proteins that regulate STING degradation at lysosomes. The amount of individual proteins in the immunoprecipitates by anti-FLAG antibody was quantitated before and after stimulation (Supplementary Table). We selected the proteins, the amount of which increased after stimulation, and further screened them if they were annotated to ‘lysosome’ in Gene Ontology in Uniprot. This approach led to identify three Vps proteins (Vps4a, Vps4b and Tsg101) (Fig. 4f). Together with the aforementioned results (Fig. 4d), we examined the role of Vps4a, Vps4b and Tsg101 in lysosomal degradation of STING in the subsequent experiments.
ESCRT functions in encapsulation of STING into Lamp1+We sought to identify the site of actions of Tsg101 and Vps4a/4b, thus examining the trafficking of STING in Tsg101- or Vps4a/b-knockdown cells. In cells treated with control siRNA, the fluorescence of mRuby3-STING diminished entirely 12 h after stimulation with DMXAA, because of its lysosomal degradation (Fig. 5a). In contrast, in cells treated with Tsg101 or Vps4a/b siRNA, the fluorescence of mRuby3-STING lingered and co-localized with TfnR (Fig. 5a,b), indicating that the transport of STING from REs to lysosomes was impaired. Phosphorylated TBK1 (pTBK1), a hallmark of STING activation, also lingered and co-localized with mRuby3-STING in cells treated with Tsg101 or Vps4a/b siRNA (Fig. 5a,b), being consistent with the duration of the STING signalling in these cells (Fig. 4c,e). CLEM analysis of Tsg101 or Vps4a/b siRNA-treated cells showed a cluster of STING-positive vesicles that were peripherally associated with lysosomal limiting membrane (Fig. 5c–f and Extended Data Fig. 8). These results suggested that Tsg101 and Vps4a/4b were essential for encapsulation of a cluster of STING-positive vesicles into lysosomal lumen.
Fig. 5: ESCRT proteins are required for encapsulation of STING into the lumen of Lamp1-positive compartments.
a, TfnR-EGFP (cyan) and mRuby3-STING (magenta) were stably expressed in Sting−/− MEFs. Cells were treated with the indicated siRNAs, and then stimulated with DMXAA. Cells were immunostained with anti-pTBK1 (yellow) antibody. b, The Pearson’s correlation coefficient between mRuby3-STING and pTBK1, or between mRuby3-STING and TfnR-EGFP in a is shown. Data are presented in box-and-whisker plots with the minimum, maximum, sample median and first versus third quartiles. c–f, CLEM analysis of STING-positive vesicles. Sting−/− MEFs stably expressing mRuby3-STING (magenta) and Lamp1-EGFP (green) were treated with siRNA against Tsg101 (c,d) or Vps4a/b (e,f), and then stimulated with DMXAA. Lamp1-positive lysosomes and STING-positive membranes were identified by Airyscan super-resolution microscopy before processing for transmission EM to examine their ultrastructure (c,e). The yellow boxed areas in c and e are magnified in the right panels, respectively. The red boxed areas in EM images are magnified in the bottom right panels, respectively. STING-positive vesicles in c and e are indicated by magenta arrows. The diameters of STING-positive vesicles in Tsg101- or Vps4a/b-depleted cells were measured and plotted as histogram (d and f). Scale bars, 10 µm (a), 500 nm (magnified images in a), 1 µm (left CLEM images in c and e), 500 nm (fluorescence images in c and e), 100 nm (magnified EM images in c and e). The sample size (n) represents the number of cells (b) or vesicles (d,f). Source numerical data are available in source data.
The role of Tsg101 in STING degradation was also confirmed with more physiological stimulations. STING degradation triggered by HT-DNA was significantly retarded in Tsg101-knockdown MRC-5 cells (normal embryonic lung fibroblasts) (Fig. 6a–c). In these cells, phosphorylated STING (pSTING), a hallmark of STING activation, lingered 12 h after stimulation (Fig. 6b,c). Knockdown of Tsg101 in human primary T cells led to an increase of the expression of interferon-stimulated genes, such as IFIT1 and IFI27 (Fig. 6d–f). STING degradation triggered by the infection of herpes simplex virus-1 (HSV-1) was also retarded in Tsg101-knockdown primary MEFs (Fig. 6g). In these cells, pSTING and pTBK1 lingered 8 h after infection (Fig. 6g), and endogenous STING accumulated at Lamp1-negative perinuclear compartments (Fig. 6h,i). Given the expression levels of ICP4, a viral protein produced immediately after infection, Tsg101 knockdown did not interfere with the infection of HSV-1.
Fig. 6: The physiological roles of Tsg101 in STING degradation and termination of type I interferon response.
a, MRC-5 cells were treated with siRNAs, and then stimulated with HT-DNA for the indicated times. Cell lysates were analysed by western blot. b, MRC-5 cells were treated with the indicated siRNAs, and then stimulated with HT-DNA. Cells were immunostained with anti-STING (magenta) and anti-pSTING (green) antibodies. c, The fluorescence intensity of STING or pSTING in b was quantified. d, Schematic representation of the experiments with human primary T cells. e, Knockdown efficiency of TSG101 gene in human primary T cells from a representative donor. Data are presented as mean ± s.d. f, The expression of IFIT1 or IFI27 was quantitated with qRT–PCR. Data are presented as mean ± s.d. g, Primary MEFs were treated with siRNAs, and then infected with HSV-1 (MOI 10) for the indicated times. Cell lysates were analysed by western blot. h, Primary MEFs were treated with the indicated siRNAs, and then stimulated with HSV-1 infection (MOI 10) for 8 h. Cells were immunostained with anti-STING (magenta), anti-Lamp1 (green) and anti-ICP4 antibodies. i, The fluorescence intensity of STING in h was quantified. Scale bars, 10 µm (b,h) and 500 nm (magnified images in h). Data are presented in box-and-whisker plots with the minimum, maximum, sample median and first versus third quartiles (c,i). The sample size (n) represents the number of cells (c,i) or the biological replicates (e,f). Source numerical data and unprocessed blots are available in source data.
K63 ubiquitination on K288 regulates STING degradationGiven that STING undergoes ubiquitination after stimulation30 and Tsg101 binds to ubiquitinated proteins31,32, we reasoned that the binding of Tsg101 to ubiquitinated STING would be required for STING degradation and thus termination of the STING signalling. We confirmed the stimulation-dependent ubiquitination of STING by co-immunoprecipitation analysis. STING became extensively ubiquitinated 2 h after DMXAA stimulation (Fig. 7a).
Fig. 7: Ubiquitination on K288 of STING is required for STING degradation and termination of type I interferon response.
a, Sting−/− MEFs reconstituted with EGFP-STING were stimulated with DMXAA for the indicated times. EGFP-STING was immunoprecipitated with anti-GFP antibody. The cell lysates and the immunoprecipitated proteins were analysed by western blot. IP, immunoprecipitation. b, Sting−/− MEFs stably expressing mRuby3-STING and mNeonGreen (mNG)-ubiquitin were imaged every 5 min after DMXAA stimulation. c, Quantitation of the number of mNG-ubiquitin puncta (see also Supplementary Video 3). d, Sting−/− MEFs reconstituted with EGFP-STING (WT, K19R, K150/151R, K235R, K288R or K337R) were stimulated with DMXAA. EGFP-STING was immunoprecipitated with anti-GFP antibody. The cell lysates and the immunoprecipitated proteins were analysed by western blot. e, The fluorescence intensity of EGFP-STING (WT or K288R) under the indicated conditions was quantified. NS, not significant. f, Sting−/− MEFs reconstituted with EGFP-STING (WT or K288R) were stimulated with DMXAA. Cells were immunostained with anti-GM130 or anti-Rab11 antibodies. The Pearson’s correlation coefficient between EGFP-STING (WT or K288R) and GM130, or between EGFP-STING (WT or K288R) and Rab11, is shown. g, Cells were stimulated with DMXAA. Cell lysates were analysed by western blot. The band intensities were quantified. [STING/tubulin], [pTBK1/TBK1] and [pIRF3/IRF3] were calculated. h, Cells were stimulated with DMXAA or HT-DNA for 12 h. The expression of Cxcl10 was quantitated with qRT–PCR. Data are presented as mean ± s.d. i, Sting−/− MEFs reconstituted with EGFP-STING (WT or K288R) were stimulated with DMXAA. Cells were immunostained with anti-K63 ubiquitin antibody. j, The Pearson’s correlation coefficient between EGFP-STING (WT or K288R) and K63 ubiquitin is shown. k, Cells were stimulated with DMXAA. Cell lysates were prepared, and EGFP-STING was immunoprecipitated with anti-GFP antibody. The cell lysates and the immunoprecipitated proteins were analysed by western blot. Scale bars, 10 µm (b,f,i) and 500 nm (magnified images in b and i). Data are presented in box-and-whisker plots with the minimum, maximum, sample median and first versus third quartiles (e,f,j). The sample size (n) represents the number of cells (e,f,j) or the biological replicates (h). Source numerical data and unprocessed blots are available in source data.
We sought to examine the dynamics of ubiquitin with STING stimulation. Sting−/− MEFs were stably transduced with mRuby3-STING and mNeonGreen-ubiquitin and imaged with Airyscan super-resolution microscopy. As with EGFP-STING8, mRuby3-STING translocated to the perinuclear Golgi by 30 min after DMXAA stimulation, and then to REs by 120 min (Extended Data Fig. 9a). mNeonGreen-ubiquitin distributed diffusively throughout the cytosol and was then translocated to several puncta 120 min after stimulation. These mNeonGreen-ubiquitin puncta were positive with Rab11 (an RE protein) and mRuby3-STING (Extended Data Fig. 9b–d), suggesting that STING at REs was ubiquitinated. Live-cell imaging showed essentially the same results: mNeonGreen-ubiquitin was recruited to mRuby3-STING-positive puncta 95 min after stimulation, at the timing when STING localized at REs (Fig. 7b,c and Supplementary Video 3).
We focused on six conserved lysine residues (K19, K150, K151, K235, K288 and K337) between human and mouse, and generated STING mutants with lysine-to-arginine substitutions individually. Among them, K288R mutant entirely lost the stimulation-dependent ubiquitination (Fig. 7d), and most importantly, was resistant to degradation (Fig. 7d,e), in line with the previous report with HEK293T cells33. K288R mutant, as wild-type (WT) STING, translocated from the ER to the Golgi and eventually to REs upon stimulation (Fig. 7f). In cells expressing K288R, the signals of pTBK1 and pIRF3 lingered (Fig. 7g) and the transcription of Cxcl10 was enhanced (Fig. 7h). The immunofluorescence and biochemical analyses showed that STING was subjected to K63-linked ubiquitination on K288 4 h after stimulation (Fig. 7i–k). Thus, these results demonstrated that K63-linked ubiquitination on K288 was required for STING degradation and termination of STING signalling.
UEV domain of Tsg101 is essential for STING degradationWe next examined whether Tsg101, a ubiquitin-binding protein, was required for the degradation of ubiquitinated STING. The smeared bands corresponding to ubiquitinated EGFP-STING diminished 12 h after stimulation in control cells, but not in cells treated with Tsg101 siRNA (Fig. 8a). In accordance with these biochemical data, the fluorescence signals of mRuby3-STING and K63-linked ubiquitin diminished 12 h after stimulation in control cells, but not in cells treated with Tsg101 siRNA (Fig.8b–e). Of note, mRuby3-STING or K63-linked ubiquitin accumulated outside Lamp1+ in Tsg101-depleted cells (Fig. 8b–e and Extended Data Fig. 9e,f). These results suggested a role of Tsg101 in encapsulation of K63-linked ubiquitinated STING into lysosomes.
Fig. 8: Ubiquitin-binding domain of Tsg101 is required for STING degradation and termination of type I interferon response.
a, Sting−/− MEFs reconstituted with EGFP-STING were treated with control siRNA or Tsg101 siRNA. Cells were then incubated with DMXAA. EGFP-STING was immunoprecipitated with anti-GFP antibody. The cell lysates and the immunoprecipitated proteins were analysed by western blot. b, Sting−/− MEFs reconstituted with mRuby3-STING were treated with control siRNA or Tsg101 siRNA, and then stimulated with DMXAA. Cells were immunostained with anti-K63 ubiquitin antibody (cyan) and anti-Lamp1 (yellow). The boxed areas are magnified in the bottom row. c, Sting−/− MEFs reconstituted with mRuby3-STING were treated with indicated siRNAs, and then stimulated with DMXAA. The fluorescence intensity of mRuby3-STING under the indicated conditions was quantified. d, The fluorescence intensity of mRuby3-STING that was not associated with Lamp1+ in b was quantified. e, The Pearson’s correlation coefficient between mRuby3-STING and K63 ubiquitin in b is shown. f, EGFP-Tsg101 (WT or ΔUEV) and mRuby3-STING were stably expressed in Sting−/− MEFs. Cells were treated with DMXAA. The boxed areas are magnified in the bottom row. g, The Pearson’s correlation coefficient between mRuby3-STING and EGFP-Tsg101 (WT or ΔUEV) in f is shown. NS, not significant. h, LgBiT-Tsg101 (WT or ΔUEV) and SmBiT-STING were stably expressed in Sting−/− MEFs. Cells were treated with DMXAA for 4 h. Data are presented as mean ± s.d. NS, not significant. i, The expression of Cxcl10 was quantitated with qRT–PCR. Data are presented as mean ± s.d. j, A graphical abstract illustrating ESCRT-driven microautophagy. Scale bars, 10 µm (b,f) and 500 nm (magnified images in b and f). Data are presented in box-and-whisker plots with the minimum, maximum, sample median and first versus third quartiles (c–e,g). The sample size (n) represents the number of cells for (c–e,g) or the biological replicates (h,i). Sourc
留言 (0)