
記住我
An increasing elderly population and a growing proportion of people living with a chronic disease or multiple morbidities place a major burden on the health care system. Specifically, the increasing numbers of hospital contacts and acute hospital beds put significant financial and organizational pressure on the sector.1,2 This intensified pressure necessitates a prioritization of resources, including a greater focus on preventing the development of a wide range of conditions in the primary care setting and increased coordination across organizational boundaries.3,4
The number of potentially preventable hospitalizations is often used as an indicator of the quality of primary healthcare, including prophylaxis efforts.5 The Organisation for Economic Co-operation and Development (OECD) has compared potentially preventable hospitalizations across member countries for asthma, chronic obstructive pulmonary disorder (COPD), and congestive heart failure, as these conditions (once diagnosed) are considered to be largely preventable with due care.6 Various definitions exist of potentially preventable hospitalizations.6–12 Defining potentially preventable hospitalizations through the use of diagnosis codes is likely to introduce misclassification, as not all individual hospitalizations are preventable.5 However, examining potentially preventable hospitalizations at the group level can assist the primary care setting in identifying particular groups of citizens at risk of hospitalization.13 Therefore, it would be desirable to identify predictors of potentially preventable hospitalizations; this could provide new knowledge on how to organize future healthcare interventions and thereby prevent hospital admissions.
With this focus, prediction models have been developed to estimate the risk of potentially preventable hospitalizations, and some of these may support clinical decision-making in the hospital setting.14–18 However, no previous model has been able to support clinical decision-making in the primary health care setting due to a lack of data on primary health care utilization. Moreover, sociodemographic predictors are sparsely included in the existing prediction models. The inclusion of sociodemographic data and additional data from the primary health care system will increase the overall complexity of a statistical prediction model, as multiple interactions may arise. Prediction models based on artificial intelligence (AI) benefit from the ability to detect complex interactions between predictors that may be difficult to model with ordinary statistics.19–21 In addition, AI models have previously been used with success to predict the risk of hospital readmissions, as they outperformed traditional statistical models in terms of calibration and discrimination.22 Therefore, we hypothesized that applying AI methods could facilitate the most optimal risk model for potentially preventable hospitalizations.
Denmark has a long tradition of collecting health data,23 and the CROSS-TRACKS cohort was recently established.24 The CROSS-TRACKS cohort is suitable for studying potentially preventable hospitalizations as it comprises routinely collected administrative health data from primary care, secondary care, and national registries, including sociodemographic information on the citizens living in the catchment area of Horsens Regional Hospital.24 The cohort is ideal for AI prediction models as it provides the possibility to examine extensive patterns of patient characteristics, such as sociodemographic and clinical characteristics and health care utilization before hospitalization, which allows exploration of an individual patient’s pathways across healthcare sectors.
The aim of this paper is to develop and validate an AI-based prediction model for the risk of potentially preventable hospitalizations in the coming year among citizens living in the catchment area of Horsens Regional Hospital by using the citizens’ sociodemographic characteristics, clinical characteristics, and health care utilization as predictors. A secondary aim is to apply explainable AI to identify the predictors that affect the risk of hospitalization and how they interact.
METHODS Setting and Study PopulationThe Danish healthcare system is tax-funded, and Danish citizens have free access to health care services in primary and secondary care. Primary care consists of municipality services (practical help, rehabilitation assistance, personal care, and home visits by a community nurse) and services provided by general practitioners (GPs). The GPs are the primary point of access and can refer citizens to secondary care provided by private specialists and hospital-based (inpatient and outpatient) specialists.23 A unique personal registration (CPR) number is assigned to all Danish residents; this number enables electronic linkage of individual-level data across registries and databases.25
We included citizens for the period from January 1, 2016 to December 31, 2017 using the CROSS-TRACKS cohort, which consisted of all citizens entered into the cohort on their 18th birthday or when moving into the area. Residents moving away from the catchment area were followed for 5 years after the date of moving. The cohort included ~222,000 citizens.
Potentially Preventable HospitalizationsWe defined potentially preventable hospitalizations in accordance with the definition by the Danish Health Authority (DHA)26 and the definition by Davydow et al.12 The DHA defines potentially preventable hospitalizations among citizens aged 65+ years as acute hospitalizations with a primary diagnosis code for nine conditions (Supplemental Digital Content, Table 1, https://links.lww.com/MLR/C596).26 Davydow et al12 define potentially preventable hospitalizations among citizens aged 18+ years through the use of primary diagnoses, secondary diagnoses, and procedure codes for acute hospitalizations due to 12 conditions (Supplemental Digital Content, Table 2, https://links.lww.com/MLR/C596). The definition by Davydow and colleagues provide the possibility to identify homogeneous subgroups of patients known to have pre-existing conditions like diabetes, COPD, or cardiovascular disease and to follow these patients for risk of potentially preventable hospitalizations due to complications and exacerbations of their underlying disease.
Potentially preventable hospitalizations occurring less than 30 days after the index hospitalization were considered readmissions and therefore excluded.
PredictorsWe included sociodemographic characteristics, clinical characteristics, and health care utilization recorded in CROSS-TRACKS24 as predictors (Table 1, Table 2). We collected information on predictors in a 1-year observation window, except for comorbidity, which was based on all hospital contacts from 2002 through the observation window. Comorbidity was measured with diagnoses according to the International Classification of Diseases coding system. In the first model, we used the 19 comorbidities included in the Charlson Comorbidity Index (CCI).27 In the second model, we used the 31 comorbidities included in the Elixhauser Comorbidity Index.28 We created a binary predictor for each type of comorbidity.
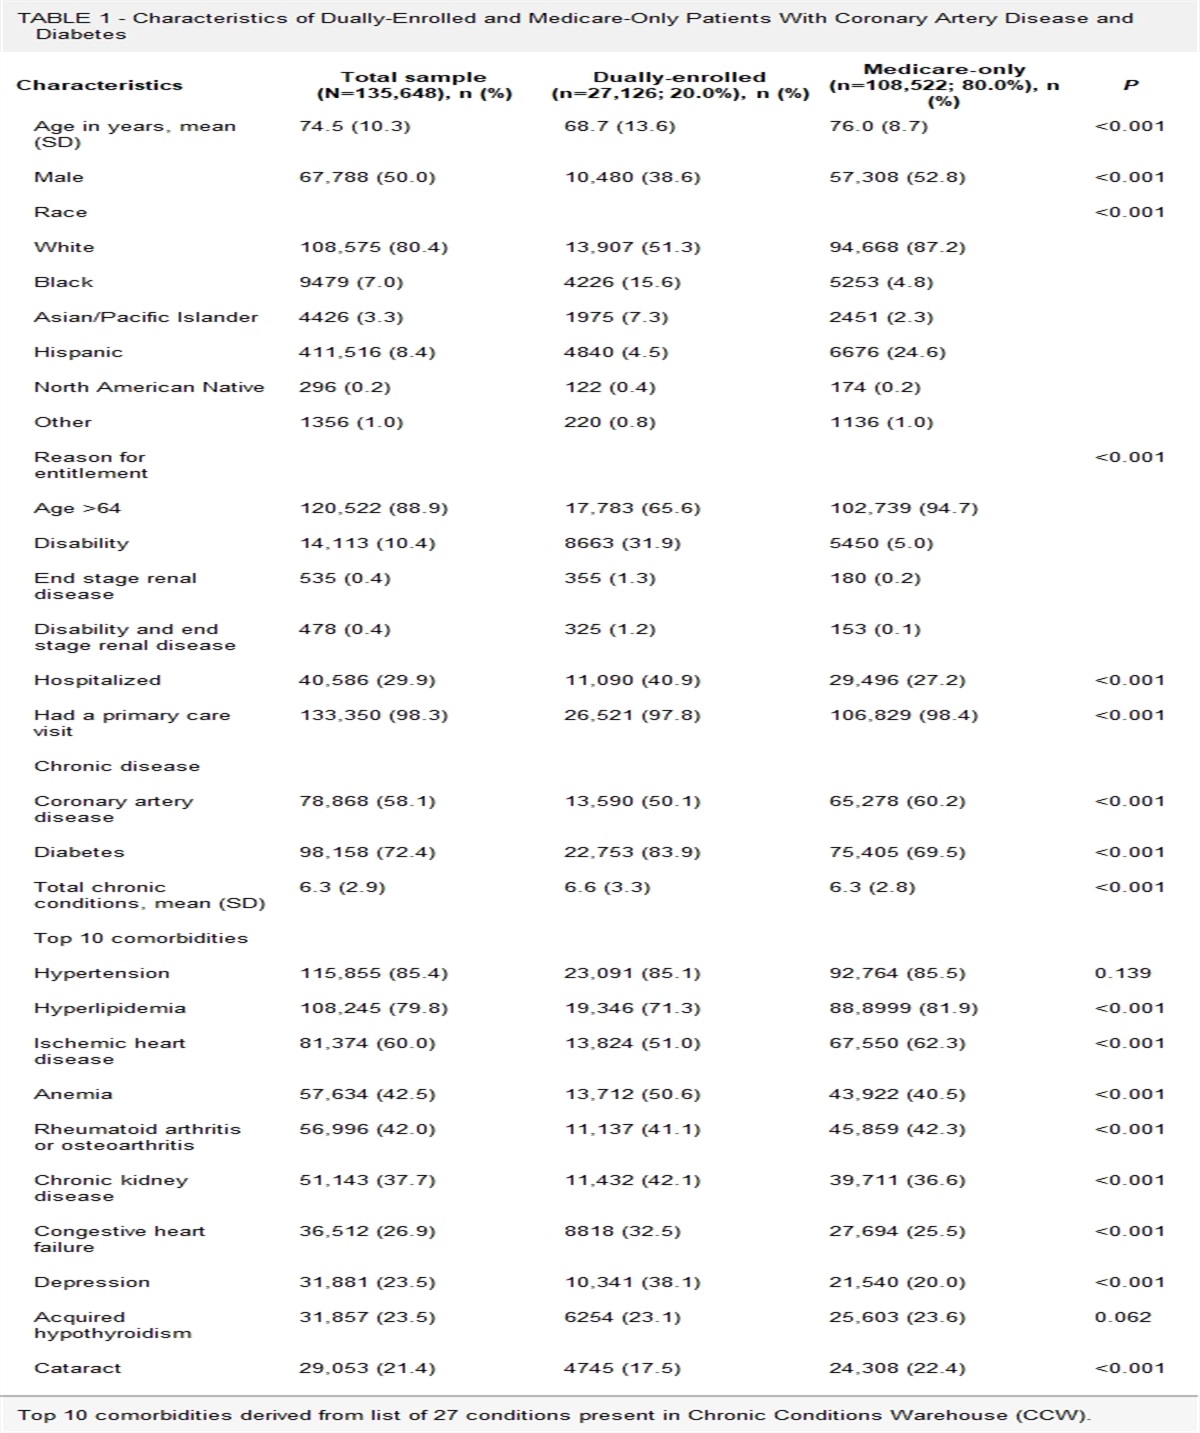
TABLE 1 - Sociodemographic Characteristics and Disease Status of Citizens Aged 65+ Years in the Danish CROSS-TRACKS Cohort in 2016-2017 at the Date of Contact With General Practitioners and Classified According to Whether the Citizens Experienced an Acute Potentially Preventable Hospitalization During Follow-up Throughout 2018 Overall sample population Potentially preventable hospitalization Characteristics N (%) DHA* N (%) Davydow† N (%) Number of touchpoints (TP) 265,097 (100) 16,443 (6) 13,896 (5) Number of unique citizens 42,661 4251 3446 Age at touchpoint 65–74 y 144,477 (54) 5638 (34) 5068 (36) 75–84 y 90,157 (34) 6862 (42) 5861 (42) 85+ y 30,463 (11) 3943 (24) 2967 (21) Sex Female 144,209 (54) 8905 (54) 7043 (51) Male 120,888 (46) 7538 (46) 6853 (49) Cohabitating on date of TP 118,568 (45) 5985 (36) 5269 (38) Socioeconomic status Self-supporting 9116 (3) 204 (1) 191 (1) Health-related benefits 4041 (2) 226 (1) 209 (2) Labor-market benefit 203 (0) 7 (0) 7 (0) Retirement (old age) 251,737 (95) 16,006 (97) 13,489 (97) Charlson Comorbidity Index (from 2002 to date of TP) Myocardial infarction 10,269 (4) 991 (6) 910 (7) Congestive heart failure 12,498 (5) 1705 (10) 1464 (11) Peripheral vascular disease 15,775 (6) 2117 (13) 1897 (14) Cerebrovascular disease 24,438 (9) 2424 (15) 2177 (16) Dementia 4621 (2) 562 (3) 411 (3) Chronic pulmonary disease 24,267 (9) 4543 (28) 4122 (30) Connective tissue disease 10,347 (4) 1124 (7) 1078 (8) Ulcer disease 6084 (2) 798 (5) 707 (5) Mild liver disease 1813 (1) 229 (1) 195 (1) Diabetes 23,516 (9) 2326 (14) 2182 (16) Hemiplegia 466 (0) 66 (0) 66 (0) Moderate to severe renal disease 8257 (3) 1080 (7) 1065 (8) Diabetes with end organ damage 11,772 (4) 1373 (8) 1404 (10) Any tumor 38,079 (14) 3280 (20) 2810 (20) Leukemia 878 (0) 125 (1) 106 (1) Lymphoma 2229 (1) 286 (2) 238 (2) Moderate to severe liver disease 568 (0) 48 (0) 40 (0) Metastatic solid tumor 9447 (4) 1146 (7) 927 (7) AIDS 46 (0) 11 (0) 11 (0) *Definition by the Danish Health Authority.26†Definition by Davydow DS et al.12
留言 (0)