
記住我


Musculoskeletal pain—such as neck or back pain (NBP)—is a common reason in patients present for ambulatory care in the United States.1–4 NBP frequently is persistent and contributes to the health care burden due to chronic pain. Chronic pain, defined by the Institute of Medicine as pain of ≥3 months duration, adversely affects the quality of life and work productivity, and increases health care utilization.5 In the US population, chronic pain costs have been estimated at $560–$635 billion per annum, which includes the incremental cost of health care ($261–$300 billion) and the cost of lost worker productivity ($297–$336 billion).5–13
Both physicians and patients play key collaborative roles in NBP diagnosis and treatment. A physician’s taking of patient history and a physical examination will often involve orders for imaging studies to diagnose NBP and medication orders as part of a treatment plan.14–24 The patient must then fulfill orders in a timely manner to initiate the treatment plan, allow providers to monitor progress toward NBP symptom resolution, and make treatment plan adjustments according to findings from follow-up studies and patient reports.
Two recent circumstances may have changed the character of this collaboration: (1) the implementation and dissemination of technology-mediated visits (“virtual”) as an alternative to in-person visits, and (2) a health care system’s changes to the availability of visit mode (virtual vs in-person) during the COVID-19 national shutdown and recovery periods.
In-person visits are, by definition, colocated for purposes of history taking and physical examination. Physician interaction with a patient presenting with NBP occurs face-to-face in a private examination room at a specific medical facility. Some integrated delivery systems, such as Kaiser Permanente (KP) further colocate ancillary services (eg, diagnostic radiology, laboratory, and pharmacy) at the same medical facilities—a “one stop shopping” model of health care delivery. Virtual visits, however, “dis-locate” the place and time of service delivery compared with in-person visits. Physicians and patients are in different locations for history taking and “physical examination”; patients are not immediately at the medical facilities where they could expeditiously fulfill most ancillary services orders.
We evaluated whether disruption of co-location of physician and patient from virtual versus in-person care of incident NBP changed: (1) the physician’s patterns of ordering ancillary services for diagnosis and treatment, and (2) the patient’s patterns of the fulfillment of those ancillary services. Management of incident NBP has not heretofore been so evaluated. Some evaluations have reported a lower frequency of ancillary services utilization on virtual versus in-person visits; however, it is unclear if differences in ancillary services utilization by visit mode represent changes in physician ordering patterns, patient fulfillment patterns, or both. Furthermore, the COVID-19 pandemic accelerated the rate of substitution of virtual visits for in-person visits; and, the cooccurrence of the COVID-19 pandemic with health care system’s transition from in-person to virtual care confounds whether visit mode, pandemic period, or both circumstances affect ancillary services utilization.25–38
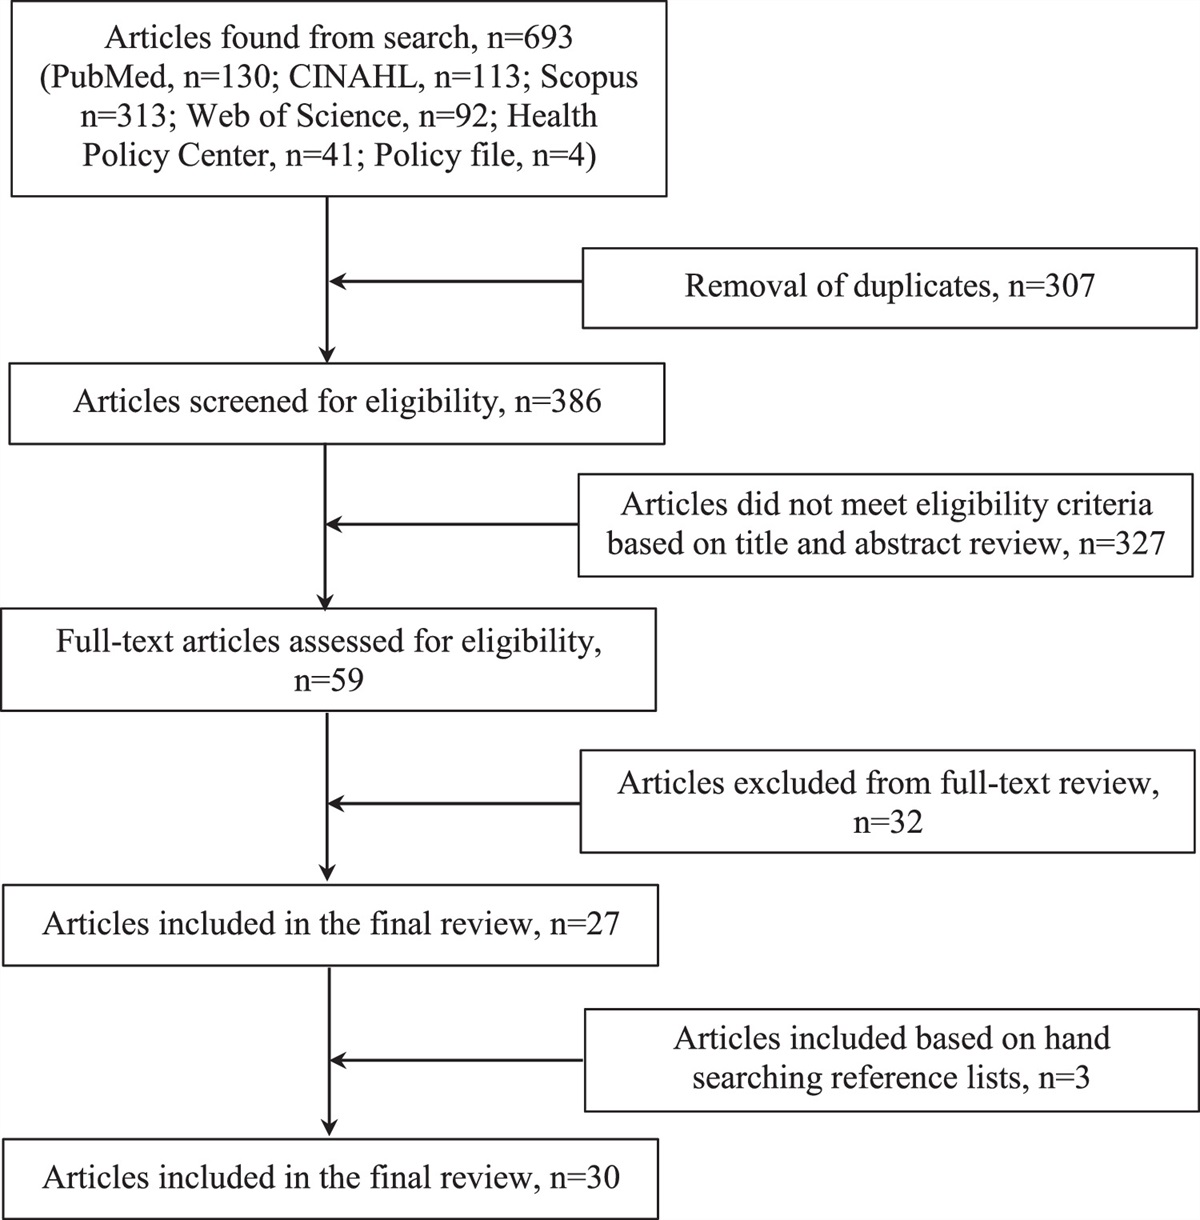
METHODS Study SettingsEligible participants were identified from our study’s common data model (CDM) implemented at 3 KP Regions: Kaiser Permanente Colorado (KPCO), Georgia (KPGA), and Mid-Atlantic States (KPMAS). All 3 KP Regions are primarily group-model integrated delivery systems but differ in important patient population demographic characteristics and mode and timing of virtual visit implementation.39–41
Under a ceding arrangement, the IRBs of KPCO, KPGA, and KPMAS collectively reviewed and approved the study protocol.
Data SourcesThe samples of patients with incident NBP visits for 2016–June 2021, visit modes and pandemic phases, and classes of ancillary services associated with incident NBP visits were extracted from each site’s identically configured CDM using distributed programming code.39
Study SampleAn incident NBP visit was defined as: a completed visit (ie, canceled appointments and opened but incomplete visits were excluded); with an ICD-10 diagnosis identified as primary or principal; provided as routine or urgent ambulatory care (defined by the department of service—such as the department of family medicine, general internal medicine, or urgent or after hours care or an equivalent virtual visit program such as KPCO synchronous chats or KPMAS “house calls”), provided to a patient ≥19 years of age, and, with no NBP visit within the prior 180 days.
ICD-10 lists for NBP were derived from the translation of ICD-9 lists used in the VA.42 Lists were edited per discussions among investigators and recommendations of the study Advisory Committee. Our focus was on pain likely attributable to the nontraumatic injuries to the vertebral column. The list excluded injuries or trauma (closed, open fractures, and contusions), neurogenic pain, and related conditions. Osteoporosis of the spine was excluded since it tends to be “silent” with respect to pain. Disc degeneration, neck and back sprains, and strains were retained.
Measures Service OrdersA visit was associated with each of 5 ancillary service classes for NBP diagnosis or treatment in ambulatory care: neck/back x-ray, neck/back computed tomography/magnetic resonance imaging (CT/MRI), non-narcotic prescription strength analgesic, narcotic analgesic, and skeletal muscle relaxant. Order measures were dichotomous by class (ie, more than one order within a class was equivalent to one order within a class). Orders might be deferred for a short time after the visit (eg, one order pending findings from another service); therefore, orders within 5 days of the visit date were also considered a medical service order associated with the visit.43
Service Order FulfillmentsA medical service was considered to be fulfilled by the patient if at least one order in an NBP medical service order class was fulfilled within 30 days of the service order date. Order fulfillment within the service class is a dichotomous variable.
Visit ModeEach incident NBP visit was classified as virtual or in-person. A virtual visit was defined as a technology-mediated (phone or computer) synchronous patient–provider interaction. Virtual visits included: synchronous chats, telephone visits, and video visits. An in-person visit was defined as a face-to-face patient–provider interaction within an examination room at a KP clinic.
Pandemic PeriodsWe defined 3 COVID-19 pandemic periods when significant shifts in choice and availability of visit mode in the 3 KP Regions occurred: prepandemic (before April 2020 when the availability of virtual visits was gradually increasing), “national shutdown” (April 2020–June 2020 when limited in-person ambulatory services were available), and recovery (July 2020–June 2021 when in-person primary care became widely available again). In our current study, we examine NBP visits only during the prepandemic and recovery periods given the restricted availability of in-person visits during the short national shutdown period.
Patient CovariatesThe study CDM was our source of data for measuring: patient age at the time of the incident NBP visit, sex, race and ethnicity, Charlson comorbidity score based on ICD-10 diagnosis codes on any health care event in the 365-days before the NBP visit,44–46 and national percentile of an area disadvantage index for the patient’s residence at the time of the NBP visit.47,48 Because KP does not routinely collect individual-level socioeconomic measures, we use an area-level measure since, on average, it is correlated with the member’s socioeconomic status.49
Statistical AnalysisWe used inverse probability of treatment weighting (IPTW) to create weight sets for addressing the imbalance in patient case mix between visit modes and pandemic periods.50,51 Weight sets were created separately for orders and fulfillments by service class and by KP Region. Weight sets were estimated for one set of IPTW models with visit mode (virtual vs in-person) as the dependent variable and pandemic period (recovery vs prepandemic) as the dependent variable in another set. Independent variables in each IPTW model were the aforementioned “patient covariates”. This approach resulted in weight sets to balance patient case mix by visit mode or by pandemic period.
Our study design (Supplemental Fig. S1, Supplemental Digital Content 1, https://links.lww.com/MLR/C602) resulted in comparisons by visit mode and pandemic period for a percentage of incident NBP visits associated with: (1) a service class order, and (2) fulfillment of a service class order. Within the period (prepandemic or recovery), we compared IPTW-adjusted percentages of service class orders and fulfillments between virtual and in-person visits. These comparisons indicate if visit mode made a difference in the percentage of incident NBP visits associated with a service class order or fulfillment independent of the pandemic period. Between periods, we compared IPTW-adjusted percentages of service class orders and fulfillments for a visiting mode. These comparisons indicate if the period made a difference in the percentage of incident NBP visits associated with a service class order or fulfillment independent of visit mode. Comparisons within a set were assessed for significance using a 2-tailed χ2 test and P value ≤0.05.
We then conducted a series of analyses on the distribution of ratios of the percentage of orders and fulfillments to ascertain whether there was an overall pattern of parity or disparity by visit mode or pandemic period. Ratios were computed from the aforementioned IPTW cross-classifications (eg, 0.362 would be the ratio for 8.3% of virtual visits and 22.9% of in-person visits associated with a neck or back x-ray order in the recovery period). A Wilcoxon median test was used to compare medians of ratios between comparator sets (ie, virtual vs in-person visit within the period, or prepandemic vs recovery within mode). Significance of a pattern of disparity in orders or fulfillments was assessed with a 2-tailed median test and P value ≤0.05.
All data management and statistical analysis were conducted using SAS version 9.4 (SAS Institute).
RESULTSWithin and across the 3 KP Regions, patients presenting with incident NBP were generally similar (Table 1). A majority of adults with incident NBP visits were 50–64 years of age and females (Table 1). Most had no comorbidities. The demographic distributions of adults with incident NBP visits represented differences in the KP region’s overall membership. The majority of KPCO adult members are White; and, most incident NBP visits are among non-Hispanic Whites. The majority of KPGA and KPMAS adult members are Black; and, most incident NBP visits are among non-Hispanic Blacks. Neighborhoods in Denver/Boulder and DC/Baltimore and surrounding Maryland/Virginia suburbs are in the upper distribution of SES nationally; neighborhoods in the Atlanta are generally lower in the national distribution of SES.47 KPCO and KPMAS patients with incident NBP reside in relatively more advantaged SES communities in the national distribution; and, KPGA patients reside in relatively less advantaged communities.
TABLE 1 - Characteristics of Adults at the Time of Incident NBP Visits: Prepandemic Period and Recovery Period Prepandemic period: January 2017–December 2019* Prepandemic period: January 2019–March 2020† Recovery period: July 2020–June 2021† KPCO (%) KPGA (%) KPMAS (%) KPCO (%) KPGA (%) KPMAS (%) KPCO (%) KPGA (%) KPMAS (%) No. patients 111,095 67,486 198,899 55,632 36,205 107,885 41,170 26,951 81,725 No. visits 179,353 131,296 346,854 71,506 54,634 146,716 51,706 37,414 105,901 Visit mode Virtual 11,662 3100 14,059 5702 2726 9348 17,912 15,266 41,262 In-person 167,691 128,196 332,795 65,804 51,908 137,368 33,794 22,148 64,639 Age group 19–34 13.9 10.5 16.5 13.6 10.5 16.5 12.4 10.6 16.2 35–49 22.9 24.4 25.6 22.3 23.6 25.5 21.5 23.2 25.1 50–64 30.5 40.3 34.6 29.6 39.3 34.1 28.7 38.8 33.3 ≥65 32.6 24.8 23.4 34.5 26.6 23.9 37.5 27.3 25.4 Sex Female 59.9 62.8 61.4 59.8 63.0 61.7 61.1 63.9 61.9 Male 40.1 37.2 38.6 40.2 37.0 38.3 38.9 36.1 38.1 Ethnicity/race Hispanic 18.4 3.9 14.5 18.1 3.8 14.9 17.7 3.9 15.1 NH Black 6.5 49.9 44.1 6.5 52.1 44.9 6.5 55.8 45.3 NH Asian 2.9 4.3 10.4 2.9 3.8 10.3 3.0 3.7 10.4 NH White 66.1 36.6 25.7 66.1 34.4 24.8 65.7 30.8 23.6 Other 4.0 0.8 4.7 4.0 0.8 4.7 4.0 0.6 4.9 Unknown 2.1 4.6 0.6 2.3 5.2 0.4 3.1 5.2 0.7 Charlson Comorbidity Score 0 (none) 61.7 58.3 66.4 58.8 56.6 66.4 64.0 61.2 68.9 1 17.6 18.6 16.4 18.2 18.7 16.1 15.0 17.1 14.3 ≥2 20.7 23.1 17.2 23.0 24.6 17.5 20.9 21.7 16.8 Area Disadvantage Quartile Most advantaged 46.2 22.1 49.3 56.2 21.7 49.1 57.1 20.9 49.3 Upper mid-advantaged 39.5 34.7 27.6 37.9 34.5 27.7 37.3 34.7 27.7 Lower mid-advantaged 11.3 25.9 15.1 4.3 26.0 15.2 4.1 26.6 15.2 Least advantaged 3.0 17.2 8.1 1.5 17.8 8.0 1.5 17.9 7.8*For each KP Region, the January 2017–December 2019 sample is used in the analysis of “between mode within period” percentages of ancillary services orders and fulfillments (Supplement Fig. 1).
†For each KP Region, the January 2019–March 2020 sample (“Prepandemic”) and July 2020–June 2021 (“Recovery”) samples are used in the analysis of “between period within mode” percentages of ancillary services orders and fulfillments (Supplement Fig. 1).
KPCO indicates Kaiser Permanente Colorado; KPGA, Kaiser Permanente Georgia; KPMAS, Kaiser Permanente Mid-Atlantic States; NH, non-Hispanic; NBP, neck or back pain.
Incident NBP utilization rates and modes changed dramatically across the pandemic periods (Supplement, Table S1, Supplemental Digital Content 1, https://links.lww.com/MLR/C602). In the 15-month period before the national shutdown, most incident NBP visits were delivered in-person (Table 1). For example, between January 2019 and March 2020 at KPCO, only 8.0% (5702 of 71,506; Table 1) of incident NBP visits were delivered virtually. After the national shutdown, the percentage of incident NBP visits delivered virtually increased substantially in all 3 KP Regions. For example, the percentage at KPCO increased to 34.6% (17,912 of 51,706).
Service Orders Between Visit Modes Within PeriodTable 2 displays the percentages of incident NBP visits associated with an ancillary service order (by service class) for virtual and in-person visits in the prepandemic and recovery periods. The general pattern is that—in both periods—percentages of incident NBP visits with ancillary services orders were lower on virtual versus in-person visits (almost all comparisons significant for P ≤0.001). This disparity is particularly notable for NBP-related x-rays. For example, at KPCO, 4.1% of virtual visits but 18.6% of in-person visits in the prepandemic period, and 8.3% of virtual but 22.9% of in-person visits in the recovery period, were associated with a neck or back x-ray (Table 2).
TABLE 2 - Percentage of NBP Visits Associated With Service Orders: Comparisons Between Visit Modes Within Pandemic Period Service order class Comparison Pandemic period Region Visit mode X-ray (%) CT/MRI (%) Non-narcotic analgesic (%) Narcotic analgesic (%) Skeletal muscle relaxant (%) Between mode within period Recovery KPCO Virtual 8.3 8.2 7.0 9.8 14.4 In-person 22.9 10.7 15.9 11.2 18.7 P-value <0.001 <0.001 <0.001 <0.001 <0.001 KPGA Virtual 6.2 5.5 21.1 19.9 19.0 In-person 14.5 5.7 40.3 18.0 29.1 P-value <0.001 0.522 <0.001 <0.001 <0.001 KPMAS Virtual 10.6 5.9 21.1 5.2 25.1 In-person 17.2 7.0 35.5 7.0 31.1 P-value <0.001 <0.001 <0.001 <0.001 <0.001 Prepandemic KPCO Virtual 4.1 7.0 5.4 17.1 10.4 In-person 18.6 8.9 15.1 15.1 19.6 P-value <0.001 <0.001 <0.001 <0.001 <0.001 KPGA Virtual 3.3 7.2 9.5 14.1 11.8 In-person 14.9 6.7 36.7 20.8 34.9 P-value <0.001 0.220 <0.001 <0.001 <0.001 KPMAS Virtual 6.4 5.7 14.1 8.7 16.2 In-person 15.5 5.2 37.3 8.9 28.7 P-value <0.001 0.007 <0.001 0.374 <0.001 Ratio: percentage virtual/in-person Recovery median (IQR) 0.743 (0.524, 0.843) Prepandemic median (IQR) 0.413 (0.338, 0.977) P-value 0.125CT indicates computed tomography; IQR, interquartile range; KPCO, Kaiser Permanente Colorado; KPGA, Kaiser Permanente Georgia; KPMAS, Kaiser Permanente Mid-Atlantic States; MRI, magnetic resonance imaging; NBP, neck or back pain.
The median ratio of the percentage of ancillary service orders on virtual compared with in-person visits increased from 0.413 to 0.743 between the prepandemic and recovery periods (Table 2). The increase toward a ratio of 1.000 indicates greater parity in ancillary services across service classes, though the increase was not statistically significant (P = 0.125).
Service Orders Between Periods Within Visit ModeTable 3 displays the percentages of incident NBP visits associated with an ancillary service order (by service class) in the prepandemic and recovery periods separately by visit mode. The general pattern of service orders associated with incident NBP visits is that the percentage for virtual and in-person visits remained low overall, particularly for virtual visits but increased in the recovery versus prepandemic periods for both visit modes. For example, at KPCO, 3.4% of virtual visits in the prepandemic period but 8.3% in the recovery period were associated with an x-ray order; and, 18.8% of in-person visits in the prepandemic period but 22.8% in the recovery period were associated with an x-ray order (Table 3).
Across the 3 KP regions and service categories, the percentage increase between the prepandemic and recovery periods in ancillary services orders was greater for virtual than in-person visits. The median ratio of the percentage of ancillary service orders between the recovery and prepandemic visits was 1.216 for virtual visits versus 1.007 for in-person visits (P = 0.016; Table 3).
An exception to this pattern is narcotic analgesics orders, which tend to be less associated with NBP visits in the recovery period than in the prepandemic period. For example, at KPCO, 12.0% of NBP virtual visits in the prepandemic period but 9.7% in the recovery period are associated with a narcotic analgesic order; and, 12.7% of in-person visits in the prepandemic period but 11.4% in the recovery period are associated with a narcotic analgesic order (Table 3).
TABLE 3 - Percentage of NBP Visits Associated With Service Orders: Comparisons Between Pandemic Periods Within Visit Mode Service order class Comparison Visit mode Region Pandemic period X-ray (%) CT/MRI (%) Non-narcotic analgesic (%) Narcotic analgesic (%) Skeletal muscle relaxant (%) Between period within mode Virtual KPCO Recovery 8.3 8.2 7.1 9.7 15.3 Prepandemic 3.4 5.4 5.6 12.6 12.9 P-value <0.001 <0.001 <0.001 <0.001 <0.001 KPGA Recovery 6.2 5.5 21.0 20.1 19.5 Prepandemic 3.1 5.2 15.9 18.5 18.1 P-value <0.001 0.464 <0.001 0.055
留言 (0)