
記住我


The prevalence of combined chronic hand and foot eczema in industrialized cities is 5.4% []. Women are more frequently affected than men, with an incidence of 9.6 per 1000 compared with 4.0 per 1000 [].
Hand and foot eczema is considered to be chronic if it persists for >3 months despite adequate therapy or recurs with a frequency of more than twice a year []. It does not represent a homogeneous disease entity. The clinical picture, morphology, localization, and etiology can be very different. In general, 4 different etiologies of hand and foot eczema exist: allergic contact, acute-toxic, cumulative-toxic, and atopic hand and foot eczema []. Allergic contact hand and foot eczema is typically a type IV sensitization to diverse allergens such as nickel, cobalt, chromates, and fragrancies []. Cumulative-toxic hand and foot eczema occurs after repeated exposure to substances that only mildly irritate the skin. Over time, the regenerative capacity of the skin is exceeded, and the eczematous reaction becomes visible. Atopic hand and foot eczema develops on the basis of a genetic predisposition called atopic diathesis. It is therefore a localized variant of atopic eczema with a corresponding etiology [,].
The severity of eczema ranges from very mild to very severe, with therapy-refractory courses associated with intense pain and itching []. In addition, patients with eczema often have to face social stigmatization and struggle with feelings of shame []. These physical and psychological circumstances often lead to a radical reduction in quality of life and may even result in depression [].
More often than not, patients with eczema have limited knowledge of the pathogenesis of their skin condition and the correct disease management []. In many other diseases such as type 2 diabetes mellitus, patient education has proven to be an effective method to increase knowledge of the disease, thereby improving the clinical outcome. Coppola et al [] have shown that patient education is usually associated with an improvement in clinical knowledge, lifestyle, and psychosocial outcomes in comparison with usual care. In Germany, there are skin protection seminars run by employers’ liability insurance associations, but these are reserved for people whose eczema is caused or exacerbated by their professional activity.
In our department of dermatology, patient education alone for patients with psoriasis had no significant effect on the clinical outcome []. We therefore assume that one-time education of patients with chronic inflammatory skin conditions may not suffice to ameliorate the disease in the long term.
eHealth-based supporting systems for patients are becoming popular and are incorporated more frequently into patient care. Germany recently set up the German acronym for Digital Health Applications (DiGA) directory, which lists Conformité Européenne–marked medical devices that aim to detect, monitor, treat, or alleviate diseases or to detect, treat, alleviate, or compensate for injuries or disabilities []. Physicians (MDs) in Germany can prescribe eHealth devices listed in the DiGA directory. There are currently no DiGA directory–listed eHealth devices for patients experiencing hand and foot eczema in Germany, and scientific data on the beneficial effect of eHealth applications for these patients are missing.
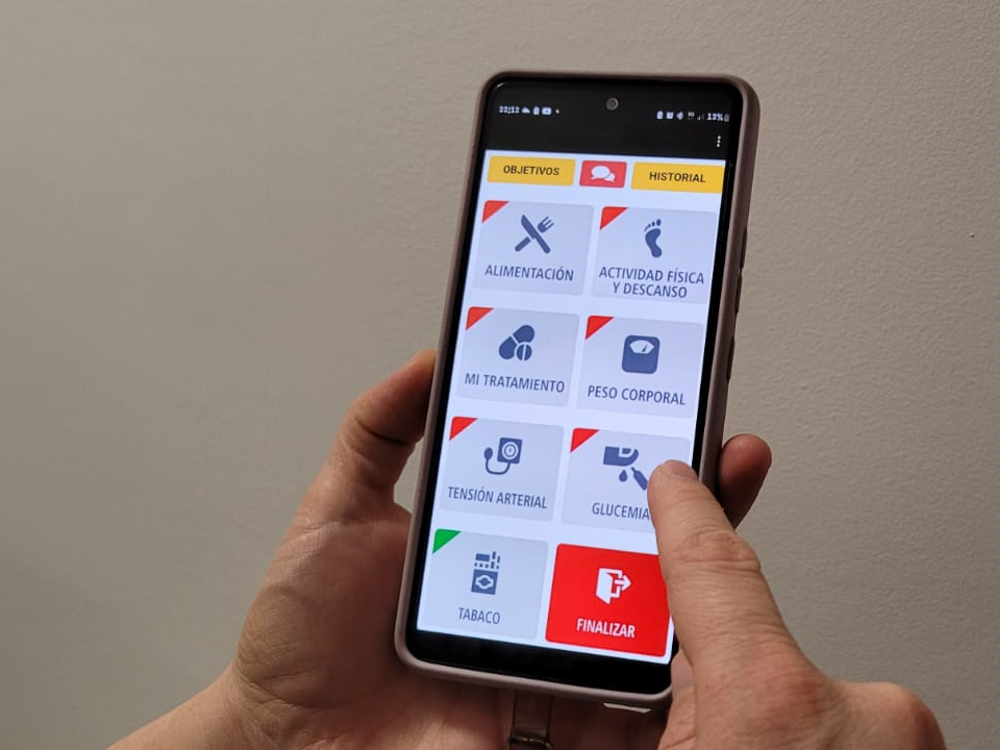
ObjectivesThe aim of this prospective randomized controlled intervention study was to analyze whether a monitoring smartphone app combined with patient education would improve the quality of life and clinical outcome of patients with hand and foot eczema. The study app was developed specifically for this study. With the app, our patients were able to periodically measure Dermatology Life Quality Index (DLQI) and Hand Eczema Severity Index (HECSI; modified version for foot eczema) scores, as well as the impact on activity and pain (both measured on a numeric rating scale [NRS]), and document the progression of their disease through photographs [-]. In addition, the app allowed patients to directly contact their own treating physicians through a chat function.
Furthermore, the DLQI, HECSI, and NRS (for activity and pain) scores were assessed by the treating physicians during personal visits at weeks 0 (before the intervention), 12, and 24.
The final aim behind the development of the app was to reduce waiting time for a physician’s appointment in case of an emergency by expanding teledermatological services for patients with hand and foot eczema and to allow precise self-monitoring by the patients.
The aim of this 60-week randomized controlled intervention study was to investigate the effect of patient education in combination with a monitoring smartphone app on patients experiencing chronic hand and foot eczema. This is an interim analysis of the data from study weeks 0, 12, and 24.
The study was carried out at the department of dermatology, venereology, and allergology at the University Medical Center Mannheim in Mannheim, Germany, from August 13, 2018, to August 30, 2021. The inclusion criteria included a physician-confirmed diagnosis of chronic hand and foot eczema, ability to give informed consent, access to a smartphone, and patient age between 18 and 75 years. During the first study visit (week 0 [V1]), the study participants were randomly assigned to the control or intervention group in a ratio of 1:1.
To assign patients to a group, we created 50 lots for the intervention group and 50 lots for the control group. These were sealed in an urn, and the patients were asked to draw lots.
In total, 90 participants were included in the study, but 3 (3%) dropped out of the study before they were assigned to a group. Of the 87 remaining participants, 43 (49%) were assigned to the intervention group and 44 (51%) to the control group.
The control group started the first study visit at week 0. Information on sociodemographic data, preexisting conditions, and previous and current therapies were collected, and standardized questionnaires such as the DLQI administered. In addition, patients’ current level of knowledge about their disease, severity of the disease measured using the HECSI or a modified form of the HECSI for foot eczema, and the intensity of the pain and itch measured using an NRS ranging from 0 to 10 were recorded. Furthermore, the negative impact on the activity measured using the NRS of patients was assessed. In-person follow-up visits were carried out at V2 and V3. The same parameters were recorded for the intervention group. In addition, these patients received a 2-hour detailed training session on pathogenesis, classification, therapeutic options, and behavioral recommendations from 2 dermatological specialists at our clinic. Each patient also received a personal access code to our app, DermaScope Mobile. Using this app, patients were able to take pictures of their hands and feet, use a chat function to ask questions that were answered by their treating dermatologists, and complete questionnaires on quality of life (DLQI) and current symptoms (NRS for itch and pain). Screenshots of the app can be found in the paper by Domogalla et al []. The highest possible app use frequency was once a week.
The quality of each image uploaded in the app by the patients was categorized by the rater (YS) as good or bad based on the following criteria: well-illuminated picture, sharp and focused image, and complete presentation of the hands and feet. All 3 criteria had to be met for the image to be rated as good. Each image was assigned to the rater (YS), who checked its quality based on these 3 criteria. If all criteria were met, the image was rated as of good quality. We then calculated an electronic HECSI (eHECSI) score based on these images and statistically examined the extent to which this score correlated with the HECSI score collected in person.
The primary end point of the study was to determine the effect of extensive patient training, physician-patient contact on demand, and our app on quality of life as well as itching and pain at weeks 12 and 24. The secondary end points were the effect on the disease outcome assessed with the HECSI at weeks 12 and 24. Modulating effects of sex, age, and disease duration were evaluated for each end point.
Ethics ApprovalThe medical ethics committee of the Medical Faculty Mannheim, Heidelberg University, approved the study (2017-655N-MA), and the implementation complied with the Declaration of Helsinki. All participants were instructed in detail regarding the study design and gave their informed consent before participating in the study.
Statistical AnalysisLinear panel data regression analyses estimated the trajectories in the outcomes. Random effect regressions determined the main and interaction effects of group membership (intervention vs control group) and visit time point (V1, V2, and V3) on DLQI, pain, daily activity, and HECSI scores. Two models of adjustment were calculated. The first model was unadjusted, whereas the second model was adjusted for sex, age, and disease duration. In additional analyses, the effects of app use frequency over 24 weeks were included (group membership: control vs <20% app use frequency vs ≥20% app use frequency). Therefore, the intervention group was divided into 2 groups: one comprised patients with app use frequency <20%, and the other was made up of patients with app use frequency ≥20% during the observation period of 24 weeks. The chosen cutoff of 20% equals app use frequency of once every 5 weeks. Variables were tested for normal distribution, and where relevant, they were transformed to approach normal distribution (power transform square root of DLQI and log10 of HECSI). All statistical analyses were performed using STATA Special Edition (version 14.0; StataCorp LLC).
To determine the extent to which the eHECSI score correlated with the HECSI score assessed at the face-to-face visit, we calculated Spearman correlation coefficients.
We also examined within the intervention group the socioeconomic factors that influenced the course of HECSI and DLQI.
shows mean values of the scales, shows the flowchart of the study, and - show predictive margins (delta method).
Table 1. Patient characteristics.aV: visit time point.
bData for BMI, smoking, and eczema duration were collected at the first visit only.
cDLQI: Dermatology Life Quality Index.
dHECSI: Hand Eczema Severity Index.
eData for app use frequency were calculated over the whole 24 weeks.
fN/A: not applicable.
 Figure 1. Flow chart of the study cohort and subcohorts.
  Figure 2. Progression of Dermatology Life Quality Index (DLQI), pain, activity, and Hand Eczema Severity Index (HECSI) in the control group (n=36) versus that in the intervention group (n=23). (A) Progression of DLQI over 24 weeks in the intervention group compared with that in the control group. Changes in both groups from baseline were significant (week 12: P=.006; week 24: P<.001). There were no significant differences between the groups (week 12: P=.09; week 24: P=.11). (B) Progression of pain scores over 24 weeks in the intervention group compared with that in the control group. Changes in both groups from baseline were not significant (week 12: P=.48; week 24: P=.28). There were no differences between the groups (week 12: P=.90; week 24: P=.27). (C) Progression of activity scores over 24 weeks in the intervention group compared with that in the control group. Changes in both groups from baseline were significant (week 12: P=.04; week 24: P=.001). There were no significant differences between the groups (week 12: P=.21; week 24: P=.26). (D) Progression of HECSI over 24 weeks in the intervention group compared with that in the control group. Changes in both groups from baseline were significant (week 12: P=.03; week 24: P=.002). There were no significant differences between the groups (week 12: P=.26; week 24: P=.14). Significance at P<.05. NRS: numeric rating scale.
  Figure 3. Progression of Dermatology Life Quality Index (DLQI), pain, activity, and Hand Eczema Severity Index (HECSI) in the control group (n=36) versus that in the intervention group with <20% app use frequency (n=8) versus that in the intervention group with ≥20% app use frequency (n=15). (A) Progression of DLQI over 24 weeks in the intervention group with <20% app use frequency compared with that in the intervention group with ≥20% app use frequency compared with that in the control group. Changes were significant in the <20% app use frequency group (week 12: P=.001; week 24: P=.049) but not in the ≥20% app use frequency group (week 12: P=.91; week 24: P=.39) compared with controls. (B) Development of pain scores over 24 weeks in the intervention group with <20% app use frequency compared with that in the intervention group with ≥20% app use frequency compared with that in the control group. Changes were significant in the <20% app use frequency group (week 12: P=.02; week 24: P=.02) but not in the ≥20% app use frequency group (week 12: P=.14; week 24: P=.91). (C) Development of activity scores over 24 weeks in the intervention group with <20% app use frequency compared with that in the intervention group with ≥20% app use frequency compared with that in the control group. Changes in the <20% app use frequency group were significant at week 12 but not at week 24 (week 12: P=.01; week 24: P=.17), whereas in the ≥20% app use frequency group (week 12: P=.98; week 24: P=.56), there were no significant differences. (D) Progression of HECSI over 24 weeks in the intervention group with <20% app use frequency compared with that in the intervention group with ≥20% app use frequency compared with that in the control group. Changes in the <20% app use frequency group were significant at week 12 but not at week 24 (week 12: P=.02; week 24: P=.12). There were no significant differences in the ≥20% app use frequency group (week 12: P=.94; week 24: P=.35). Significance at P<.05. NRS: numeric rating scale.
  Figure 4. Sex-specific progression of the Hand Eczema Severity Index in the intervention group over 24 weeks. Female participants in the intervention group were compared with male participants. Changes were significant only for the male participants (week 12: P=.008; week 24: P=.003). Significance at P<.05.
 In total, 90 patients were included in the study. The main reasons for declining participation were lack of time, amelioration of hand and foot eczema, or distance to our outpatient clinic.
Of the 90 patients who signed the informed consent form, 87 (97%) took part in the baseline visit and were randomized 1:1 to the intervention (n=43, 49%) or control (n=44, 51%) groups. Of the 90 patients initially included in the study, 3 (3%) dropped out of the study before the baseline visit. Of the 87 remaining patients, 23 (26%) discontinued the study after the baseline visit or the educational program (intervention group: 17/43, 40%, and control group: 6/44, 14%). Leading up to week 24, of the 64 remaining patients, 5 (8%) discontinued the study, resulting in 59 (92%) patients completing the week 24 visit ().
Effects of the Intervention on Quality of Life, Pain, Activity, and Clinical OutcomePatients in both the intervention and control groups showed an improvement in quality of life (DLQI) at weeks 12 (V2) and 24 (V3; week 12 [V2]: r=–0.56; P=.006; week 24 [V3]: r=–0.86; P<.001; ; ) compared with the baseline visits. No significant differences were observed between the control and intervention groups (r=–0.23; P=.42) and their progress (week 12 [V2]: r=0.45; P=.09; week 24 [V3]: r=0.42; P=.11; ), although the intervention group showed a greater improvement than the control group.
Regarding pain, patients in both groups showed no significant amelioration over time compared with the baseline visits (V2: r=0.48; P=.48; V3: r=–0.74; P=.28; ; ). There were no significant differences between the intervention and control groups (r=0.46; P=.53) and their trajectories (V2: r=0.11; P=.90; V3: r=0.96; P=.27; ).
A significant improvement was observed in the activity score from V1 until V3 (V2: r=–1.39; P=.04; V3: r=–2.35; P=.001; ; ). There was no difference between the 2 groups (r=0.08; P=.92) and their progress (V2: r=1.09; P=.21; V3: r=0.99; P=.26; ).
There was also a significant improvement in the severity of eczema as assessed by the HECSI in both groups compared with the baseline visits (V2: r=–0.51; P=.02; V3: r=–0.72; P=.002; ; ). There was no difference between the groups (r=–0.16; P=.56) or their trajectories (V2: r=0.33; P=.26; V3: r=0.43; P=.14; ). All results were independent of sex, age, or disease duration (model 1; ). shows mean values of the scales, whereas shows predictive margins (delta method).
Table 2. Random effect regression models over 24 weeks. Model 0 unadjusted, and model 1 adjusted for age, sex, and disease duration (n=59; observations=177).AssessmentModel 0Model 1aDLQI: Dermatology Life Quality Index.
bRef: reference value.
cN/A: not applicable.
dHECSI: Hand Eczema Severity Index.
An App Use Frequency of Fewer Than Once Every 5 Weeks Leads to a Significant Amelioration of Quality of Life, Pain, Activity, and Extent of EczemaWhen analyzing the outcomes in regard to app use frequency, the subgroup with an app use frequency of <20% showed a highly significant improvement in quality of life (DLQI) compared with the control group (V2: r=–1.23; P=.001; V3: r=–0.73; P=.05; ; ). Overall, <20% app use means an app use frequency of <5 times over the study period. For the subgroup with ≥20% app use, there was no significant difference in the DLQI score compared with the control group (V2: r=–0.03; P=.91; V3: r=0.25; P=.39; ; ).
The pain also improved significantly in the subgroup with <20% app use frequency compared with the control group (V2: r=–2.96; P=.02; V3: r=–2.97; P=.02; ; ). In the subgroup with ≥20% app use frequency, there was again no significant effect (V2: r=1.41; P=.14; V3: r=–0.11; P=.91; ; ).
In regard to the activity score of the patients, a significant improvement in the subgroup with <20% app use frequency in comparison with the control group was noted for V2, but not for V3 (V2: r=–3.07; P=.01; V3: r=–1.76; P=.17; ; ). There were no significant differences in the subgroup with ≥20% app use frequency (V2: r=–0.03; P=.98; V3: r=–0.57; P=.56; ; ).
The HECSI showed a significant improvement in the subgroup with <20% app use frequency in comparison with the control group at V2 but again not at V3 (V2: r=–0.99; P=.02; V3: r=–0.65; P=.12; ; ). There were again no significant differences in the subgroup with ≥20% app use frequency in comparison with the control group (V2: r=0.03; P=.94; V3: r=–0.31; P=.35; ; ). Again, all results were independent of sex, age, or disease duration (model 1; ).
Table 3. Random effect regression models of the app use frequency subgroups <20% and ≥20% over 24 weeks. Model 0 unadjusted, and model 1 adjusted for age, sex, and disease duration (n=59; observations=177).AssessmentModel 0Model 1aDLQI: Dermatology Life Quality Index.
bRef: reference value.
cHECSI: Hand Eczema Severity Index.
Male Patients Profit More From the Intervention Regarding the Clinical OutcomeIn a further subgroup analysis of the intervention group in regard to the sex-specific development of the HECSI, we found a significant improvement in the HECSI compared with baseline only for male participants (V2: r=–1.06; P=.008; V3: r=–1.21; P=.003).
Correlation of the eHECSI With the HECSICorrelating the eHECSI assessed on the basis of pictures taken by the patients of their hands and feet with the HECSI recorded by physicians during regular personal visits, the eHECSI correlated strongly with the in-person–assessed HECSI (r=0.898; P=.002) even when the quality of the images was not that good. If the pictures were of good quality,
留言 (0)