
記住我
The proband was a male born at term with respiratory failure. Soon thereafter, he developed bilateral pneumothoraces and was noted to have suprasystemic pulmonary hypertension with right-to-left flow across a large patent ductus arteriosus. He was initially treated with inhaled nitric oxide and later transitioned to oral sildenafil. By age 3 months, he was weaned off mechanical ventilation when an echocardiogram showed right ventricular pressure less than half of systemic pressure. He was discharged home, self-ventilating on room air with no requirement for pulmonary hypertension medications.
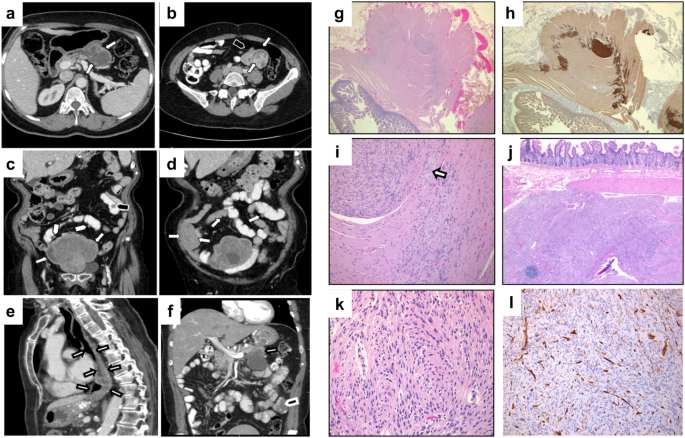
At age 15 months the proband returned for follow-up and was noted to be intermittently tachypneic. Echocardiogram and cardiac catheterization showed pulmonary hypertension, and sildenafil was reinitiated. A chest CT showed a paucity of lung markings and perihilar peribronchial wall thickening (Fig. 1A). Over the subsequent 2 years, his lung disease progressed, with a 4 L oxygen requirement and moderate pulmonary hypertension treated with tadalafil and bosentan. Spirometry was consistent with restrictive lung disease, with reduced FVC at 0.8 L (0.8 L; 66% predicted), FEV1 of 0.78 L (0.78 L; 71% predicted), and high FEV1/FVC ratio (0.97). Neither lung volumes nor diffusion capacity could be assessed due to his young age. Throughout this time his physical examination was notable for retractions with exercise, lung fields clear to auscultation, and widely spaced first and second toes that is typically observed in TBX4-related ischiocoxopodopatellar syndrome with or without pulmonary arterial hypertension (Fig. 1B).
Fig. 1: Clinical features of proband with TBX4 intronic variant.
A Chest CT at age 15 months showing perihilar peribronchial wall thickening with a paucity of peripheral lung markings. B Feet morphology showing widely spaced first and second toes bilaterally. C Family pedigree demonstrating inheritance of the TBX4 c.401 + 3 A > T variant and the chromosome 3 and 20 duplications. Arrow denotes the proband. Abbreviations: PAH, pulmonary arterial hypertension; ILD, interstitial lung disease. D Sanger sequencing of TBX4 in family. Arrows depict the c.401 + 3 A > T variant in the proband, father, and deceased sibling. The * denotes the typical sequence in the mother and healthy sister. E Postmortem lung showing nearly absent alveolar development in the proband’s sister, who died at 2 days of age (hematoxylin and eosin; original magnification, 40x).
Genetic testing resultsInitial testing for genetic causes of respiratory disease and PAH (including sequencing for FOXF1, SFTPB, SFTPC, ABCA3) was negative. A chromosomal microarray (CMA) revealed two copy number variants (CNV); 3.2 Mb gain (3 copies) on chromosome 3p12.3-p12.2 (hg19; chr3:79216405–82396278), including two genes ROBO1, GBE1 and a ~300 Kb gain (3 copies) on chromosome 20p13 (hg19; chr20:859816–1171343), both inherited from the mother and considered to be of unclear significance. The family was enrolled in the IRB-approved Gene Discovery Core protocol of the Manton Center for Orphan Disease Research for determination of an underlying genetic cause. Subsequently, whole-exome sequencing on a research platform revealed a novel intronic variant in TBX4 in close proximity to the canonical donor splice site of exon 3 (hg 19; chr17:59543302; c.401 + 3 A > T) that was paternally inherited (Fig. 1C, D). It was not observed in the 141,456 subjects in the gnomAD database and is predicted to affect splicing by its position at the highly-conserved 3rd base position of the donor splice site and Alamut visual version 2.11 (Interactive Biosoftware, Rouen, France) for bioinformatic splice prediction20. The mutation was confirmed clinically by a CLIA-certified laboratory. The whole-exome sequence also identified the CNV on chromosome 3 previously seen by CMA. The variant was of 6.9 Mb size (hg19; chr3:78,987,751-85,851,346) containing CADM2, GBE1 and ROBO1 (not full length, involves only exons 1–16 of 31 exons; ROBO1 full length coordinates are chr3:78,646,388–79,817,059) genes and was also present in the mother (Fig. 1C).
Family history and familial testing for TBX4 splice variantFamily history was notable for death of the proband’s sister on day 2 of life with an intracranial hemorrhage on ECMO, after presenting with profound hypoxemia, pneumothoraces and persistent pulmonary hypertension of the newborn; autopsy showed no substantial alveolar development, consistent with acinar dysplasia (Fig. 1E). The proband’s father (age 33 year at last visit) had foot morphology similar to the proband and reported asthma-like symptoms with full pulmonary function testing confirming moderate obstructive lung disease without any restriction or significant diffusion defect and only mild bronchial wall thickening on CT chest. He subsequently underwent a transthoracic echocardiogram that showed ventricular septal distortion during systole consistent with mild pulmonary hypertension. Sanger sequencing of the DNA extracted from the deceased sister’s postmortem lung tissue confirmed the same TBX4 variant. Neither the proband’s mother nor his living sister carried the TBX4 variant; both were healthy without skeletal or respiratory findings at last follow-up. The DNA obtained from the deceased sibling was of inadequate quality to evaluate for copy number change on chromosome 3 which was seen in proband and the mother.
Reduced TBX4 expression resulting from novel splice variantAs lung tissue from the proband was not available for analysis of TBX4 alternative splicing, we generated lymphoblastoid cells lines from peripheral blood mononuclear cells (PBMC) isolated from the proband and a healthy control for analysis of TBX4 alternative splicing resulting from the c.401 + 3 A > T variant. This approach was based on prior studies that were able to detect TBX4 expression from EBV-transformed lymphoblastoid lines to reveal pathogenic alternative splicing in a family with ischiocoxopodopatellar syndrome12,19. The exon-spanning primers used for these studies are depicted in Fig. 2A with respect to the TBX4 cDNA. While TBX4 expression was not detected from primary PBMCs (data not shown), the expected 515 bp band was amplified by PCR from cDNA derived from the lymphoblastoid lines and sequencing confirmed the identity of this product as the correct TBX4 sequence (Fig. 2B and data not shown). Smaller or larger molecular weight bands to implicate exon skipping or intron inclusion, respectively, were not observed in the proband’s sample by this method; however, TBX4 transcript levels were reduced in the proband compared to control lymphoblastoid lines (Fig. 2B). To confirm this reduced expression, qPCR was performed on control- and proband-derived lymphoblastoid lines using primers to amplify exon 8. Of note, a prior study describes another intronic c.282-1 G > A variant that produced two alternatively spliced transcripts by RNA sequencing at low frequency including c.282delG and c.282_284delGAG identified in 0.7% and 3.3% of total reads, respectively19. This analysis confirmed reduced expression of TBX4 in proband-derived lymphoblastoid cells compared to control cells (Fig. 2C), demonstrating a disruption of TBX4 expression resulting from this variant.
Fig. 2: Reduced TBX4 expression in proband-derived lymphoblastoid cell lines.
A Schematic of TBX4 genomic structure (top) and spliced cDNA (bottom). Primer pairs used in B and C are depicted. B PCR analysis of TBX4 transcript using primers P1 and P2 on cDNA derived from 1ug or 2ug of RNA isolated from control (CTRL) or proband-derived (PT) lymphoblastoid cell lines (left panel). PCR analysis of β-tubulin transcript was used as a control (right panel). H2O denotes water control and L denotes the 1 Kb ladder. C qPCR analysis of TBX4 expression using primers qP1 and qP2 on control and proband-derived lymphoblastoid cell lines. Data is normalized to GAPDH expression and is expressed relative to control sample expression. Two biologic replicates included per experiment that were repeated N = 2. P-value determined by Student’s 2-tailed t-test. Error bars reflect standard deviation.
留言 (0)