Clinical data collection
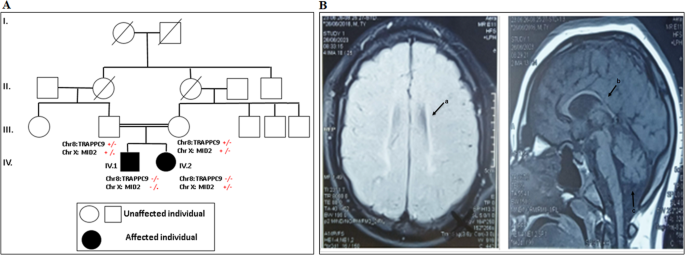
Patients with the homozygous ELP1 variant were recruited from Great Ormond Street Hospital in the United Kingdom. The patients were clinically assessed by pediatric neurologists and medical geneticists. Patient 2 underwent a skin biopsy as a part of the clinical diagnostic investigation and skin fibroblasts were obtained and cultured for functional analyses.
Whole-genome sequencing
Whole-genome sequencing was carried out via the 100,000 Genomes Project [34]. A number of standardized panels from the Genomics England PanelApp were subsequently applied to the data (https://panelapp.genomicsengland.co.uk/) and a review of prioritized variants outside the panels was also undertaken. Targeted sequence analysis by bidirectional Sanger sequencing was used to confirm the presence of the variant in both siblings. Full informed consent was obtained to participate in the 100,000 Genomes Project.
DNA constructs
Codon-optimized open reading frames of ELP1 (O95163), ELP2 (Q61A86) and ELP3 (Q9H9T3) from Homo sapiens were cloned into pFastBac1 HTa. ELP3 was cloned with an additional in-frame Twin-strep-Tag at its 3ʹ end. The ELP123 construct was generated using Gibson assembly [35] by amplifying all three genes in PCR with primers adding specific overhangs on 5ʹ and 3ʹ sides of each expression cassette, allowing to determine the specific order of the ORFs. Subsequently, the amplified modules were assembled within the pBiG1a plasmid using established protocols and primers. Mutations in ELP123 were introduced by QuikChange mutagenesis. The construct for production of the ELP456 complex from Homo sapiens in insect cells was previously described [5]. As for the human ELP1 plasmid construction, a pair of primers were designed to amplify the region between amino acid 715 to 1332 with NcoI and XhoI sites. The PCR products were treated with NcoI and XhoI and cleaned using a DNA extraction kit. The double digested DNA fragments were then cloned into pETM11 vector.
Recombinant protein production and purification
For ELP123 protein expression, SuperSf9-3 cells were infected with multiplicity of infection (MOI) = 1 and grown for 3 days at 27 °C on a shaking platform. Subsequently, insect cells were lysed in Lysis Buffer (for ELP123: 50 mM HEPES pH 7.5, 100 mM NaCl, 2 mM DTT, 5% glycerol, DNase I, protease inhibitors; for ELP456: 50 mM HEPES pH 7.5, 150 mM NaCl, 2 mM MgCl2, 2 mM DTT, 5% glycerol, 10 mM imidazole, DNase I, protease inhibitors) by 3 cycles of freezing and thawing in liquid nitrogen and sonication, followed by two-step centrifugation (4 °C; 1 h; 80,000 × g). ELP123 variants were purified using StrepTrap HP 5 ml column (GE Healthcare) eluted in Strep Elution Buffer (50 mM HEPES, 100 mM NaCl, 1 mM DTT, 5% glycerol, 10 mM d-desthiobiotin, pH 7.5), followed by affinity chromatography on HiTrap Heparin HP 5 ml column (GE Healthcare) eluted in a gradient of Heparin Elution Buffer (50 mM HEPES, 1 M KCl, 1 mM DTT, pH 7.5). Finally, eluates were run on Superose 6 Increase 10/300 GL column (GE Healthcare) in 20 mM HEPES pH 7.5, 100 mM NaCl, 5 mM DTT. ELP456 supernatants were purified on IgG agarose beads (Merck) followed by overnight Tobacco Etch Virus (TEV) protease cleavage in Cleavage Buffer (50 mM HEPES pH 7.5, 150 mM NaCl, 2 mM MgCl2, 2 mM DTT). On the next day, the protein sample was applied to a S200 Increase 10/300 GL column (GE Healthcare) equilibrated in 20 mM HEPES pH 7.5, 100 mM NaCl, 2 mM MgCl2, 5 mM DTT. Selected fractions were pooled and concentrated with on an Amicon Ultra-0.5 (100 kDa cut-off) concentrator. Aliquots were frozen in liquid nitrogen and stored at −80 °C for further use.
For human ELP1715-1332 production, the plasmids were transformed into BL21 pRARE cells. The purification of ELP1CT has been described previously [19]. In details, the cells were inoculated and cultured in LB at 37 °C. IPTG (0.3 M) was added until the OD600 reached 0.6 and the cell culture was then incubated at 16 °C for 18 h with shaking. The cells were then collected and lysed in lysis buffer (50 mM Tris pH 7.5, 100 mM NaCl, 20 mM imidazole, 1 mM MgCl2, 2 mM B-ME 10% glycerol). The debris was removed by centrifugation and the protein containing supernatant was mixed with NiNTA resin for target protein purification. The binding was performed at 4 °C for 1 h and the beads were washed by washing buffer (50 mM Tris pH 7.5, 100 mM NaCl, 200 mM KCl, 20 mM imidazole, 1 mM MgCl2, 2 mM B-ME 10% glycerol). The bound protein fraction was eluted with elution buffer (50 mM Tris pH 7.5, 100 mM NaCl, 8 mM imidazole, 1 mM MgCl2, 2 mM B-ME 10% glycerol). The elute was further loaded onto a S200 10/300 increase gel filtration column for obtaining a homogenous sample. Selected fractions were pooled and concentrated with on an Amicon Ultra-0.5 (30 kDa cut-off) concentrator. Aliquots were frozen in liquid nitrogen and stored at −80 °C for further use.
nanoDSF
ELP1 proteins were prepared at 1 g/l concentration in 50 mM Tris pH 7.5, 100 mM NaCl, 2 mM DTT and loaded into capillaries. The changes of intrinsic fluorescence of the target protein upon heating were monitored using the PROMETHEUS PANTA (Nanotemper Technologies) and the unfolding profiles were determined by MO-analysis from at least three independent experiments (Nanotemper Technologies). The statistical analysis (p value) of results from triplicates was performed using t test (two-tails).
ELP123456 in vitro pull-down
For pull-down experiments, the ELP123WT subcomplexes were immobilized on the Dynabeads MyOne Streptavidin C1 resin (ThermoFischer) via the Twin-Strep-tagged ELP3 protein and incubated with the ELP456 variants for 30 min at 4 °C, washed 3 times in Wash Buffer (20 mM HEPES pH 7.5, 100 mM NaCl, 1 mM DTT, 0.05% Tween 20).
The ELP456WT subcomplexes were immobilized on Anti-DYKDDDDK (PierceTM) resin via FLAG-tagged ELP6, incubated for 30 min at 4 °C and washed three times in Wash Buffer (same as for Streptactin pull-down). For both pull downs, the proteins were liberated from the beads by heating the sample in SB for 5 min at 95 °C before loading the inputs and pull-downs on the SDS-PAGE gels and visualizing by Coomassie staining. Band intensities were quantified using ImageJ and the statistical analysis (p value) from triplicates was performed using t test (two-tails).
Structure modelling
The predicted human ELP1, ELP2 and ELP3 protein atomic models were obtained from the online prediction software Alphafold2 (AF-O95163-F1, AF-Q61A86-F1, AF-Q9H9T3-F1). The individual model was fitted into the yeast Elongator 123 density (PDB: 6qk7) using Chimera (version 1.2). The tRNA (PDB: 1ehz) was taken from the Protein Data Bank and fit into the human Elongator based on the yeast tRNA fit. The analysis of ELP1 Lys815 was performed using the density and model of the ELP1 C-terminus (PDB: 5CQR) solved by crystallography. The analysis and figures were performed using Pymol, the Molecular graphics system (version 2.0 Schrödinger, LLC).
In vitro-transcribed tRNAs
The tRNA was produced using the T7 RNA polymerase-mediated run off method [36]. The DNA template contained a T7-promoter sequence and followed by the tRNAGlnUUG sequence. The in vitro transcription reaction was performed in a 500 µL volume containing DNA template, T7 RNA polymerase and reaction buffer (20 mM Tris, pH 8.0, 5 mM DTT, 150 mM NaCl, 8 mM MgCl2, 2 mM spermidine, 20 mM NTPs, RNasin, and pyrophosphatase). The reaction was performed at 37 °C for overnight and followed by DNaseI treatment to remove DNA templates. The product was then purified using a DEAE column and heat treatment at 80 °C for 2 min and followed by slow cooling process to room temperature as the re-annealing process. To obtain a homogenous tRNA population, the samples was subjected to a S75 Increase gel filtration column and the tRNA containing fractions were pooled and stored at -80 °C. For MST assays, the internally Cy5-labelled in vitro-transcribed human tRNAGlnUUG was produced as mentioned above where the additional 5% of Cy5-CTP was introduced in the reaction.
Acetyl-CoA hydrolysis assay
Purified ELP123 (0.475 μM) was mixed with 10 μM in vitro-transcribed tRNAGlnUUG in presence of 500 μM acetyl-CoA in 1x acetyl-CoA Assay Buffer (MAK039, Sigma) and incubated in a thermocycler for 30 min at 37 °C. To remove proteins and tRNAs, the samples were passed through a 3 kDa cut-off concentrator (EMD Millipore). The flow-through was collected and subjected to an acetyl-CoA assay kit (MAK039, Merck) for quantitation determinations. The reactions were performed according to the manufacturer’s instructions. Fluorescence intensity was measured using a plate reader (TECAN) at the probe-specific excitation (535 nm) and emission (587 nm) wavelengths. The measurements for individual conditions were calculated from at least three independent experiments. The graphs were prepared using Prism v8.0.2 (GraphPad) software.
Microscale thermophoresis (MST) for tRNA binding assay
The Cy5-labelled tRNAGlnUUG (14 nM) was incubated with serial dilutions of purified ELP123 variants (starting from 1.5 μM) in MST Buffer (20 mM HEPES, 100 mM NaCl, 5 mM DTT, pH 7.5, 0.05% Tween 20) at 4 °C for 30 min. The samples were applied to capillaries (MO-K025, Nanotemper Technologies) and the measurements were performed using Monolith Pico (Nanotemper Technologies) with 60% excitation power at 25 °C. Obtained data were analyzed and dissociation constant values were calculated using MO.2 Affinity software (Nanotemper Technologies) from at least three independent repeats. The graphs were prepared using Prism v8.0.2 (GraphPad) software.
Fibroblast culture
Patient fibroblasts were obtained via punch biopsy and control fibroblasts (TIG-102) were purchased from JCRB Cell Bank. The cells were cultured at 37 °C with 5% CO2 in Dulbecco’s Modified Eagle’s Medium (11995065, ThermoFisher) with 10% FBS (10099141, ThermoFisher) and added penicillin/streptomycin (15070063, ThermoFisher). The cells were harvested, diluted, and plated to obtain single cell-derived clones. The clones were expanded in culture for two additional passages and dissociated by trypsinization (25200072, ThermoFisher). All centrifugation steps were performed at 1000 × g for 5 min. Approximately 2 million cells were harvested for tRNA modification analyses.
tRNA modification analyses
Fibroblasts were homogenized in a TRIzol reagent (Life Technologies) using tissue homogenizer (Bertin Technologies). Total RNA and tRNA extraction, tRNA hydrolysis to ribonucleosides and tRNA modification analysis were performed as previously described [4].
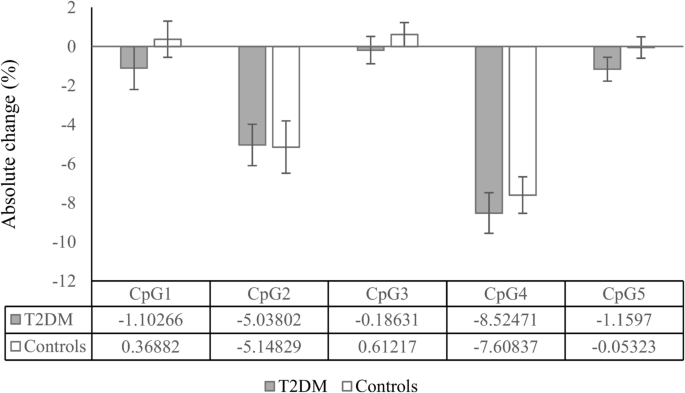
High-performance liquid chromatography coupled to mass spectrometry was performed using a Luna Omega 1.6 μm, Polar-C18 100 Å column (150 mm × 2.1 mm, Phenomenex, Australia). Mass spectrometry parameters were determined for the ribonucleosides using multiple injections of 0.1–1 ng of purified ncm5U, mcm5U and mcm5s2U nucleosides (a generous gift from Sebastian Leidel, University of Bern, Switzerland) and commercially obtained m7G (Santa Cruz Biotechnology). Retention times were determined based on the available compounds (ncm5U, mcm5U, mcm5s2U and m7G) and for m1A based on the previously published results [37]. Peak assignment and quantification were performed using MultiQuant-v2.1.1 (ABSciex) software. Pseudouridine (Ψ) was used to normalize the data. Statistical analysis was performed using Prism v9.4.0 (GraphPad) software. Number of replicates, the statistical test and statistically significant differences are indicated in the figure legend. Differences between groups were considered statistically significant for p ≤ 0.05.
RNA extraction, reverse transcription cDNA synthesis and qPCR
Total RNA was extracted from the patient’s and control fibroblasts (2.5 × 10⁶ cells per genotype) using RNaesy Mini Kit (Qiagen, 74904) according to the manufacturer’s protocol. On-column DNA digestion was performed using RNase-Free DNase Set (Qiagen, 79254). First-strand cDNA was synthesized from 1 μg of total RNA with oligo(dT) hexamers using SuperScript™ III First-Strand Synthesis System (ThermoFisher, 18080051). cDNA was stored at −20 °C for future use. For qPCR analysis, each cDNA sample was diluted 10 times with nuclease-free water. Quantitative PCR (qPCR) analysis was performed using QuantstudioTM 7 Flex system (Applied Biosystems). Each 10 μl reaction contained 40 ng of cDNA, qPCR Master Mix (ThermoFisher, 4444556) and ELP1 (FAM, HS00175353_m1) and GAPDH (VIC, HS02786624_g1) TaqMan probes. The amplification program was as follows: 95 °C for 10 min, 40 cycles at 95 °C for 15 s and 60 °C for 1 min. The expression of ELP1 mRNA was normalized to GAPDH expression. Number of replicates, the statistical test and statistically significant differences are indicated in the figure legend.

留言 (0)