
記住我


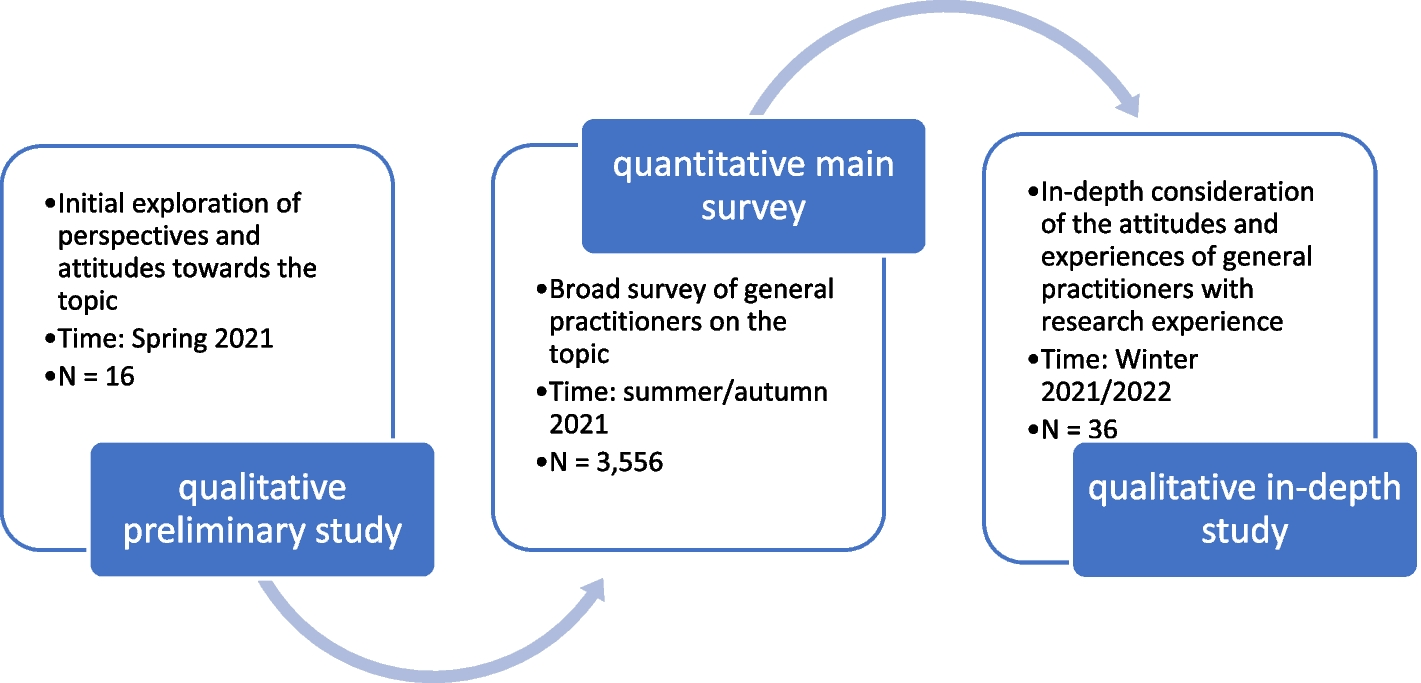
Asset Mapping Score Analysis is conducted in five steps (Fig. 1). First, the study team determines the content and functional areas to study by reviewing the existing data and knowledge gaps. In the second step, an initial list of organizations to be surveyed is compiled. Additional organizations can be added to the study as it proceeds and new organizations are identified. Third, the questionnaire or any other data collection forms are developed and revised. The fourth step is data collection, which involves contacting organizations and inviting them to participate in the study by completing the questionnaire and collecting any other data as indicated by the study topic and population. Finally, the data is tabulated to calculate the sum of all Asset Mapping Points for each functional and content area. The following sub-sections will describe each step in more detail and also provide information about how these steps were collected for the study of MCH organizations in New Orleans.
Fig. 1
Asset Map Score Analysis (AMSA) Study Design
Step 1: content and functional area developmentThe first step in AMSA is to develop content and functional areas to evaluate, which serve as the primary variables analyzed in this method. Functional areas are broader categories of the domain of work performed, whereas the content areas are more specific topics. AMSA studies will likely have fewer functional areas than content areas. This step can be completed by conducting a thorough review of the literature on the topic, accessing local and national key performance metrics, and refining topics by soliciting input and feedback from community leaders, key stakeholders, academic experts, and government officials.
For the study of MCH organizations in New Orleans, after completion of a literature review, content areas and functional areas were derived using three major sources: 1) the American Academy of Pediatrics (AAP) Bright Futures outcomes, 2) the national performance measures from the Health Resources and Services Administration Maternal and Child Health Bureau (HRSA MCHB); and 3) establishing and collaborating with a working group that included MCH academic staff at Tulane University, local government officials, and New Orleans MCH community leaders and key stakeholders [28, 29]. Content areas were finalized by consolidating similar measures from each source and, to focus on the goals of this project more closely, removing measures that had only a direct clinical component.
Step 2: identifying organizationsThe next step in AMSA requires determining which organizations to invite to participate in the study. To do this, researchers can use pre-existing lists or registries of related organizations that work in that field. Study staff can also search the internet using relevant key terms to identify additional organizations. If a working group was formed in the first step, the research team could also inquire with members of the group about organizations who may be eligible. Finally, snowball sampling methods can be employed where responding organizations are allowed to recommend additional organizations. During this stage, the study team also identifies eligibility and exclusion criteria based on desired outcomes.
For the New Orleans MCH study, this step was completed using four sources. First, study staff utilized a list of current and former partners of the Tulane Center of Excellence in Maternal and Child Health of organizations. Second, a local government organization provided a list of their partner organizations related to MCH. Third, an extensive online search was conducted to find any additional organizations not included via the first two sources. Search terms included content areas of interest listed below along with the term “New Orleans” (e.g., “breastfeeding New Orleans”). Results from these three sources were combined, duplicate organizations were removed, and an initial list of organizations was created. The fourth method for identifying organizations was snowball sampling. Online questionnaires were delivered as described below, and respondents had the option to recommend additional organizations to participate. Organizations discovered via snowball sampling who met the eligibility criteria were invited to participate in the study.
To be eligible for inclusion in the sampling frame, an organization had to be involved directly or indirectly in work related to the health of women, children, and/or families. Organizations were excluded if they were 1) exclusively educational institutions (e.g., K-12 schools), 2) exclusively provided medical care (e.g., hospitals, clinics, pharmacies, outpatient rehabilitation services, etc.), or 3) exclusively involved in childcare (e.g., preschool or daycare). Additionally, any organization that self-identified as not working in the MCH field was excluded.
Step 3: questionnaire developmentThe third step in the AMSA approach is the development of the questionnaire that will be used to collect data, most likely a questionnaire or survey. The questionnaire will ask all participating organizations to identify the functional and content areas in which they work. Additional questions can be added, and these questions will be determined based on the goals and specific research questions of the study, the needs of the community and its unique features, existing data, and knowledge gaps. Before being administered to the organizations, the questionnaire can be reviewed by the partnered working group and refined based on their feedback. Study staff should make intentional efforts to consider the language and education level of respondents and adjust the questionnaire appropriately. The New Orleans MCH study staff created a questionnaire that inquired about the functional and content areas developed in Step 2. The questionnaire also included other questions, including the type of organization (public/government, not-for-profit, for-profit), the number of employees, and the population(s) the organization serves. Before administering to participating organizations, the questionnaire was reviewed by the working group. A pilot test was then conducted with a small sample. The questionnaire was then refined and finalized using feedback from this process.
Step 4: Questionnaire AdministrationThe next step in the AMSA method requires contacting organizations and disseminating the data collection tools. This can be done with multiple approaches, including administering the questionnaire via email, phone, or physical mail. Multiple attempts should be made and different individuals at the organization may need to be contacted.
For the MCH study, all listed organizations with a publicly available email address were sent an invitation via REDCap to participate in the study by completing the questionnaire [30]. When possible, email addresses of administrative staff within the organization were found and used for questionnaire distribution. If the first contacted individual did not respond, additional employees were emailed. When organizations were not responsive, phone calls were made. For organizations that did not have a website with staff email addresses or a phone number, study staff attempted to contact the organization via social media (e.g., sending a message to the organization’s official Facebook page using the same standardized script). Contact was made with no more than three persons per organization with no more than five attempts total.
Step 5: result tabulation and data analysisThe final step in this method is analyzing the data and sharing the results. To do so, the total asset mapping points for each content and functional area and their intersections should be calculated and summarized. Then, the results can be reported and conclusions can be drawn as indicated by the project goals, research questions, topic, and community’s interests and values. The results can then be shared with participating organizations, community members, and the working group. This process can be repeated at pre-defined intervals (e.g., annually, every 5 years, etc.) to monitor changes in the system over time.
For the New Orleans MCH study, questionnaire data were tabulated into a matrix with the 4 functional areas as the columns and the 22 content areas as rows, resulting in 88 total cells. Questionnaire respondents were asked to indicate all the content and functional areas that their organization works in (non-mutually exclusive), resulting in a binary yes/no result. These data were used to calculate an Asset Mapping Score for each functional and content area. Indicating “Yes” to any given cell contributed 1 point to that functional area and that content area. For example, if a respondent answered “Yes” to breastfeeding research, that contributed 1 point to the breastfeeding content area and 1 point to the research functional area. The total score for each functional area was the sum of all asset mapping points from all content areas across all organizations. Similarly, the total score for each content area was the sum of all asset mapping points from all functional areas across all organizations. Therefore, each of the four functional areas had a total asset mapping score, and each of the 22 content areas had a total asset mapping score.
留言 (0)