
記住我
Colon and rectal cancers were responsible for 147,950 new cases in the United States in 2020—this is the second highest number of any tumors after lung cancer (1). These tumor types are frequently designated as colorectal cancer (CRC) because in many cases, rectal cancer is classified as colon cancer. Because CRC has led to more than 50,000 deaths, there is a considerable effort to better understand and to uncover new therapy biomarkers useful in the treatment of this malignant disease.
Transcriptome-wide analysis offers the possibility to simultaneously investigate the expression of all genes. When combined with clinical data, this enables not only to identify genes significantly correlated with CRC pathogenesis and progression but also to compare and rank all significant genes as well. First large-scale transcriptomic studies investigating CRC and normal colon tissues were published almost 20 years ago (2). Studies using gene arrays identified new genes and previously unknown pathways linked to CRC pathogenesis (3). Other studies were executed to discriminate CRC from adenoma and inflammation (4). More than 20 additional studies have been published comparing normal colon tissues and CRCs, but with a major weakness: The sample numbers in these were very low, generally between 10 and 50. Only few studies have sample numbers close to 100 (5–7), and no study was published with more than 150 cases.
Multiple colon cancer molecular subtypes have been established claiming the capacity to discriminate clinically relevant cohorts of CRC—we have previously reviewed these and compared their efficiency in predicting the duration of progression-free survival after surgery (8). In recent years, the centroid-based consensus molecular subtype (9) became the most widely used classification of these. The consensus subtypes divide patients into 4 cohorts termed CMS1 (microsatellite instability [MSI]-immune), CMS2 (canonical), CMS3 (metabolic), and CMS4 (mesenchymal). When linking to patient outcome, CMS1 had the worst survival, CMS3 and CMS4 were intermediate, and CMS2 was the best. Of note, the CMS classification was one of the few retaining a significant correlation with survival even after correction for other available features such as MSI status, sex, MKI67 expression, and CDX2 expression (8). The presence of the molecular subtypes provides the possibility to allot patients into clinically relevant treatment cohorts.
A major recent development in the treatment of CRC was the approval of immune checkpoint inhibitors. Currently, 2 PD-1 inhibitors (pembrolizumab and nivolumab) and a CTLA-4 inhibitor (ipilimumab) can be used to boost the immune system by disabling the capabilities of cancer cells to escape immune destruction. Generally, patients eligible for immune checkpoint inhibition include people who suffer a relapse after treatment, whose cancer cannot be removed with surgery, and cases where metastases have been confirmed. Biomarkers designated to select patients eligible for checkpoint inhibitor treatment include MSI (MSI-high) (10) and changes in one of the mismatch repair (MMR) genes (11). The success of immune checkpoint inhibition in CRC is highlighted by the results of a recent phase 3 trial where the length of progression-free survival had more than doubled in pembrolizumab-treated patients suffering from metastatic CRC compared with chemotherapy-treated patients (12). However, despite these achievements, more than one-third of patients with MSI-high tumors fail to show any benefit of pembrolizumab treatment (13). Thus, the need for new features capable to fine-tune the selection of patients most likely to benefit from immune checkpoint inhibition remains significant.
In this study, our first goal was to establish a sizeable integrated database using normal and CRC samples from multiple independent data sets. Second, by using this cohort, we evaluated gene expression alterations linked to CRC pathogenesis and identified the genes with the highest discriminatory power. Finally, by using this data set, we aimed to evaluate the correlation between cellular composition and immune cell content in different colon cancer molecular subtypes and in normal colon tissue. Our analysis uncovers features enabling advanced treatment selection and the development of novel therapies in CRC.
METHODS Data collectionWe collected data from 2 public repositories, the Gene Expression Omnibus (https://www.ncbi.nlm.nih.gov/geo/) and The Cancer Genome Atlas (TCGA, https://portal.gdc.cancer.gov/). In the Gene Expression Omnibus, we filtered all available platforms by sample number and selected the most abundant platforms as those having the highest sample number available. By this filtering, we selected the high-throughput sequencing platform GPL16791 (Illumina HiSeq 2500) and the most abundant microarray platform GPL570 (Affymetrix Human Genome U133 Plus 2.0 Array).
Then, we performed a search using the keywords “platform id (accession) + colorectal cancer + normal + tumor” and narrowed the results by selecting “Entry type: Series.” After this, each series was checked whether it actually comprised CRC samples. The results were further filtered to include those where either raw data or series matrix tables were available and whether the sample type was adequate for our analysis (e.g., samples from biopsies, laser microdissection or surgical resection, either or both normal and tumor included, cell lines excluded).
In the TCGA repository, we searched for samples with a primary site in the colon or rectum or having a sample type as solid tissue normal. From the file repository, we downloaded the htseq.counts files for each sample.
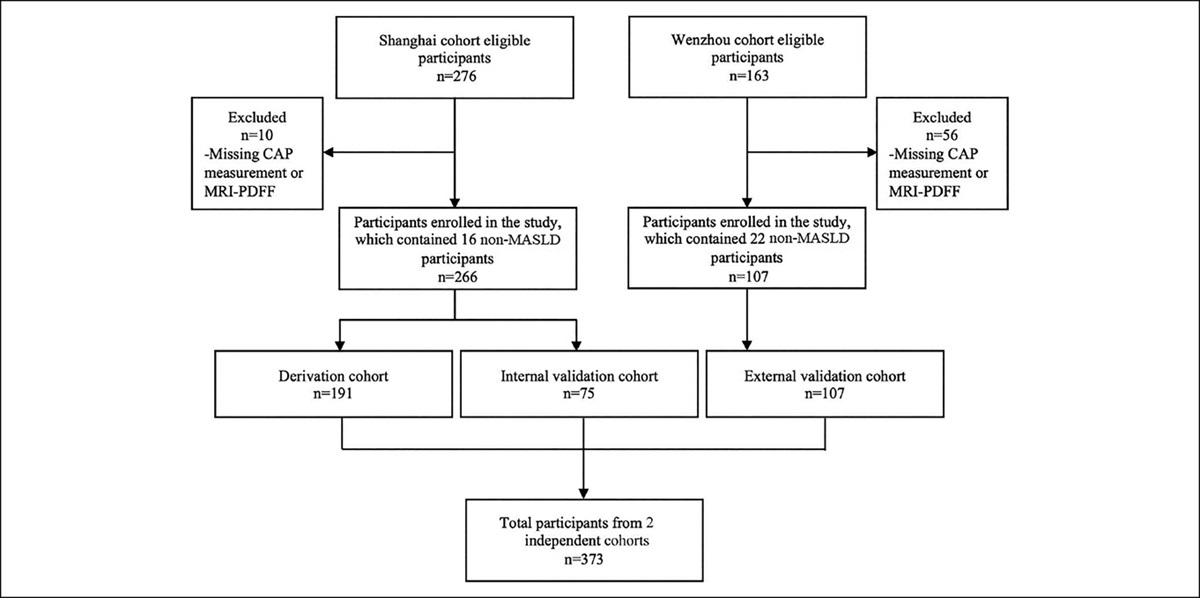
PreprocessingA flowchart of the preprocessing used to generate a combined table containing all samples is depicted in Figure 1. All GPL570 series matrices were joined into 1 table, and we filtered the probe sets in the combined series matrix table to include only the JetSet best probe for each gene (14).
 Figure 1.:
 Overview of the data acquisition (a) and processing of the transcriptomic data (b). GEO, Gene Expression Omnibus; TCGA, The Cancer Genome Atlas.
When using fragments per kilobase of transcript per million mapped fragments and reads per kilobase of transcript per million reads mapped files from the GPL16791 platform, we performed an inner join by gene symbols after selecting the columns containing relevant data. The expression in the htseq.counts files from the TCGA cases were first mapped by gene symbols by the Ensembl IDs found in those files.
Normalization of the sequencing data was executed by using the count numbers normalized to gene length and then, an inner join by symbol in all the htseq.counts files to generate a combined table. These led us to having 3 tables, 1 for GPL570 data, 1 for GPL16791 data, and 1 for the relevant TCGA cases. Our last step to acquire the combined table containing all the samples was to join these 3 tables into 1. For this operation, we used the gene symbols. Rows where more than half of the samples had an NA value were removed. This resulted in a table containing all samples (columns) with genes (rows). Using this combined table, a final quantile normalization of all the samples was performed. The entire normalized table for all samples is presented in Supplementary Table 1 (https://drive.google.com/drive/folders/1XOZa2ESlkoStdb_TBEyMljIQHT9dcdt2?usp=sharing). Clinical annotations were added manually based on available sample information.
Statistical analysesThe cellular decomposition of the samples was determined using xCell (15). To classify samples into the CMS subtypes (9), we used the publicly available R package CMScaller (16). CMScaller works by using gene expression values from a set of subtype-specific markers. If the classifier cannot confidently assign a sample to a subtype, in other words, its false discovery rate-adjusted P value for prediction is higher than 0.05, then the result will not be assigned (NA). We did not use these unclassified samples in our cellular decomposition analysis.
The normalized table containing the expression levels, sample names, and classification (either normal or tumor) was used to perform the nonparametric Mann-Whitney U test. In this, we compared the normalized expression levels of the normal samples to the normalized expression levels of tumor samples. The mean fold changes (FCs) for each gene were also calculated. We identified genes with significantly increased differential expression with a cutoff value of FC ≥ 2.
We generated receiver-operating characteristic (ROC) curves and calculated the area under the curve (AUC) values for genes with the highest FC differences. An ROC analysis is useful for the visualization of classification performance when the effect of a continuous variable on a dichotomous outcome is assessed. The AUC value of an ROC plot can range between 0.5 (no correlation between the variables) and 1 (perfect separation with high sensitivity and specificity). The significance cutoff was set at α = 0.05 for interpreting the results of all statistical tests, and Bonferroni correction for multiple hypotheses was performed as needed.
RESULTS Database setupWhen using the GPL570 platform, of the 56 series identified by the search, we uncovered 26 as those related to CRC, and 16 of these were eligible for further analysis. These series provided data from 492 tumor and 227 normal samples.
On the GPL16791 platform, of the 40 search hits, 8 series were related to CRC and 2 met our criteria. These 2 data sets had 97 tumor and 89 normal samples.
In the TCGA database, we found 114 patients, of which 112 patients had available htseq.counts files in the repository, providing us 177 samples (127 tumor and 50 normal). Figure 1 shows the data collection process, and Table 1 lists the data sets and the corresponding sample numbers.
Table 1. - Data sets included in the analysis Accession no. Source CRC sample no. Normal sample no. Reference GSE110225 Biopsy samples 17 17 (36) GSE23194 Surgical resection specimen 5 12 NA GSE37364 Biopsy samples 27 38 (37) GSE41328 Biopsy samples 10 10 (38) GSE30292 Surgical resection specimen 3 3 (39) GSE33114 Surgical resection specimen 90 6 (6) GSE21510 Surgical resection specimen 123 25 (7) GSE18462 Surgical resection specimen 2 2 NA GSE23878 Surgical resection specimen 35 24 (40) GSE22242 Surgical resection specimen 3 1 (41) GSE20916 Biopsy samples 46 44 (42) GSE15960 Biopsy samples 6 6 (43) GSE18105 Surgical resection specimen 94 17 (5), p. 12 GSE13471 Surgical resection specimen 4 4 (44) GSE4183 Biopsy samples 15 8 (45) GSE4107 Surgical resection specimen 12 10 (46) GSE163974 Surgical resection specimen 6 4 NA GSE146889 Surgical resection specimen 91 85 NA TCGA Surgical resection specimen 127 50 (47) Sum 716 366 The data sets were identified as described in Figure 1.CRC, colorectal cancer; NA, not assigned.
When combining all available samples, we established a normalized gene expression data set comprising 106 adenomas, 366 normal colon mucosa samples, and 716 samples from colorectal tumors. After excluding those genes which had missing values in more than half of the samples, the combined merged data set contains the normalized expression level of 12,098 genes. The adenoma samples were not included in the statistical analyses. Supplemental Table 1 includes the normalized expression values for all genes in all samples.
When comparing normal and tumor samples, we identified 624 differentially increased genes with FC >2. Supplemental Table 2 (see Supplementary Digital Content 2, https://links.lww.com/CTG/A878) lists all the significant genes with FC and P values of the Wilcoxon test and the mean expression in both the tumor and normal samples.
Of the 624 genes with expression higher in tumors, ROC plots showing the discriminatory potential and mean plots showing the differential expression for the 9 genes with the highest FC are depicted in Figure 2. In these, the AUC values were over 0.8 for FOXQ1 (FC = 22.99, P < 1e-30), CXCL5 (FC = 20.34, P < 1e-30), TACSTD2 (FC = 16.21, P < 1e-30), SLC35D3 (FC = 14.97, P < 1e-30), MMP1 (FC = 12.31, P < 1e-30), and MMP3 (FC = 11.54, P < 1e-30), showing an exceptional discriminatory potential for these genes. Two of the remaining top genes were between 0.7 and 0.8 (PPBP, FC = 28.289, P < 1e-30, and IGF2BP3, FC = 10.31, P < 1e-30), and 1 was below 0.7 (CALB1, FC = 13.28, P = 8.71e-9).
 Figure 2.:
 Mean plots and receiver-operating characteristic (ROC) plots for 7 genes with the highest discriminatory potential when comparing normal colon mucosa and colorectal cancer samples including PPBP (a), FOXQ1 (b), CXCL5 (c), TACSTD2 (d), SLC35D3 (e), CALB1 (f), MMP1 (g), MMP3 (h), and IGF2BP3 (i). Asterisks represent statistical significance (*P < 0.05, **P < 0.01, ***P < 0.001). In addition to the area under the curve (AUC) values, the ROC plots also show sensitivity = TP/(TP + FN) and specificity = TN/(TN + FP), where TP = true-positives, TN = true-negatives, FN = false-negatives, and FP = false-positives.
Annotation for molecular subtype and cellular contentThe cellular decomposition and molecular subtyping were determined using xCell and CMScaller, respectively. Tumor and normal samples were processed separately. When assigning molecular subtypes, 86 tumor samples were classified as CMS1, 217 as CMS2, 129 as CMS3, and 139 as CMS4. Of the entire set, 206 samples could not be classified (predicted subtype was NA). When determining cellular content, we used xCell's default 64-signature and calculated a score for each feature (including the different cell types, the immune score, and the microenvironment score). The determined subtypes and cellular scores are provided for each sample in Supplemental Table 3 (see Supplementary Digital Content 3, https://links.lww.com/CTG/A879).
Differential immune cell content in tumor tissuesWe performed the Mann-Whitney U test to compare each of the lymphocyte cell scores between tumor and normal samples. In tumors, we obtained significantly higher scores implying lymphocyte infiltration regarding CD4+ memory T cells (FC = 1.47, P < 4.21e-15), CD8+ naive T cells (FC = 1.55, P < 9.1e-15), CD8+ T cells (FC = 1.75, P = 0.008), Th1 cells (FC = 1.97, P < 1e-30), Th2 cells (FC = 2.23, P < 1e-30), and regulatory T cells (FC = 1.26, P = 0.01).
Contrarily, a significant decrease in cell scores suggesting depletion was found for CD4+ effector memory T cells (FC = 0.452, P = 0.009), class-switched memory B cells (FC = 0.365, P < 1e-30), memory B cells (FC = 0.24, P = 1.22e-6), plasma cells (FC = 0.52, P < 4.4e-16), B cells (FC = 0.37, P = 1.2e-9), and the derived overall ImmuneScore (FC = 0.58, P < 1e-30). Figure 3 shows the corresponding mean plots for the cellular content scores with 95% confidence intervals as error bars.
 Figure 3.:
 Differences in cellular decomposition of normal and colorectal cancer samples inferred from transcriptomic data using the ImmuneScore (a), B cells (b), CD4+ T cells (c), and B and CD8+ T cells (d). Asterisks represent statistical significance (*P < 0.05, **P < 0.01, ***P < 0.001).
Cellular content among the molecular subtypesWe used the Kruskal-Wallis H test to compare the xCell scores for lymphocytes between the CMS subtypes. In this analysis, we excluded those samples where the CMS subtype determination failed. CMS1 had an ImmuneScore of 0.12; CMS2, 3, and 4 had 0.035, 0.08, and 0.15, respectively (P < 1e-30). CMS1 and CMS4 were the most lymphocyte-infiltrated subtypes, with an increased abundance of CD8+ T cells (P = 0.01), Th1 cells (P < 1e-30), and Th2 cells (P = 2.72e-19) in CMS1 and B cells (P = 8.3e-10), CSM B cells (P = 2.29e-5), memory B cells (P = 0.001), naive B cells (P = 5e-4), and CD8+ T cells (P = 0.01) in CMS4. CMS2 and CMS3 have generally lower mean scores, with CMS2 having increased CD8+ naive T-cell scores (P = 1.14e-6) and CMS3 increased plasma cell scores (P = 7.93e-13). Figure 4 shows the corresponding mean plots with 95% confidence intervals.
 Figure 4.:
 Differences in cellular decomposition of different colorectal cancer molecular subtypes. Inferred from transcriptomic data using the ImmuneScore (a), B cells (b), CD4+ Tcm and CD8+ T cells (c), and helper T cells (d).
DISCUSSIONFirst, we established an integrated database of normal colon and CRC using transcriptomic data from 3 independent repositories. By using this data set, we identified the genes showing the highest differential expression in colon tumors. Among the strongest genes, we identified FOXQ1, TACSTD2 (TROP-2), CALB1, SLC35D3, MMP1, MMP3, and CXCL5.
FOXQ1, a member of a forkhead box transcription factor family, showed an almost 23-fold elevated expression level in tumors compared with normal samples. Overexpression of FOXQ1 increases p21 expression, which is a cyclin-dependent kinase inhibitor and plays an important role in cell cycle arrest and also has an antiapoptotic effect (17). Overexpression of FOXQ1 was described previously in CRC and was linked to enhanced tumor growth (17). The metastasis-promoting potential of FOXQ1 by regulation of the PI3K/AKT signaling was also described in CRC (18). The overexpression of TACSTD2, a calcium signal transducer, was previously reported in several epithelial tumors (19). Higher expression of TACSTD2 (TROP-2) led to proportionally increased tumor growth, which was then inhibited by the somatic knockdown of TACSTD2 (20). CALB1, a member of the same calcium-binding family as troponin C and calmodulin, may indicate a role of calcium signaling in the development of CRC. CALB1 was also one of the few genes significantly linked to overall survival in CRC (21). SLC35D3 is a member of the solute carrier transporter family with a currently unknown substrate (22). It was proposed that some members of the SLC35 family act as modulators of cellular activity, that is, activation of autophagy in dopaminergic neurons (22). MMP1 and MMP3 are both members of the matrix metalloproteinase family, proteins of which are responsible for the degradation of extracellular matrix components. Overexpression of these genes may facilitate the interaction with and remodeling of the microenvironment of cancer cells and may promote angiogenesis and the formation of metastases (23). The protein coded by CXCL5 is a chemokine having known chemotactic and activating function on neutrophil granulocytes (24). In summary, the top genes were linked to calcium signaling, matrix metalloproteinases, and transcription factors. Our study enhances previous results because here, we use a patient cohort sufficiently robust to enable the comparison and ranking of the significant genes. The complete list of all genes is provided as a supplemental material and can be used as a reference when assessing the relative difference between normal tissues and CRC in future studies.
The second goal of our study was to evaluate the immunological composition of these tumors. The xCell-based ImmuneScore (25) is a computed value taking the abundance of B cells, CD4+ T cells, CD8+ T cells, dendritic cells, eosinophils, macrophages, monocytes, mast cells, neutrophils, and natural killer cells into account. When compared with normal samples, CD4+ memory T cells, CD8+ naive T cells, Th1 cells, Th2 cells, and regulatory T cells were enriched in tumor tissues. CD4+ T cells, including Th1, Th2, regulatory, and CD4+ memory T cells, support the function of other immune cells through the secretion of cytokines. Th1 and Th2 cells are associated with the removal of intracellular and extracellular pathogens, respectively, while regulatory T cells play a key role in immunologic tolerance (26). Regulatory T cells were also associated with the progression of CRC through the suppression of antitumor immunity (27). CD8+ naive T cells respond to previously unencountered antigens and then initiate a significant proliferation (28). The in silico ImmuneScore was decreased in tumor samples compared with normal samples, suggesting an ongoing evasive action of tumor tissues. Recently, immunohistochemistry-based mucosal lymphocyte infiltration of tumor tissues was compared with distant normal tissues. In this study, tumor mucosa had an overall decreased number of CD45+ lymphocytes, with an increased number of CD4+ T cells and decreased number of CD8+ T cells, leading to an increase in the CD4+/CD8+ ratio (29). An immunohistochemistry-based quantification method called ImmuneScore, based on the CD3-staining and CD8-staining of formalin-fixed, paraffin-embedded tissue slides (30) evaluating the number of tumor-infiltrating T cells, was found to have a better prognostic value concerning overall survival, disease-free survival, and disease-specific survival than the traditional TNM classification (31).
Colorectal tumors can be classified into 4 consensus molecular subtypes (CMS1-4) based on their gene transcriptional activity (9). According to our in silico results, CMS1, which consists of microsatellite instable, hypermutated tumors, and CMS4, which is the mesenchymal subtype, were the most immunogenic. CMS1 consists of MSI-H, CpG island methylator phenotype-high, and hypermutated tumors (9). In this context, the increased number of somatic mutations may provide new epitopes, which can be recognized by the immune system as immunogenic, thus promoting lymphocyte infiltration. Our analysis is consistent with previous works presenting cytotoxic CD8+ T-cell infiltration of MSI-H CRC and the overall CD3+ (common T-cell marker) intraepithelial infiltration in MSI+ tumors (32).
The currently available immune checkpoint inhibitors target inhibitory receptors of T cells freeing them from the negative regulation mechanisms of CTLA-4 and PD-1, both of which can be expressed on tumor cells inhibiting T-cell-mediated cancer cell death. A study published in 2016 following 53 patients with checkpoint inhibitor treatment, 28 patients in the dMMR group (deficient mismatch repair, also can be categorized into CMS1) and 25 patients in the pMMR group (proficient mismatch repair), concluded that the response rates and disease control rates were 50% and 89% in the dMMR group and 0% and 14% in the pMMR group, respectively (33). The increased level of Th1 cells in MSI-H (CMS1) tumors may provide an explanation to why these tumors respond well to checkpoint inhibitor therapy (34). Owing to the high scores for CD4+ lymphocytes and the overall immunogenic properties of CMS1, this subtype may be a candidate for more effective immune therapies in the future. We have also checked the expression of PD-L1 (CD274) and found significant overexpression in tumor samples compared with normal samples (FC = 1.29, P = 1.6e-6). Unfortunately, we could not investigate PD-1 (PDCD1) because more than half of the samples had a missing value for this gene, and these genes were filtered before normalization.
A limitation of our study is the use of solely mRNA-level data while the link between mRNA expression and protein presence is not always guaranteed (35). Unfortunately, there are no suitable data sets with proteome-wide levels of protein abundance. At the same time, the simplicity in determining protein expression by immunohistochemistry ensures the highest clinical utility for protein-based biomarkers. A future extension of this study with proteomic data can cover this gap.
In summary, here we provide a comprehensive evaluation of CRC using multiple large-scale transcriptomic data sets. We identified the genes showing the highest differential expression in colon tumors. The top genes were linked to calcium signaling, matrix metalloproteinases, and transcription factors. Furthermore, we show that the CMS1 and CMS4 molecular subtypes were the most immunogenic, with the highest ImmuneScores but also exhibited high infiltration by CD8+ T cells, Th1 cells, and Th2 cells in CMS1 and B-cell subtypes and CD8+ T cells in CMS4. Our results help to link immunotherapy and molecular subtypes.
CONFLICTS OF INTERESTGuarantor of the article: Balázs Győrffy, MD, PhD, DSc, MAE.
Specific author contributions: B.G.: study design, supervision of data acquisition, statistics and data interpretation, supporting part writing, and finalization of the manuscript. W.J.K.: data acquisition, statistics, and leading part in writing.
Financial support: The research was financed by the 2018-2.1.17-TET-KR-00001, 2020-1.1.6-JÖVŐ-2021-00013, and 2018-1.3.1-VKE-2018-00032 grants and by the Higher Education Institutional Excellence Programme (2020-4.1.1.-TKP2020) of the Ministry for Innovation and Technology in Hungary, within the framework of the Bionic thematic programme of the Semmelweis University. This study was prepared with the professional support of the doctoral student scholarship program of the Cooperative Doctoral Program of the Ministry for Innovation and Technology financed from the National Research, Development and Innovation Fund.
Potential competing interests: None to report.
ACKNOWLEDGMENTWe acknowledge the support of ELIXIR Hungary (www.elixir-hungary.org).
REFERENCES 1. Siegel RL, Miller KD, Jemal A. Cancer statistics, 2020. CA Cancer J Clin 2020;70(1):7–30. 2. Zou TT, Selaru FM, Xu Y, et al. Application of cDNA microarrays to generate a molecular taxonomy capable of distinguishing between colon cancer and normal colon. Oncogene 2002;21(31):4855–62. 3. Bianchini M, Levy E, Zucchini C, et al. Comparative study of gene expression by cDNA microarray in human colorectal cancer tissues and normal mucosa. Int J Oncol 2006;29(1):83–94. 4. Galamb O, Györffy B, Sipos F, et al. Inflammation, adenoma and cancer: Objective classification of colon biopsy specimens with gene expression signature. Dis Markers 2008;25(1):1–16. 5. Matsuyama T, Ishikawa T, Mogushi K, et al. MUC12 mRNA expression is an independent marker of prognosis in stage II and stage III colorectal cancer. Int J Cancer 2010;127(10):2292–9. 6. de Sousa E Melo F, Colak S, Buikhuisen J, et al. Methylation of cancer-stem-cell-associated Wnt target genes predicts poor prognosis in colorectal cancer patients. Cell Stem Cell 2011;9(5):476–85. 7. Tsukamoto S, Ishikawa T, Iida S, et al. Clinical significance of osteoprotegerin expression in human colorectal cancer. Clin Cancer Res 2011;17(8):2444–50. 8. Sztupinszki Z, Győrffy B. Colon cancer subtypes: Concordance, effect on survival and selection of the most representative preclinical models. Sci Rep 2016;6:37169. 9. Guinney J, Dienstmann R, Wang X, et al. The consensus molecular subtypes of colorectal cancer. Nat Med 2015;21(11):1350–6. 10. Marcus L, Lemery SJ, Keegan P, et al. FDA approval summary: Pembrolizumab for the treatment of microsatellite instability-high solid tumors. Clin Cancer Res 2019;25(13):3753–8. 11. Overman MJ, Ernstoff MS, Morse MA. Where we stand with immunotherapy in colorectal cancer: Deficient mismatch repair, proficient mismatch repair, and toxicity management. Am Soc Clin Oncol Educ Book 2018;38:239–47. 12. André T, Shiu KK, Kim TW, et al. Pembrolizumab in microsatellite-instability-high advanced colorectal cancer. N Engl J Med 2020;383(23):2207–18. 13. Roth MT, Das S. Pembrolizumab in unresectable or metastatic MSI-high colorectal cancer: Safety and efficacy. Expert Rev Anticancer Ther 2021;21(2):229–38. 14. Li Q, Birkbak NJ, Gyorffy B, et al. Jetset: Selecting the optimal microarray probe set to represent a gene. BMC Bioinformatics 2011;12:474. 15. Aran D, Hu Z, Butte AJ. xCell: Digitally portraying the tissue cellular heterogeneity landscape. Genome Biol 2017;18(1):220. 16. Eide PW, Bruun J, Lothe RA, et al. CMScaller: An R package for consensus molecular subtyping of colorectal cancer pre-clinical models. Sci Rep 2017;7(1):16618. 17. Kaneda H, Arao T, Tanaka K, et al. FOXQ1 is overexpressed in colorectal cancer and enhances tumorigenicity and tumor growth. Cancer Res 2010;70(5):2053–63. 18. Liu JY, Wu XY, Wu GN, et al. FOXQ1 promotes cancer metastasis by PI3K/AKT signaling regulation in colorectal carcinoma. Am J Transl Res 2017;9(5):2207–18. 19. Wang F, Liu X, Yang P, et al. Loss of TACSTD2 contributed to squamous cell carcinoma progression through attenuating TAp63-dependent apoptosis. Cell Death Dis 2014;5(3):e1133. 20. Trerotola M, Cantanelli P, Guerra E, et al. Upregulation of Trop-2 quantitatively stimulates human cancer growth. Oncogene 2013;32(2):222–33. 21. Wang Y, Wang Y, Xu C, et al. Identification of novel tumor-microenvironment-regulating factor that facilitates tumor immune infiltration in colon cancer. Mol Ther Nucleic Acids 2020;22:236–50. 22. Hadley B, Litfin T, Day CJ, et al. Nucleotide sugar transporter SLC35 family structure and function. Comput Struct Biotechnol J 2019;17:1123–34. 23. Said AH, Raufman JP, Xie G. The role of matrix metalloproteinases in colorectal cancer. Cancers (Basel) 2014;6(1):366–75. 24. Walz A, Burgener R, Car B, et al. Structure and neutrophil-activating properties of a novel inflammatory peptide (ENA-78) with homology to interleukin 8. J Exp Med 1991;174(6):1355–62. 25. Gu X, Boldrup L, Coates PJ, et al. High immune cytolytic activity in tumor-free tongue tissue confers better prognosis in patients with squamous cell carcinoma of the oral tongue. J Pathol Clin Res 2019;5(4):240–7. 26. Luckheeram RV, Zhou R, Verma AD, et al. CD4⁺ T cells: Differentiation and functions. Clin Dev Immunol 2012;2012:925135. 27. Betts G, Jones E, Junaid S, et al. Suppression of tumour-specific CD4⁺ T cells by regulatory T cells is associated with progression of human colorectal cancer. Gut 2012;61(8):1163–71. 28. Gerlach C, Rohr JC, Perié L, et al. Heterogeneous differentiation patterns of individual CD8+ T cells. Science 2013;340(6132):635–9. 29. Strasser K, Birnleitner H, Beer A, et al. Immunological differences between colorectal cancer and normal mucosa uncover a prognostically relevant immune cell profile. Oncoimmunology 2018;8(2):e1537693. 30. Angell HK, Bruni D, Barrett JC, et al. The immunoscore: Colon cancer and beyond. Clin Cancer Res 2020;26(2):332–9. 31. Mlecnik B, Tosolini M, Kirilovsky A, et al. Histopathologic-based prognostic factors of colorectal cancers are associated with the state of the local immune reaction. J Clin Oncol 2011;29(6):610–8. 32. Dolcetti R, Viel A, Doglioni C, et al. High prevalence of activated intraepithelial cytotoxic T lymphocytes and increased neoplastic cell apoptosis in colorectal carcinomas with microsatellite instability. Am J Pathol 1999;154(6):1805–13. 33. Le DT, Uram JN, Wang H, et al. PD-1 blockade in tumors with mismatch-repair deficiency. N Engl J Med 2015;372(26):2509–20. 34. Zhang L, Yu X, Zheng L, et al. Lineage tracking reveals dynamic relationships of T cells in colorectal cancer. Nature 2018;564(7735):268–72. 35. Vannay A, Fekete A, Adori C, et al. Divergence of renal vascular endothelial growth factor mRNA expression and protein level in post-ischaemic rat kidneys. Exp Physiol 2004;89(4):435–44. 36. Vlachavas EI, Pilalis E, Papadodima O, et al. Radiogenomic analysis of F-18-fluorodeoxyglucose positron emission tomography and gene expression data elucidates the epidemiological complexity of colorectal cancer landscape. Comput Struct Biotechnol J 2019;17:177–85. 37. Valcz G, Patai AV, Kalmár A, et al. Myofibroblast-derived SFRP1 as potential inhibitor of colorectal carcinoma field effect. PLoS One 2014;9(11):e106143. 38. Lin G, He X, Ji H, et al. Reproducibility Probability Score—Incorporating measurement variability across laboratories for gene selection. Nat Biotechnol 2006;24(12):1476–7. 39. Christensen J, El-Gebali S, Natoli M, et al. Defining new criteria for selection of cell-based intestinal models using publicly available databases. BMC Genomics 2012;13:274. 40. Uddin S, Ahmed M, Hussain A, et al. Genome-wide expression analysis of Middle Eastern colorectal cancer reveals FOXM1 as a novel target for cancer therapy. Am J Pathol 2011;178(2):537–47. 41. Tang H, Guo Q, Zhang C, et al. Identification of an intermediate signature that marks the initial phases of the colorectal adenoma-carcinoma transition. Int J Mol Med 2010;26(5):631–41. 42. Skrzypczak M, Goryca K, Rubel T, et al. Modeling oncogenic signaling in colon tumors by multidirectional analyses of microarray data directed for maximization of analytical reliability [published correction appears in PLoS One 2010;5(12). doi:10.1371/annotation/8c585739-a354-4fc9-a7d0-d5ae26fa06ca. Ostrowsk, Jerzy [corrected to Ostrowski, Jerzy]]. PLoS One 2010;5(10):e13091. 43. Galamb O, Spisák S, Sipos F, et al. Reversal of gene expression changes in the colorectal normal-adenoma pathway by NS398 selective COX2 inhibitor. Br J Cancer 2010;102(4):765–73. 44. Irizarry RA, Ladd-Acosta C, Wen B, et al. The human colon cancer methylome shows similar hypo- and hypermethylation at conserved tissue-specific CpG island shores. Nat Genet 2009;41(2):178–86. 45. Gyorffy B, Molnar B, Lage H, et al. Evaluation of microarray preprocessing algorithms based on concordance with RT-PCR in clinical samples. PLoS One 2009;4(5):e5645. 46. Hong Y, Ho KS, Eu KW, et al. A susceptibility gene set for early onset colorectal cancer that integrates diverse signaling pathways: Implication for tumorigenesis. Clin Cancer Res 2007;13(4):1107–14. 47. Cancer Genome Atlas Network. Comprehensive molecular characterization of human colon and rectal cancer. Nature 2012;487(7407):330–7.
留言 (0)