
記住我
Inflammatory bowel diseases (IBDs), comprising Crohn's disease (CD) and ulcerative colitis (UC), develop from a combination of genetic susceptibility and environmental factors that elicit a deleterious inflammatory response (1). The gut microbiota regulates mucosal immunity through a number of homeostatic pathways, and any disturbance to this dynamic equilibrium may result in disease (2,3). Gastrointestinal (GI) microbial dysbiosis and the subsequent immune response represents the critical relationship between environment and genetics that results in the cellular and phenotypic range of IBD (2–9). Cross-sectional studies have revealed unique gut microbiome signatures and immune cell populations for IBD subtypes, including UC, colonic CD, and ileal CD (5,10–14).
GI infection is a common cause of gut microbial dysbiosis, and several studies have demonstrated a link between enteric infection and IBD (6,15–17). Highly sensitive and specific stool molecular multiplex polymerase chain reaction (PCR)-based assays offer a rapid and accurate means of clinically diagnosing enteric infection (18–21). Using this technology, we have implicated enteric infection in nearly 30% of IBD flares, with the most common pathogens comprising Clostridioides difficile, Escherichia coli, and norovirus (16,17,21–24). We have also confirmed significant differences in the distribution of pathogens between symptomatic patients with CD or UC and without IBD (16).
Despite these observations and diagnostic advances, the relationship between enteric pathogens, the gut microbiome, and mechanisms that result in inflammation remains poorly understood. In addition, as broad stool molecular multiplex PCR testing does not differentiate colonization from infection, questions remain about the optimal interpretation of a positive result. Moreover, the similar presentations of enteric infection and flare of IBD present a significant clinical challenge. As such, the impact of enteric pathogens on the gut microbiome may help differentiate patients with an acute GI infection, flare of IBD, and concomitant flare of IBD complicated by an enteric pathogen. Moreover, the impact of enteric pathogens during and after flares remains unknown.
In this exploratory translational study, we aimed to characterize the gut microbiome during an acute enteric infection with C. difficile, E. coli subtypes, or norovirus in patients with and without IBD. We also aimed to evaluate the clinical presentation and management of patients with C. difficile, E, coli subtypes, or norovirus in patients with and without IBD.
METHODS Study populationWe performed a cross-sectional study of all inpatients and outpatients at New York University (NYU) Langone Health's Tisch Hospital, a quaternary care institution in New York City, who underwent stool testing with a FilmArray GI pathogen PCR panel (BioFire Diagnostics, Salt Lake City, UT) during an episode of acute GI symptoms from September 2018 to February 2019. GI symptoms included diarrhea, bloody diarrhea, hematochezia, abdominal pain, fever, nausea, and/or vomiting. We collected remnant stool specimens submitted to the microbiology laboratory at NYU Langone Health's Tisch Hospital after GI pathogen PCR panel clinical testing twice weekly. We stored 1 sample per patient. We also included a sample of 25 healthy controls without acute or chronic GI symptoms.
We specifically identified adult patient older than 18 years with a GI pathogen PCR panel positive for C. difficile, E. coli subtypes, or norovirus, or negative for all pathogens. We selected these pathogens because they represent approximately 90% of GI infections detected by pathogen diagnostics based on our previous data (17). Using the electronic medical record, we then identified patients with and without IBD. Separate testing for C. difficile was performed on all patients as part of their clinical care (Xpert C. difficile; Cepheid, Sunnyvale, CA), and all positives were detected by both modalities. Patients with multiple classes of pathogens identified in a single test were excluded. Patients with any chronic GI illness other than IBD (e.g., microscopic colitis, celiac disease, gut-vs-host disease, and irritable bowel syndrome) were excluded.
Enteric pathogen testingThe GI pathogen panel PCR tests for 22 analytes in stool including 13 bacteria, 5 viruses, and 4 parasites including Campylobacter (jejuni, coli, and upsaliensis), C. difficile (Toxin A/B), Plesiomonas shigelloides, Salmonella, Yersinia enterocolitica, Vibrio (parahaemolyticus, vulnificus, and cholerae), E. coli subtypes (including enteroaggregative E. coli, enteropathogenic E. coli, enterotoxigenic E. coli, Shiga-like toxin-producing E. coli, E. coli O 157, and Shigella/enteroinvasive E. coli), Cryptosporidium species, Cyclospora cayetanensis, Entamoeba histolytica, Giardia lamblia, adenovirus F40/41, astrovirus, norovirus GI/GII, rotavirus A, and sapovirus (I, II, IV, and V). The GI pathogen panel PCR is capable of the simultaneous detection and identification of nucleic acids from multiple bacteria, viruses, and parasites directly from stool samples in Cary-Blair transport media. The multiplex PCR process takes approximately 1 hour. The clinical sensitivity and specificity is 94.5%–100% for all targets (18,25).
Clinical variablesFor clinical data, we recorded the following values from the medical record: presenting clinical symptoms, medication use, date of PCR test, PCR results, date of birth, place of PCR test (e.g., emergency department, outpatient visit, and inpatient hospitalization), sex, race, ethnicity, presence of IBD, date of IBD diagnosis, IBD subtype, IBD therapy use, inflammatory biomarkers (including C-reactive protein and erythrocyte sedimentation rate), and empiric and directed antimicrobial therapies for PCR results. Management and outcomes after testing were also recorded including hospitalization requirement, short-term and long-term management, and outcomes and utilization including IBD medications held, added, or up titrated; requirement for steroids; colectomy; other surgery; and subsequent endoscopy, radiology, hospitalization, emergency department visit, and IBD extension or complication. The severity of events was categorized from least to most severe as (1) no medical events (2), medications added or up titrated (3), hospitalization or emergency department visit, and (4) IBD-related surgery. Short-term events were classified as those occurring within 30 days, medium term within 1 year, and long term after 1 year.
Fecal microbiome analysisGenomic DNA was extracted following the recommendations of the International Human Microbiome Standards (26). For profiling microbiome composition, the hypervariable region (V4) of the bacterial and archaeal 16S rRNA gene was amplified by PCR using standardized techniques (27). For microbiome analysis, quality control was performed by using FastQC (28). We analyzed raw sequences through the Quantitative Insights Into Microbial Ecology 2 pipeline (29). Divisive Amplicon Denoising Algorithm 2-filtered reads were used for constructing amplicon sequence variants, followed by operational taxonomic unit classification using the Silva 138 99% (30). A description of the microbial community was derived from alpha (Chao1 and Shannon) and beta (weighted and unweighted UniFrac and Bray-Curtis) diversity estimates (31,32). Differential abundance analysis was performed by using linear discriminant analysis (LDA) effect size (Lefse) analysis (33).
Outcomes and statistical analysesOur primary outcome was specific microbiome signature using 16S bacterial rRNA gene sequencing associated with each pathogen and clinical scenario, including C. difficile, E. coli, norovirus, or negative for all pathogens, stratified by IBD status. To compare clinical variables among cohorts, Student t-test, Wilcoxon signed rank test, and χ2 analyses were used. For microbiome data, to calculate between-sample diversity, weighted and unweighted UniFrac metrics were applied to build phylogenetic distance matrices and used to construct hierarchical cluster trees using unweighted pair group method with arithmetic mean and principal coordinate analysis (PCoA) representations. The effects of clinical variables on the gut microbiome were analyzed by using the pseudo R square statistics values from R package multivariate distance matrix regression (34). The data visualization was performed by using R package phyloseq (35) and ggplot2 (36).
This protocol was approved by the Institutional Review Board at NYU Langone Health.
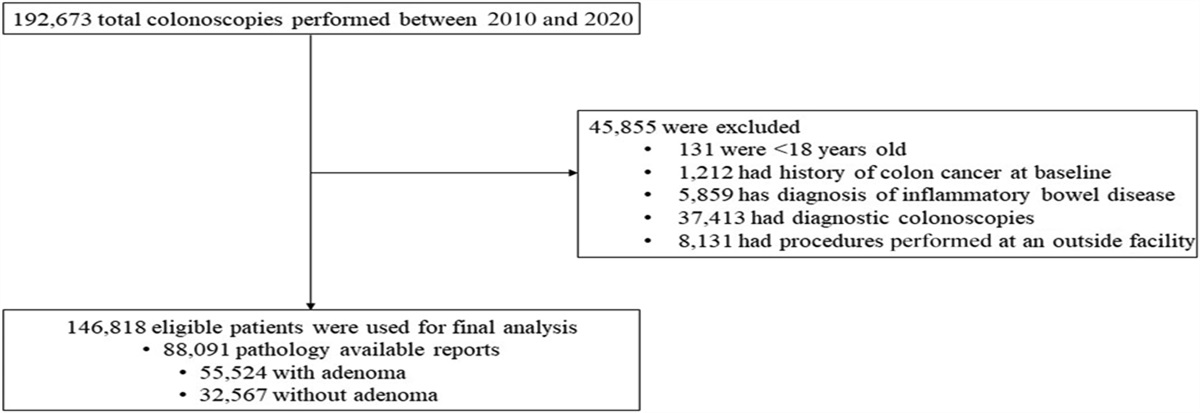
RESULTS Study population and clinical variablesWe identified 260 patients who underwent stool testing with a FilmArray GI pathogen PCR panel during an episode of acute GI symptoms from September 2018 to February 2019. Specifically, we targeted patients who tested positive for C. difficile (n = 53), E. coli subtypes (n = 55), or norovirus (n = 59), or negative for all pathogens on the panel (n = 93; Table 1). The sample of 25 healthy controls tested negative for all pathogens on the panel. Healthy controls comprised graduate student and postdoctoral laboratory members who consented to having a PCR panel performed on their stool sample.
Table 1. - Baseline characteristics of patients who underwent stool testing with a FilmArray gastrointestinal pathogen PCR panel during an episode of acute gastrointestinal symptoms from September 2018 to February 2019 Total, n = 260 Negative GI panel, n = 93 Clostridioides difficile, n = 53 Escherichia coli subtype, n = 55 Norovirus, n = 59 P value Female 138 (53.1%) 52 (55.9%) 27 (50.9%) 34 (61.8%) 25 (42.4%) 0.187 Race 0.138 White 180 (69.2%) 73 (78.5%) 31 (58.5%) 38 (69.1%) 38 (64.4%) Black 24 (9.2%) 6 (6.5%) 9 (17%) 4 (7.3%) 5 (8.5%) Asian 12 (4.6%) 1 (1.1%) 5 (9.4%) 3 (5.5%) 3 (5.1%) Other/mixed 44 (16.9%) 13 (14%) 8 (15.1%) 10 (18.2%) 13 (22%) Hispanic ethnicity 39 (15%) 14 (15.1%) 9 (17%) 6 (10.9%) 10 (16.9%) 0.786 Age at test (yr; median, IQR) 43.4 (28.4–64.4) 42.8 (29.1–60.5) 49 (28.5–70.2) 40.5 (31.3–64.7) 42.4 (29–62.1) Place of test 0.001 Emergency department 70 (26.9%) 15 (16.1%) 16 (30.2%) 11 (20%) 28 (47.5%) Inpatient 107 (41.2%) 45 (48.4%) 25 (47.2%) 15 (27.3%) 22 (37.3%) Outpatient 82 (31.5%) 33 (35.5%) 12 (22.6%) 28 (50.9%) 9 (15.3%) Other 1 (0.4%) 0 0 1 (1.8%) 0 Symptoms Diarrhea 179 (68.8%) 39 (41.9%) 40 (75.5%) 45 (81.8%) 55 (93.2%) 0.001 Bloody diarrhea 37 (14.2%) 20 (21.5%) 9 (17%) 7 (12.7%) 1 (1.7%) 0.007 Hematochezia 14 (5.4%) 6 (6.5%) 3 (5.7%) 4 (7.3%) 1 (1.7%) 0.536 Abdominal pain 143 (55%) 54 (58.1%) 28 (52.8%) 31 (56.1%) 30 (50.8%) 0.824 Fever 60 (23.1%) 18 (19.4%) 12 (22.6%) 13 (23.6%) 17 (28.8%) 0.607 Nausea/vomiting 106 (40.8%) 26 (28%) 16 (30.2%) 19 (34.5%) 45 (76.3%) 0.001 Other/unknown 26 (10%) 14 (15.1%) 6 (11.3%) 4 (7.3%) 2 (3.4%) 0.109 IBD 92 (35.4%) 54 (58.1%) 14 (26.4%) 15 (27.3%) 9 (15.3%) 0.001 Crohn's disease 41 (15.8%) 29 (31.2%) 4 (7.5%) 5 (9.1%) 3 (5.1%) Ulcerative colitis 51 (19.6%) 25 (26.9%) 10 (18.9%) 10 (18.2%) 6 (10.2%) Charlson Comorbidity Index 1 (0–3) 0 (0–1) 2 (0–5) 0 (0–3) 1 (0–4) Required hospitalization 103 (39.6%) 42 (45.2%) 24 (45.3%) 15 (27.3%) 22 (37.3%) 0.136 Length of stay (median, IQR) 5 (3–9) 6 (3–9) 6 (3–11) 6 (4–9) 3 (2–7) Antimicrobial requirement 130 (50%) 27 (29%) 53 (100%) 40 (72.7%) 22 (37.3%) 0.001 As empirical therapy 71 (54.6%) 27 (29%) 21 (39.6%) 15 (37.5%) 22 (37.3%) 0.005 Empirical therapy discontinued 20/71 (28.2%) 1/27 (3.7%) 8/21 (38.1%) 5/15 (33.3%) 6/22 (27.7%) 0.025 Directed therapy for specific pathogen 75 (72.8%) 0 35 (66%) 32 (58.2%) 0 0.001 Healthcare utilization after test Endoscopy 37 (15%) 21 (24.7%) 8 (16%) 6 (11.1%) 2 (3.5%) 0.005 Radiology 96 (38.9%) 47 (55.3%) 27 (52.9%) 11 (20.4%) 11 (19.3%) 0.001GI, gastrointestinal; IBD, inflammatory bowel disease; IQR, interquartile range.
There were no major demographic or clinical differences between patients who tested negative or positive for a pathogen (Table 1). Compared with patients with an E. coli subtype or norovirus, those with C. difficile tended to be older, have a higher median Charlson Comorbidity Index, were more frequently tested in the inpatient setting, and more likely to require hospitalization, antimicrobial therapy, and radiography after stool testing. Stratifying by IBD, we identified 92 patients (35.4% of the total population, 41 with CD and 51 with UC) who tested positive for C. difficile (n = 14, 15.2%), E. coli subtypes (n = 15, 16.3%), or norovirus (n = 9, 9.8%), or negative for all pathogens on the panel (n = 54, 58.7%; Table 2). Most patients with IBD were on an IBD therapy at the time of stool testing and had a disease duration greater than 10 years. There were no major differences in demographic or clinical differences between patients with IBD with or without a pathogen; however, patients with IBD with a pathogen tended to present with more diarrhea and nausea or vomiting and had lower biomarkers of IBD activity at stool testing (see Supplementary Table 1, https://links.lww.com/CTG/A896).
Table 2. - Baseline characteristics of patients who underwent stool testing stratified by IBD status Total IBD, n = 92 Crohn's disease, n = 41 Ulcerative colitis, n = 51 Pathogen No pathogen 54 (58.7%) 29 (70.7%) 25 (49%) Clostridioides difficile 14 (15.2%) 4 (9.8%) 10 (19.6%) Escherichia coli subtype 15 (16.3%) 5 (12.2%) 10 (19.6%) Norovirus 9 (9.8%) 3 (7.3%) 6 (11.8%) Female 46 (50%) 18 (43.9%) 28 (54.9%) Age at test (yr; median, IQR) 35.5 (27.2–53.5) 42.3 (26.4–54.9) 33.2 (28.2–46.4) Montreal classification CD A1–age <17 14 (15.2%) 14 (34.1%) — A2–age 17-40 13 (14.1%) 18 (43.9%) — A3–age >40 9 (9.8%) 9 (22%) — L1–ileal 9 (9.8%) 9 (22%) — L2–colonic 8 (8.7%) 8 (19.5%) — L3–ileocolonic 24 (26.1%) 24 (58.5%) — B1–inflammatory 14 (15.2%) 14 (34.1%) — B2–stricturing 3 (3.3%) 3 (7.3%) — B3–penetrating 24 (26.1%) 24 (58.5%) — Perianal 9 (9.8%) 9 (22%) — Montreal classification UC E1–proctitis 10 (10.9%) — 10 (19.6%) E2–left-sided colitis 12 (13%) — 12 (23.5%) E3–extensive colitis 29 (31.5%) — 29 (56.8%) Duration of IBD (yr; median, IQR) 10.1 (2.2–143) 12.4 (5.3–18.3) 3.3 (0.9–12.8) IBD therapies at test Systemic steroids 16 (17.4%) 4 (9.8%) 12 (23.5%) Topical steroids 9 (9.8%) 3 (7.3%) 6 (11.8%) 5-ASA 29 (31.5%) 10 (24.4%) 19 (37.3%) Anti-TNF 15 (16.3%) 8 (19.5%) 7 (13.7%) Anti-integrin 6 (6.5%) 1 (2.4%) 5 (9.8%) Anti-IL 12/23 6 (6.5%) 6 (14.6%) 0 JAK inhibitor 1 (1.1%) 0 1 (2%) Immunomodulator 6 (6.5%) 4 (9.8%) 2 (3.9%) None 25 (27.2%) 12 (29.3%) 13 (25.5%) Place of test Emergency department 17 (18.5%) 11 (26.8%) 6 (11.8%) Inpatient 47 (51.1%) 23 (56.1%) 24 (47.1%) Outpatient 28 (30.4%) 7 (17.1%) 21 (41.2%) Symptoms Diarrhea 38 (41.3%) 17 (41.5%) 21 (41.2%) Bloody diarrhea 28 (30.4%) 4 (9.8%) 24 (47.1%) Hematochezia 5 (5.4%) 0 5 (9.8%) Abdominal pain 54 (58.7%) 24 (58.5%) 30 (58.8%) Fever 18 (19.6%) 11 (26.8%) 7 (13.7%) Nausea/vomiting 28 (30.4%) 14 (34.1%) 14 (27.5%) Other/unknown 12 (13%) 6 (14.6%) 6 (11.8%) Inflammatory biomarkers (median, IQR) C-rp (mg/L) 15.9 (4.2–82) 34 (4.8–108) 10.1 (2.6–53.1) ESR (mm/hr) 28 (9–80) 54 (20–85) 26 (9–61)5-ASA, aminosalicylates; CD, Crohn's disease; C-rp, C-reactive protein; ESR, sedimentation rate; IBD, inflammatory bowel disease; IL, interleukin; IQR, interquartile range; JAK, Janus kinase; TNF, tumor necrosis factor; UC, ulcerative colitis.
There were no major differences in microbiome diversity by Shannon index (H) between patients with and without a pathogen (Figure 1a). However, in patients negative for all pathogens, diversity was reduced in patients with IBD compared with patients without IBD. Diversity was substantially greater in healthy controls compared with all other patient groups. These findings were further investigated by PCoA, demonstrating moderate separation of healthy controls from other IBD and pathogen cohorts (Figure 1b).
 Figure 1.:
 Microbiome diversity by (a) Shannon index between patients with and without a pathogen and (b) principal coordinates analysis (PCoA). Clostridioides difficile, Escherichia coli, inflammatory bowel disease (IBD).
There were major differences in gut microbiota community structure between patients with and without the presence of a GI pathogen. Stratifying by IBD and pathogen on a clustered heatmap normalized to healthy controls, there were several differentially abundant microbes denoting a specific gut microbial signature associated with each pathogen and by the presence of IBD (see Supplementary Figure https://links.lww.com/CTG/A906). According to LEfSe analysis, patients with C. difficile were enriched in Lachnoclostridium, Veillonella, and Escherichia; patients with E. coli subtypes were enriched in Ruminococcus gnavus and Escherichia; and patients with norovirus were enriched in Ruminococcus gnavus, Fusobacterium, and Escherichia (Figure 2a). On differential abundance analysis between patients with and without IBD, Akkermansia and Lachnoclostridium were increased in C. difficile without IBD; Dorea and Dialister were increased in E.coli with IBD; Alloprevotella and Fusobaterium were increased in norovirus with IBD; and Roseburia, Alistipes, and Bacteroides were increased in those without IBD or a pathogen (Figure 2b).
 Figure 2.:
 (a) LEfSe plots normalized to healthy controls by each pathogen and inflammatory bowel disease (IBD) status and (b) within patients with IBD by pathogen. Clostridioides difficile, Escherichia coli, inflammatory bowel disease (IBD).
On Bray-Curtis dissimilarity, patients with C. difficile, an E. coli subtype, or norovirus differed from patients negative for any pathogen (Figure 3a). Examining the contribution of various clinical covariates at the time of stool testing to Bray-Curtis dissimilarity-based PCoA analysis, the presence of IBD and a pathogen had the largest relative influence on the gut microbiome compared with other covariates, including symptoms or hospitalization requirement (Figure 3b). However, individual pathogens, specifically an E. coli subtype or norovirus, had a relatively smaller relative influence on the gut microbiome compared with the absence of a pathogen or C. difficile. Focusing on patients with IBD only, the presence of C. difficile, an E. coli subtype, or norovirus differed from patients negative for any pathogen (Figure 3c). However, in patients with IBD, examining the contribution of various clinical covariates at the time of stool testing to Bray-Curtis dissimilarity-based PCoA analysis, IBD subtypes and biomarkers of inflammation such as C-reactive protein had larger relative influences on the gut microbiome compared with the presence of an E. coli subtype or norovirus (Figure 3d).
 Figure 3.:
 (a) Bray-Curtis dissimilarity in patients with Clostridioides difficile, an Escherichia coli subtype, or norovirus, or negative for any pathogen with the (b) contribution of clinical covariates at the time of stool testing to Bray-Curtis dissimilarity-based principal coordinates analysis (PCoA). (c) Bray-Curtis dissimilarity in patients with inflammatory bowel disease (IBD) with C. difficile, an E. coli subtype, or norovirus, or negative for any pathogen with the (d) contribution of clinical covariates at the time of stool testing to Bray-Curtis dissimilarity-based PCoA analysis. C-reactive protein (CRP).
Management and outcomesFor IBD management, a greater proportion of patients with IBD but without a pathogen required hospitalization compared with those with a pathogen (59.3% vs 39.5%), largely driven by a lower hospitalization rate in those with an E. coli subtype (26.7%) or norovirus (33.3%; Table 3). Accordingly, a greater proportion of patients with IBD without a pathogen required additional or escalated IBD therapy, including corticosteroids and surgery, mainly driven by lower requirements for these management approaches in those with an E. coli subtype or norovirus. Within 30 days and 2 years after stool testing, a greater proportion of patients with IBD but without a pathogen used health care or experienced an adverse IBD outcome compared with those with a pathogen (64.8% and 66.7% vs 47.4% and 57.9%, respectively). Focusing on specific pathogens, patients with IBD and C. difficile experienced similar outcomes and utilization requirements to those without a pathogen (Figure 4a). Patients with IBD and an E. coli subtype or norovirus experienced similar outcomes and utilization requirements.
Table 3. - IBD management of flares with and without a gastrointestinal pathogen and subsequent IBD outcomes IBD and negative GI panel, n = 54 IBD and any pathogen, n = 38 P value Clostridioides difficile, n = 14 Escherichia coli subtype, n = 15 Norovirus, n = 9 Required hospitalization 32 (59.3%) 15 (39.5%) 0.062 8 (57.1%) 4 (26.7%) 3 (33.3%) Length of stay (median, IQR) 6 (4–10) 4 (2–7) 6 (3–7) 4 (3–6) 2 (2–8) Antimicrobial requirement 15 (28.3%) 27 (71.1%) 14 (100%) 11 (78.6%) 2 (22.2%) As empirical therapy 11 (73.3%) 7 (25.9%) 0.001 4 (28.6%) 1 (9.1%) 2 (100%) Empirical therapy discontinued
留言 (0)