


記住我


With the development of remote sensing technologies, a large amount of remote sensing images can be obtained from video satellites and unmanned aerial vehicles (UAVs) (Hu et al., 2019; Zhang et al., 2019; Hou et al., 2020; Lu et al., 2020; Wang et al., 2020; Pei and Lu, 2022). Recently, remote sensing image processing has attracted widespread attention, such as target detection, classification, tracking, and surveillance (Jia, 2000, 2003; Guo et al., 2017; Wang et al., 2018; Yin et al., 2020; Zhong et al., 2020; Jiang et al., 2021; Dong et al., 2022; Habibzadeh et al., 2022; Ma and Wang, 2022; Pei, 2022). Particularly, target detection is a hot topic with remote sensing images (TDRSIs), where the TDRSI has been widely applied in the fields of military, transportation, forest survey, security monitoring, disaster monitoring, and so on (Zhang et al., 2016; Han et al., 2017; Zhu et al., 2017). Therefore, TDRSI is a significant and challenging task due to the small size of the targets, high speed detection, and high accuracy requirements (Zhang et al., 2017; Dong et al., 2022).
Target detection aims to find all interested objects in the images, which has been studied with the development of computer vision technologies in recent decades. Numerous algorithms, especially convolutional neural networks (CNNs), have been widely employed for general target detection, such as SSD, YOLO, R-CNN, and Faster R-CNN (He et al., 2016; Li et al., 2019, 2021; Zhong et al., 2020; Fan et al., 2021; Tu et al., 2021; Dong et al., 2022; Mikriukov et al., 2022). For instance, Lawal (2021) have proposed a modified YOLOv3 model to detect tomatoes in complex environments. Wu et al. (2018) presented a different scaled algorithm based on the Faster R-CNN to solve small-scaled face detection. YOLOv3 network can be used for blood cell recognition (Shakarami et al., 2021) while a YOLOv4 algorithm can be used for oil well detection (Shi et al., 2021).
Considering general target detection, small target detection in remote sensing images is more difficult due to several reasons (refer to Figure 1) (Meng, 2012; Li, 2016; Du et al., 2018; Chen et al., 2021; Liu et al., 2022). First, the scales of the remote sensing images may be relatively large compared to the small target size or clustered targets in the images. Moreover, the background of the remote sensing images could be complex and fuzzy, sometimes even similar to the target features. Third, there is not enough feature information of the targets in one image, i.e., vehicles, pedestrians, and others have only few pixels for object detection in the optical remote sensing images (DIOR) (Li et al., 2020) and Visdrone2019 (Zhu et al., 2019) datasets.
Figure 1. Examples of targets in remote sensing images.
Hence, a lot of methods have been developed specifically to achieve small target detection in remote sensing images. For instance, Lu et al. (2021) have proposed a single shot detection (SSD) to detect the small target with complex background and scale variations. An improved YOLOv3 model has been designed for ship detection in remote sensing images with high accuracy and robustness (Xu, 2020). In Wang J. et al. (2020), an end-to-end feature-reflowing pyramid network has been proposed for multi-scale and multi-class object detection. Furthermore, a novel cascaded rotating-anchor-assisted detection network has been presented in Yu et al. (2022) to improve ship detection accuracy with aerial images. Moreover, Huang et al. designed a lightweight target detector to rapidly and accurately detect small targets (Huang et al., 2022). A detection algorithm based on the feature balancing and refinement network is developed to successfully detect ships (Fu et al., 2020). A squeeze-and-excitation YOLOv3 algorithm has been designed for small target detection in remote sensing images with low computation costs (Zhou et al., 2021). Moreover, Ling et al. (2022) have developed a new time-delay feedback model to detect small target motion in complex dynamic backgrounds. An indoor small target detection algorithm is described in Huang L. et al. (2022) based on multi-scale feature fusion to improve the accuracy and speed of the target detection.
Based on the above analysis, this study presents an improved LCB-YOLOv5s detection algorithm for remote sensing images. First, a new module comprising the lightweight and stable module (LSM) and cross-stage partial networks with three convolutions (C3) structure module where these modules are combined to form the feature extraction module, called as LCB module, is designed to extract numerous features of small targets. Then, the Spatial Pyramid Pooling Small (SPPS) module is developed to increase the weight of these features in the spatial dimension. Moreover, the Duble Res2Net (Dres2) module is used in the head to increase the receptive field so as to obtain more multi-scale global information and realize fine-grained feature extraction. In order to overcome the difficulty of relatively few features, the input size of the network is increased with different output feature map sizes. In summary, the contributions of the paper are summarized as follows:
1) An LCB-YOLOv5 algorithm has been developed for small target detection with remote sensing images. In the feature extraction module, the LCB module is configured based on the LSM and C3 modules to extract more features. Moreover, the SPPS and Dres2 modules are introduced to increase the weight of the features in the receptive field and so as to extract more multi-scale global information.
2) In order to improve the accuracy of the small target detection, the input size of the network is increased from 640 × 640 to 1,024 × 1,024, and the output feature map size is set as 32 × 32, 64 × 64, and 128 × 128, respectively.
3) The EIoU function is employed as the loss function to increase the training convergence velocity of the model and the regression accuracy for the target detection.
The remainder of the paper is organized as follows. Section 2 describes the proposed method in detail. Experiments of the small target detection with the selected datasets are performed and the results are analyzed in Section 3. The conclusion is provided in Section 4.
2. The proposed methodThis section presents the details of the proposed method. As shown in Figure 2, except for the first layer, the 3 × 3 convolutional layers in the backbone of the YOLOv5s detection algorithm are replaced with the LSM module. Since small targets have fewer features than those large targets in the images, the SPPS module is designed to increase the weight of these features in the spatial dimension. The Dres2 module is further introduced in the head with the strategy of multi-scale feature fusion to enhance the small target detection performance. The input size of the network is also increased with various output feature map sizes, while the EIoU loss function is designed to increase the convergence speed.
Figure 2. The architecture of the developed LCB-YOLOv5s.
2.1. Data augmentationIn general, the original training data have to be pre-processed to meet the training requirement; hence, many data enhancement strategies are employed to expand and diversify the remote sensing images so as to improve the generalization ability of the trained model and to minimize the irrelevant characteristic information in the training data. As shown in Figure 3, the mosaic operation is applied to enrich the datasets, where four original images can be randomly selected from a batch in the datasets to perform a flip, translate, change the color gamut, and stitch the images such operations. Based on the above data enhancement operations, the size of the images is relatively close to the small targets, and the number of small targets can be increased in the remote sensing images. Therefore, the small target datasets can be expanded, which can effectively improve the small target detection ability of the model. Accordingly, the demand for GPU memory can be reduced and the training speed can be also improved greatly.
Figure 3. The procedure of the mosaic data enhancement.
2.2. Feature extraction moduleIn the remote sensing images, the sizes of the targets may be small and the edges of the targets may be blurred. Hence, a LCB feature extraction module is designed to improve the target detection performance, as shown in Figure 4. Specifically, numerous features of the small targets can be extracted using the LSM module. The standard 3 × 3 convolution is used for feature extraction, and some significant features of the original feature map are preserved using maximum pooling. Then, the output feature map is enriched by concatenation. Moreover, the C3 module can perform feature extraction and fusion, where 1 × 1 convolution is applied to reduce the dimension of the original feature map, and the feature map after convolutional extraction is spliced as the output.
Figure 4. The structure of the LCB module.
It is known that the conv + batch normalization + silu (CBS) and conv + batch normalization + relu (CBR) modules are two types of standard convolution modules. As shown in Figures 5A, B, CBS and CBR utilize the convolution operation, batch normalization (BN), and activation function, where the SiLU and the ReLU are employed as the activation functions, respectively. It is noted that the CBR module with the ReLU can reduce the amount of calculation and eliminate the gradient diminishing, where the activating function with ReLu can learn faster than the sigmoid or tanh functions.
Figure 5. The schematic diagram of the standard convolution: (A) CBS module, (B) CBR module.
Figure 6 displays the proposed LSM module, mainly composed of convolution and pooling branches. First, the 1 × 1 standard convolution and 3 × 3 convolution are used to reduce the data dimension and extract features, respectively. Then, the 1 × 1 standard convolution is used once again to increase the data dimension. Furthermore, the feature map is subsampled by 2 × 2 max pooling and the number of channels is adjusted based on the 1 × 1 standard convolution. Finally, the output is obtained based on the Concat module with the above features. Compared to the traditional 3 × 3 convolution, LSM can obtain more abundant features. On the other hand, LSM can preserve some significant features of the original feature map based on the maximum pooling. On the other hand, LSM can enrich the feature map and merge it as the output.
Figure 6. LSM module configuration.
The Res unit is a standard residual module, which is depicted in Figure 7. The 1 × 1 standard convolution is used to reduce the dimension, and the 3 × 3 convolution is used to extract features. Then, the original information and feature information after convolution are added as the output. The C3 module is used for feature extraction and feature fusion, as described in Figure 8. Hence, the rich semantic information and features are obtained to convolve the upper layer feature map based on the Res unit and the 3 × 3 convolution is applied to extract features. Then, 1 × 1 convolution is applied to reduce the dimension of the original feature map, which is spliced with the convolved feature maps and used as the output.
Figure 7. Res unit module.
Figure 8. C3 module configuration.
2.3. Feature fusion moduleIn order to improve the accuracy of the small target detection, the Res2 unit module is designed (refer to Figure 9), where multigroup 3 × 3 convolutions are cascaded to enlarge the receptive field of the network and the features of each group are fused. The Dres2 module is further designed based on the C3 module (refer to Figure 10), where the original residual block is replaced with two Res2 modules. Compared to the C3 module, the Dres2 module can increase the receptive field to obtain more multi-scale global information. Therefore, the Dres2 module is applied here to realize fine-grained feature extraction.
Figure 9. The configuration of the Res2 unit module.
Figure 10. The configuration of the Dres2 module.
As depicted in Figure 11, the SPPS module is a modified version of the Spatial Pyramid Pooling (SPP) module in the network, where the three groups of maximum pooling are 1 × 1, 3 × 3, 5 × 5, and 7 × 7. Since small targets have a relatively small proportion of pixels in the remote sensing images, the effective feature information may be difficult to extract. In order to overcome the above difficulty, the SPPS module applies different sizes of the max pooling kernels, and thus, the feature information of the small targets can be retained accordingly since SPPS not only has the advantages of SPP but also can improve the detection performance for small targets.
Figure 11. The configuration of the SPPS module.
2.4. Input size of the networkThe input image size of the YOLOv5 network is 640 × 640 and the output size is 80, 40, and 20 in the prediction head. Compared to the YOLOv5 algorithm, the input size of the network and the predicted feature map are maximized to 1,024 and 256, and 128 and 64, respectively. Consequently, the input size of the network is enlarged to overcome the limitation of less small target features in the remote sensing images.
2.5. Loss functionHere, the IoU and GIoU Loss functions of the original YOLOv5 algorithm are first presented to analyze the deficiencies in small target detection. Then, the EIoU Loss is introduced (Zhang et al., 2021), where the GIoU Loss function refers to an improved intersection-over-union (IoU). The IoU is used to denote the intersection ratio of the prediction box (PB) and ground truth box (GB), which is described as follows:
IoU=PB ∩ GBPB ∪ GB, (1)Moreover, the IoU Loss function is calculated as follows:
LIoU=1-PB ∩ GBPB ∪ GB. (2)However, if there is no intersection between PB and GB, IoU Loss is nearly zero, which can hardly be used to reflect their distance. Moreover, the IoU Loss has a relatively slow convergence rate; hence, the GIoU is introduced to avoid such a problem, calculated as follows:
GIoU=IoU-Ac-UAc, (3)where Ac is the area of the smallest rectangular box including both PB and GB simultaneously and U is the union of PB and GB. Furthermore, the GIoU Loss can be expressed as follows:
LGIoU=1-GIoU=1-IoU+Ac-UAc. (4)It is noted that GIoU Loss can be optimized for situations where the PB and GB are not overlapped. Nevertheless, if these two boxes are positioned relatively close, the values of the GIoU and IoU Loss are also approximately equal. In order to solve the above problem, the EIoU Loss is used as the loss function of LCB-YOLOv5. The EIoU and the EIoU loss functions are calculated as follows:
EIoU=IOU-ρ2(b,bgt)c2-ρ2(w,wgt)cw2-ρ2(h,hgt)ch2, (5a) LEIoU=LIoU+Ldis+Lasp=1-IOU+ρ2(b,bgt)c2+ρ2(w,wgt)cw2 +ρ2(h,hgt)ch2, (5b)where cw and ch are the minimum widths and heights of the outer box covering two boxes, respectively. Compared with IoU and GIoU Loss functions, the distance between the target and anchor, the overlap rate and penalty items are considered based on the EIoU Loss function. Therefore, the regression accuracy for detection is more stable and the training convergence speed is faster.
3. Experimental results and analysis 3.1. Experimental settingsThe proposed LCB-YOLOv5s network is trained with the RTX 3090, 24G memory, and Ubuntu 20.04.4 operating system, while the proposed network and the comparison algorithms are programmed in Python 3.8 and Cuda 11.3. The hyperparametric configuration is displayed in Table 1. In total, two datasets are selected for the experiments. The first is the VisDrone2019 dataset, which was collected by the Aiskyeyee team in the Machine Learning and Data Mining Laboratory of Tianjin University. It includes 10 categories comprising more than 2.6 million annotation boxes. The targets in the VisDrone2019 dataset are pedestrians, people, bicycles, cars, vans, trucks, tricycles, awning-tricycles, buses, and motors. Moreover, the training and validation sets contain 6,471 and 548 remote sensing images, respectively. The other dataset is the DIOR remote sensing dataset, which contains 20 categories with 23,463 remote sensing images and 192,472 examples.
Table 1. Hyperparametric configuration of the experiments.
In the experiments, vehicles, ships, and airplanes are selected as the targets from 1,673 remote sensing images. Furthermore, a new dataset called the DIOR-VAS dataset is reconfigured including three types of targets: vehicles, airplanes, and ships. As shown in Table 2, the training and verification sets contain 1,334 and 339 remote sensing images, respectively.
Table 2. Details of the VisDrone2019 and DIOR datasets.
3.2. Evaluation metrics of the experimentsDuring the experiments, three common evaluation metrics are used to evaluate the effect of the proposed method, mean average precision (mAP), precision (P), and recall (R). Specifically, P and R are calculated as follows:
P=TruePositivesTruePositives + FalsePositives, (6a) R=TruePositivesTruePositives + FalseNegatives, (6b)where TruePositives denotes the targets correctly classified as positive examples, FalsePositives denotes the targets incorrectly classified as positive examples, and FalseNegatives denotes the targets incorrectly classified as negative examples.
Additionally, AP is the average classification accuracy of a category in the datasets. It is calculated as follows:
AP=∫01P(R)dt (7)where P(R) is the P–R curve to be used to calculate the AP. Based on the AP, the mAP can be obtained as follows:
mAP=∑n=0NAPnN (8)where N is the number of the detected target categories.
3.3. Experimental results and analysisTable 3 displays the comparison results of our proposed method with the other five approaches, Mets = , on the Visdrone2019 dataset. The proposed method has achieved significantly higher performance than the other methods, with P, R, and mAP as 56.2, 46.7, and 47.9, respectively. Particularly, the mAP of the proposed method is 17.4, 19.7, 22, 22.5, and 21.7 higher than those of the methods in Mets one by one. Furthermore, the P of the LCB-YOLOv5s is higher by in comparison to those of methods in Mets. Moreover, the R of the LCB-YOLOv5s is higher by than those of the methods in Mets in turn. However, the PicoDet method has a relatively weaker performance in the DIOR-VAS dataset. Furthermore, in Table 3, the LCB-YOLOv5s exhibits much better detection performance than the other five methods for bus and pedestrian detection and slightly better detection performance than the rest methods for plane and ship detection. In general, LCB-YOLOv5s can achieve higher small target detection performance with a reduced false detection rate.
Table 3. Comparison of the proposed method and other approaches based on the Visdrone2019 dataset.
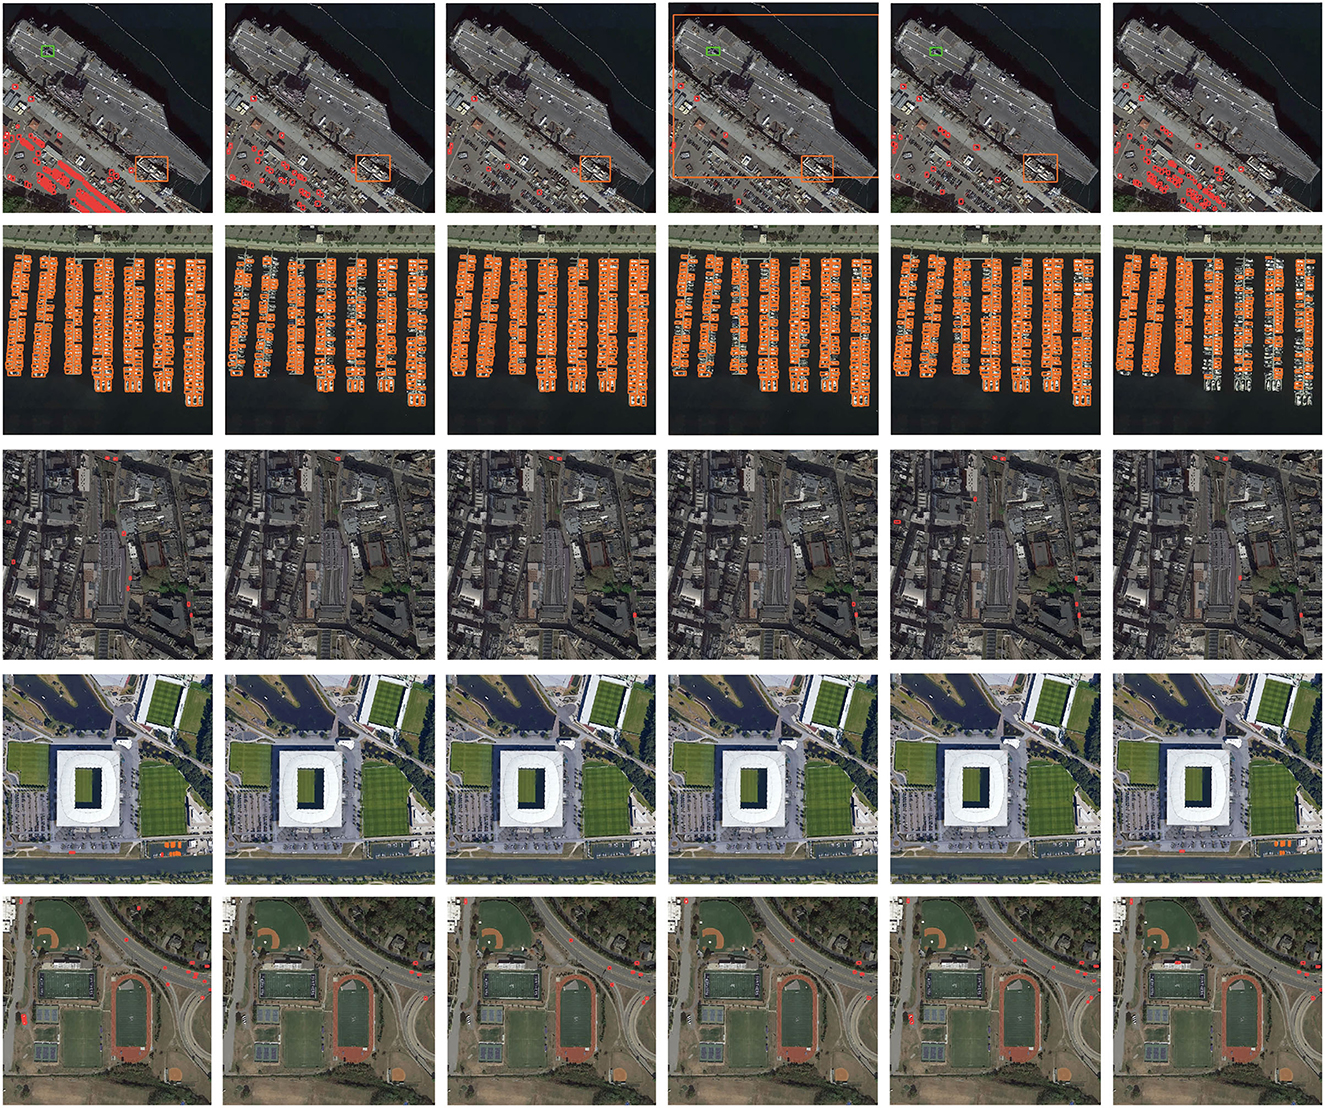
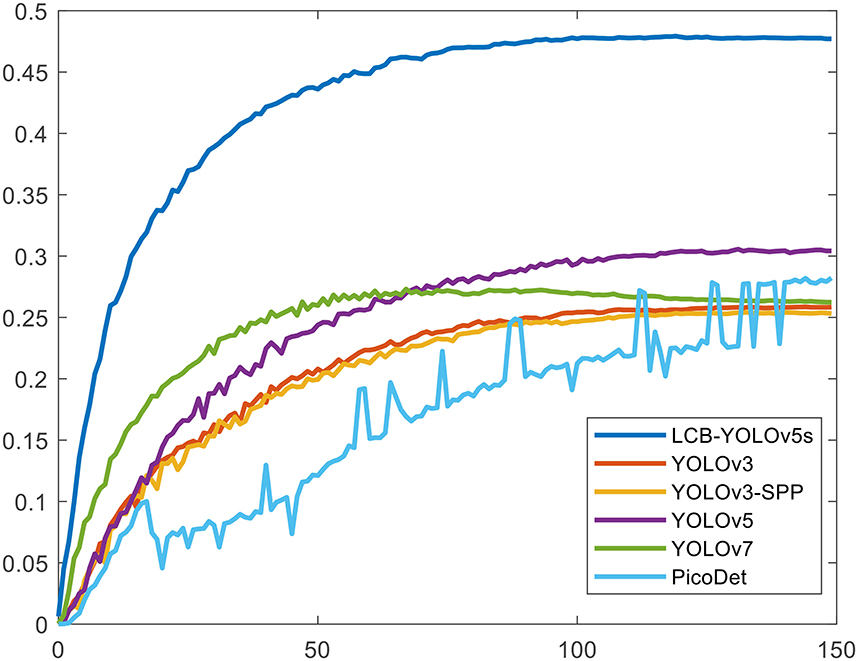
Table 4 illustrates the comparison results of the proposed method with the other five methods on the DIOR-VAS dataset, where vehicles, airplanes, and ships are selected as the small targets. The proposed method exhibits a better performance than the other methods, with mAP, P, and R of 93, 93.4, and 88.6, respectively. Particularly, the mAP, P, and R of YOLOv5s and YOLOv7 are 90.4, 93.3, and 85.8 and 90, 92.5, and 85.8, respectively. Thus, the mPA and R of the YOLOv3 and YOLOv3-SPP are lower by 4.4, 4.6, 4.4, and 4.7, respectively. The R of the YOLOv3 and YOLOv3-SPP is also relatively lower. Figure 12 displays the target detection results of the six algorithms on the Visdrone2019 dataset, where the orange, green, and red boxes indicate the detected targets of cars, buses, and pedestrians, respectively. Compared to the other five algorithms, LCB-YOLOv5s can accurately detect more targets, especially buses and pedestrians, although the prediction boxes are densely distributed in the leftmost subfigure of Figure 12. This demonstrates that the proposed LCB-YOLOv5 algorithm has an advantage over the other algorithms for small target detection. The target detection comparison of the six algorithms on the DIOR-VAS dataset is illustrated in Figure 13, where the orange, green, and red boxes are the detection results of the ships, airplanes, and vehicles. It is clear that more expected targets can be detected via LCB-YOLOv5s compared to the other methods. Additionally, Figures 14, 15 display the mAP (threshold is 0.5) of the six algorithms on the Visdrone2019 and DIOR-VAS datasets. The visual results of the original YOLOv5s and the LCB-YOLOv5s are demonstrated in Table 5. It can be intuitively seen that the proposed LCB-YOLOv5 algorithm has a better performance and higher robustness for small target detection in remote sensing images. In particular, the LCB-YOLOv5s have a stronger ability in dense small target detection.
Table 4. Comparison of the proposed method with other approaches based on the DIOR-VAS dataset.
Figure 12. Comparison of the target detection of six different models on the Visdrone2019 dataset.
Figure 13. Comparison of the target detection of six different models on the DIOR-VAS dataset.
Figure 14. The mAP (threshold is 0.5) of the proposed method in comparison with the other five detection algorithms on the Visdrone2019 dataset.
Figure 15. The mAP (the threshold is 0.5) of the proposed method in comparison with the other five detection algorithms on the DIOR-VAS dataset.
Table 5. Visual results of the small target detection on VisDrone2019 dataset.
3.4. Results of ablation experimentsAblation experiments are further performed to verify the optimization performance of each improved module. The EIoU loss function, LCB module, SPPS module, and Dres2 Module are introduced in the original network to construct the improved Model 1, improved Model 2, improved Model 3, and improved Model 4, respectively. In the improved model 5, the input size is 1,024, while all the mentioned modifications above are applied in the improved Model 6. The ablation results with the improved modules are listed in Table 6.
Table 6. Results of ablation experiments.
Compared with the original YOLOv5s network, the mAP of the model is improved by 1.3 percentage points in IM1, and the mAP of the models with IM3 and IM4 is increased by 0.9 and 0.6 percentage points, respectively. Moreover, the mAP of the model is improved by 11.8 percentage points with IM2. Meanwhile, when the input size is 1,024, the mAP of IM5 is also improved by 12.8 percentage points. Furthermore, when these six improvements are combined in IM6, the mAP is increased by 17.4 percentage points. The ablation experimental results strongly demonstrate that the proposed LCB-YOLOv5s model has a higher detection performance for small target detection with remote sensing images.
4. ConclusionIn this paper, an improved detection algorithm, called LCB-YOLOv5s, has been developed to detect small target objects in remote sensing images. The proposed algorithm comprises the LCB module via the combination of LSM and C3 modules, the SPPS module, and the Dres2 module in the feature extraction module to achieve multi-scale feature fusion. Furthermore, the input size of the network is increased and the output feature map size is set in various scales to improve the small target detection performance. Experiments have been performed on the DIOR and Visdrone2019 datasets to compare with other methods to verify the effectiveness of the proposed method for small target detection. Future work will continue to investigate small target detection and tracking under special and harsh circumstances with more general remote sensing datasets.
Data availability statementThe original contributions presented in the study are included in the article/supplementary material, further inquiries can be directed to the corresponding author.
Author contributionsConceptualization and revising: WP, ZS, and KG. Methodology, experiments, and writing the original: WP and ZS. All authors have read and agreed to the published version of the manuscript.
FundingThis work was supported in part by the NSFC (62133001 and 61520106010) and the National Basic Research Program of China (973 Program: 2012CB821200 and 2012CB821201).
Conflict of interestThe authors declare that the research was conducted in the absence of any commercial or financial relationships that could be construed as a potential conflict of interest.
Publisher's noteAll claims expressed in this article are solely those of the authors and do not necessarily represent those of their affiliated organizations, or those of the publisher, the editors and the reviewers. Any product that may be evaluated in this article, or claim that may be made by its manufacturer, is not guaranteed or endorsed by the publisher.
ReferencesChen, S.-B., Wei, Q.-S., Wang, W.-Z., Tang, J., Luo, B., Wang, Z.-Y., et al. (2021). Remote sensing scene classification via multi-branch local attention network. IEEE Trans. Image Process. 31, 99–109. doi: 10.1109/TIP.2021.3127851
PubMed Abstract | CrossRef Full Text | Google Scholar
Dong, X., Tian, J., and Tian, Q. (2022). A feature fusion airport detection method based on the whole scene multispectral remote sensing images. IEEE J. Sel. Top. Appl. Earth Observ. Remote Sens. 15, 1174–1187. doi: 10.1109/JSTARS.2021.3139926
CrossRef Full Text | Google Scholar
Du, B., Sun, Y., Cai, S., Wu, C., and Du, Q. (2018). Object tracking in satellite videos by fusing the kernel correlation filter and the three-frame-difference algorithm. IEEE Geosci. Remote Sens. Lett. 15, 168–172. doi: 10.1109/LGRS.2017.2776899
CrossRef Full Text | Google Scholar
Fan, J., Lee, J. H., Jung, I. S., and Lee, Y. K. (2021). “Improvement of object detection based on Faster R-CNN and YOLO,” in 2021 36th International Technical Conference on Circuits/Systems, Computers and Communications (Jeju), 1–4.
PubMed Abstract | Google Scholar
Fu, J., Sun, X., Wang, Z., and Fu, K. (2020). An anchor-free method based on feature balancing and refinement network for multiscale ship detection in SAR images. IEEE Trans. Geosci. Remote Sens. 59, 1331–1344. doi: 10.1109/TGRS.2020.3005151
CrossRef Full Text | Google Scholar
Guo, Y., Jia, X., and Paull, D. (2017). “A domain-transfer support vector machine for multi-temporal remote sensing imagery classification,” in 2017 IEEE International Geoscience and Remote Sensing Symposium (Fort Worth, TX: IEEE), 2215–2218.
Habibzadeh, M., Ameri, M., Sadat Haghighi, S. M., and Ziari, H. (2022). Application of artificial neural network approaches for predicting accident severity on rural roads (case study: tehran-qom and tehran-saveh rural roads). Math. Probl. Eng. 2022, 521470. doi: 10.1155/2022/5214703
CrossRef Full Text | Google Scholar
Han, X., Zhong, Y., and Zhang, L. (2017). An efficient and robust integrated geospatial object detection framework for high spatial resolution remote sensing imagery. Remote Sens. 9, 666. doi: 10.3390/rs9070666
CrossRef Full Text | Google Scholar
He, K., Zhang, X., Ren, S., and Sun, J. (2016). “Deep residual learning for image recognition,” in Proceeding of IEEE Conference on Computer Vision and Pattern Recognition (IEEE), 770–778.
PubMed Abstract | Google Scholar
Hou, B., Ren, Z., Zhao, W., Wu, Q., and Jiao, L. (2020). Object detection in high-resolution panchromatic images using deep models and spatial template matching. IEEE Trans. Geosci. Remote Sens. 58, 956–970. doi: 10.1109/TGRS.2019.2942103
CrossRef Full Text | Google Scholar
Hu, Y., Li, X., Zhou, N., Yang, L., Peng, L., Xiao, S., et al
留言 (0)