
記住我
The sample population was recruited from the student and staff population of the hosting institute and from the community. Advertisements were displayed and circulated on social media platforms. Healthy adults from age 18 to 60 years were included. Participants were excluded if they met any of the exclusion criteria, including (1) a history of a neurological disorder, such as chronic pain or seizures, metallic implants in the brain/skull, a pacemaker in the heart, or regular medications and (2) pregnancy. In total, 50 healthy right-handed adults were recruited in this study. They were randomly and equally assigned to the (A) vermis anodal group, (B) vermis cathodal group, (C) right hemisphere anodal group, (D) right hemisphere cathodal group, or (E) sham group, among which includes 5 participants were sham-stimulated on the vermis and another 5 on the right cerebellar hemisphere.
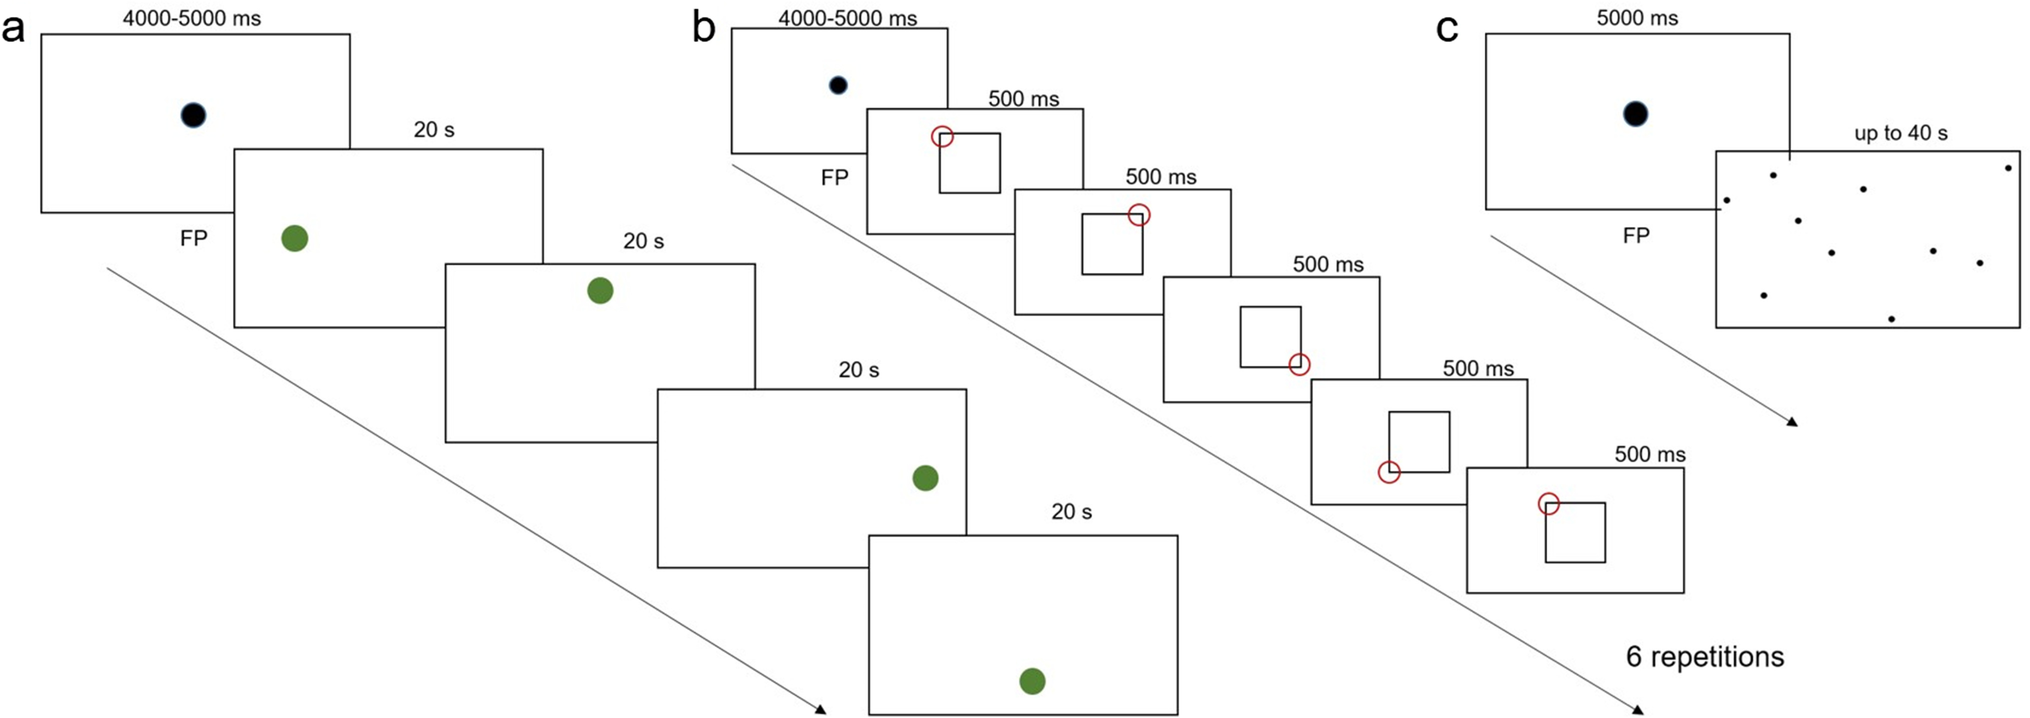
Postural Control TaskIn the present study, the internal perturbation task of bilateral rapid shoulder flexion was adopted as the postural control task. During the task, participants stood on the force plate (ProKin 252, TecnoBody, Italy) with their feet shoulder-width apart and their arms relaxed and hanging downwards. Once the visual cue was given, the participant was asked to raise both arms forward as fast as possible to approximately 90 degrees followed by arm lowering to the starting point, getting ready for the next trial. The visual cue, “a red dot on a black background,” was displayed every 5 s and lasted for 1 s.
Surface Electromyography (sEMG)The muscle activities were recorded by a 16-channel surface electromyography (sEMG) system (Myomonitor IV, Delsys, USA) to obtain the APA and CPA capacity. Since both arms were raised during the task, electromyography (EMG) activity was recorded from the anterior deltoid (AD) of both sides as the prime mover muscles and the erector spinae (ES) at the 12th thoracic level of both sides as postural muscles, according to previous APA studies [12]. The sEMG sensor attachment sites for the ES and AD were identified 10 cm below the end of the lateral clavicle and 3 cm lateral to the 12th thoracic vertebra, respectively. Prior to sensor placement, the skin surface was treated with high-chloride abrasive electrolyte gel to lower skin impedance. Impedances were kept below 5 kΩ. The acquisition frequency used was 1214 Hz, as indicated on the packaging of the main amplifier (Myomonitor IV, Delsys, USA), with a gain set to 1000 times, bandpass frequency at 20–450 Hz, 16-bit resolution, and 1.2 μV of noise.
Cerebellar Transcranial Direct Current Stimulation (c-tDCS)To target the vermis or right cerebellar hemisphere with tDCS (model EM8060, E&M Medical Tech., China), the active electrode (square-shaped conductive rubber electrodes, 4.3 cm × 6 cm, embedded in saline-soaked sponges (5 cm × 7 cm)) was placed vertically with its lower boundary 2 cm below the inion along the middle line or 3 cm lateral right to the middle line, while the reference electrode was placed over the superior aspect of the right trapezius muscle [13, 14]. The stimulation was delivered at 2 mA for 20 min. The stimulation current was gradually ramped on and off over 30 s. In the control group, five participants received sham stimulation with one electrode over the vermis and the other five on the right cerebellum with the same electrode placements as the experiment groups. The current was ramped up for 30 s, then stayed at 1 mA for 10 s, and ramped down for another 30 s.
Experimental ProceduresAll participants received 20 min of c-tDCS (2 mA) or sham stimulation on the vermis or right hemisphere according to the group assignment. Each volunteer completed 3 sessions, 10 trials each, of the bilateral rapid shoulder flexion task before, during, and immediately after c-tDCS on the force platform. Throughout the experiment, participants were asked to make upward arm movements to their shoulder level as fast as they could and to maintain posture as balanced as possible. Prior to the start of the experiment, each participant performed 3 trials as practice.
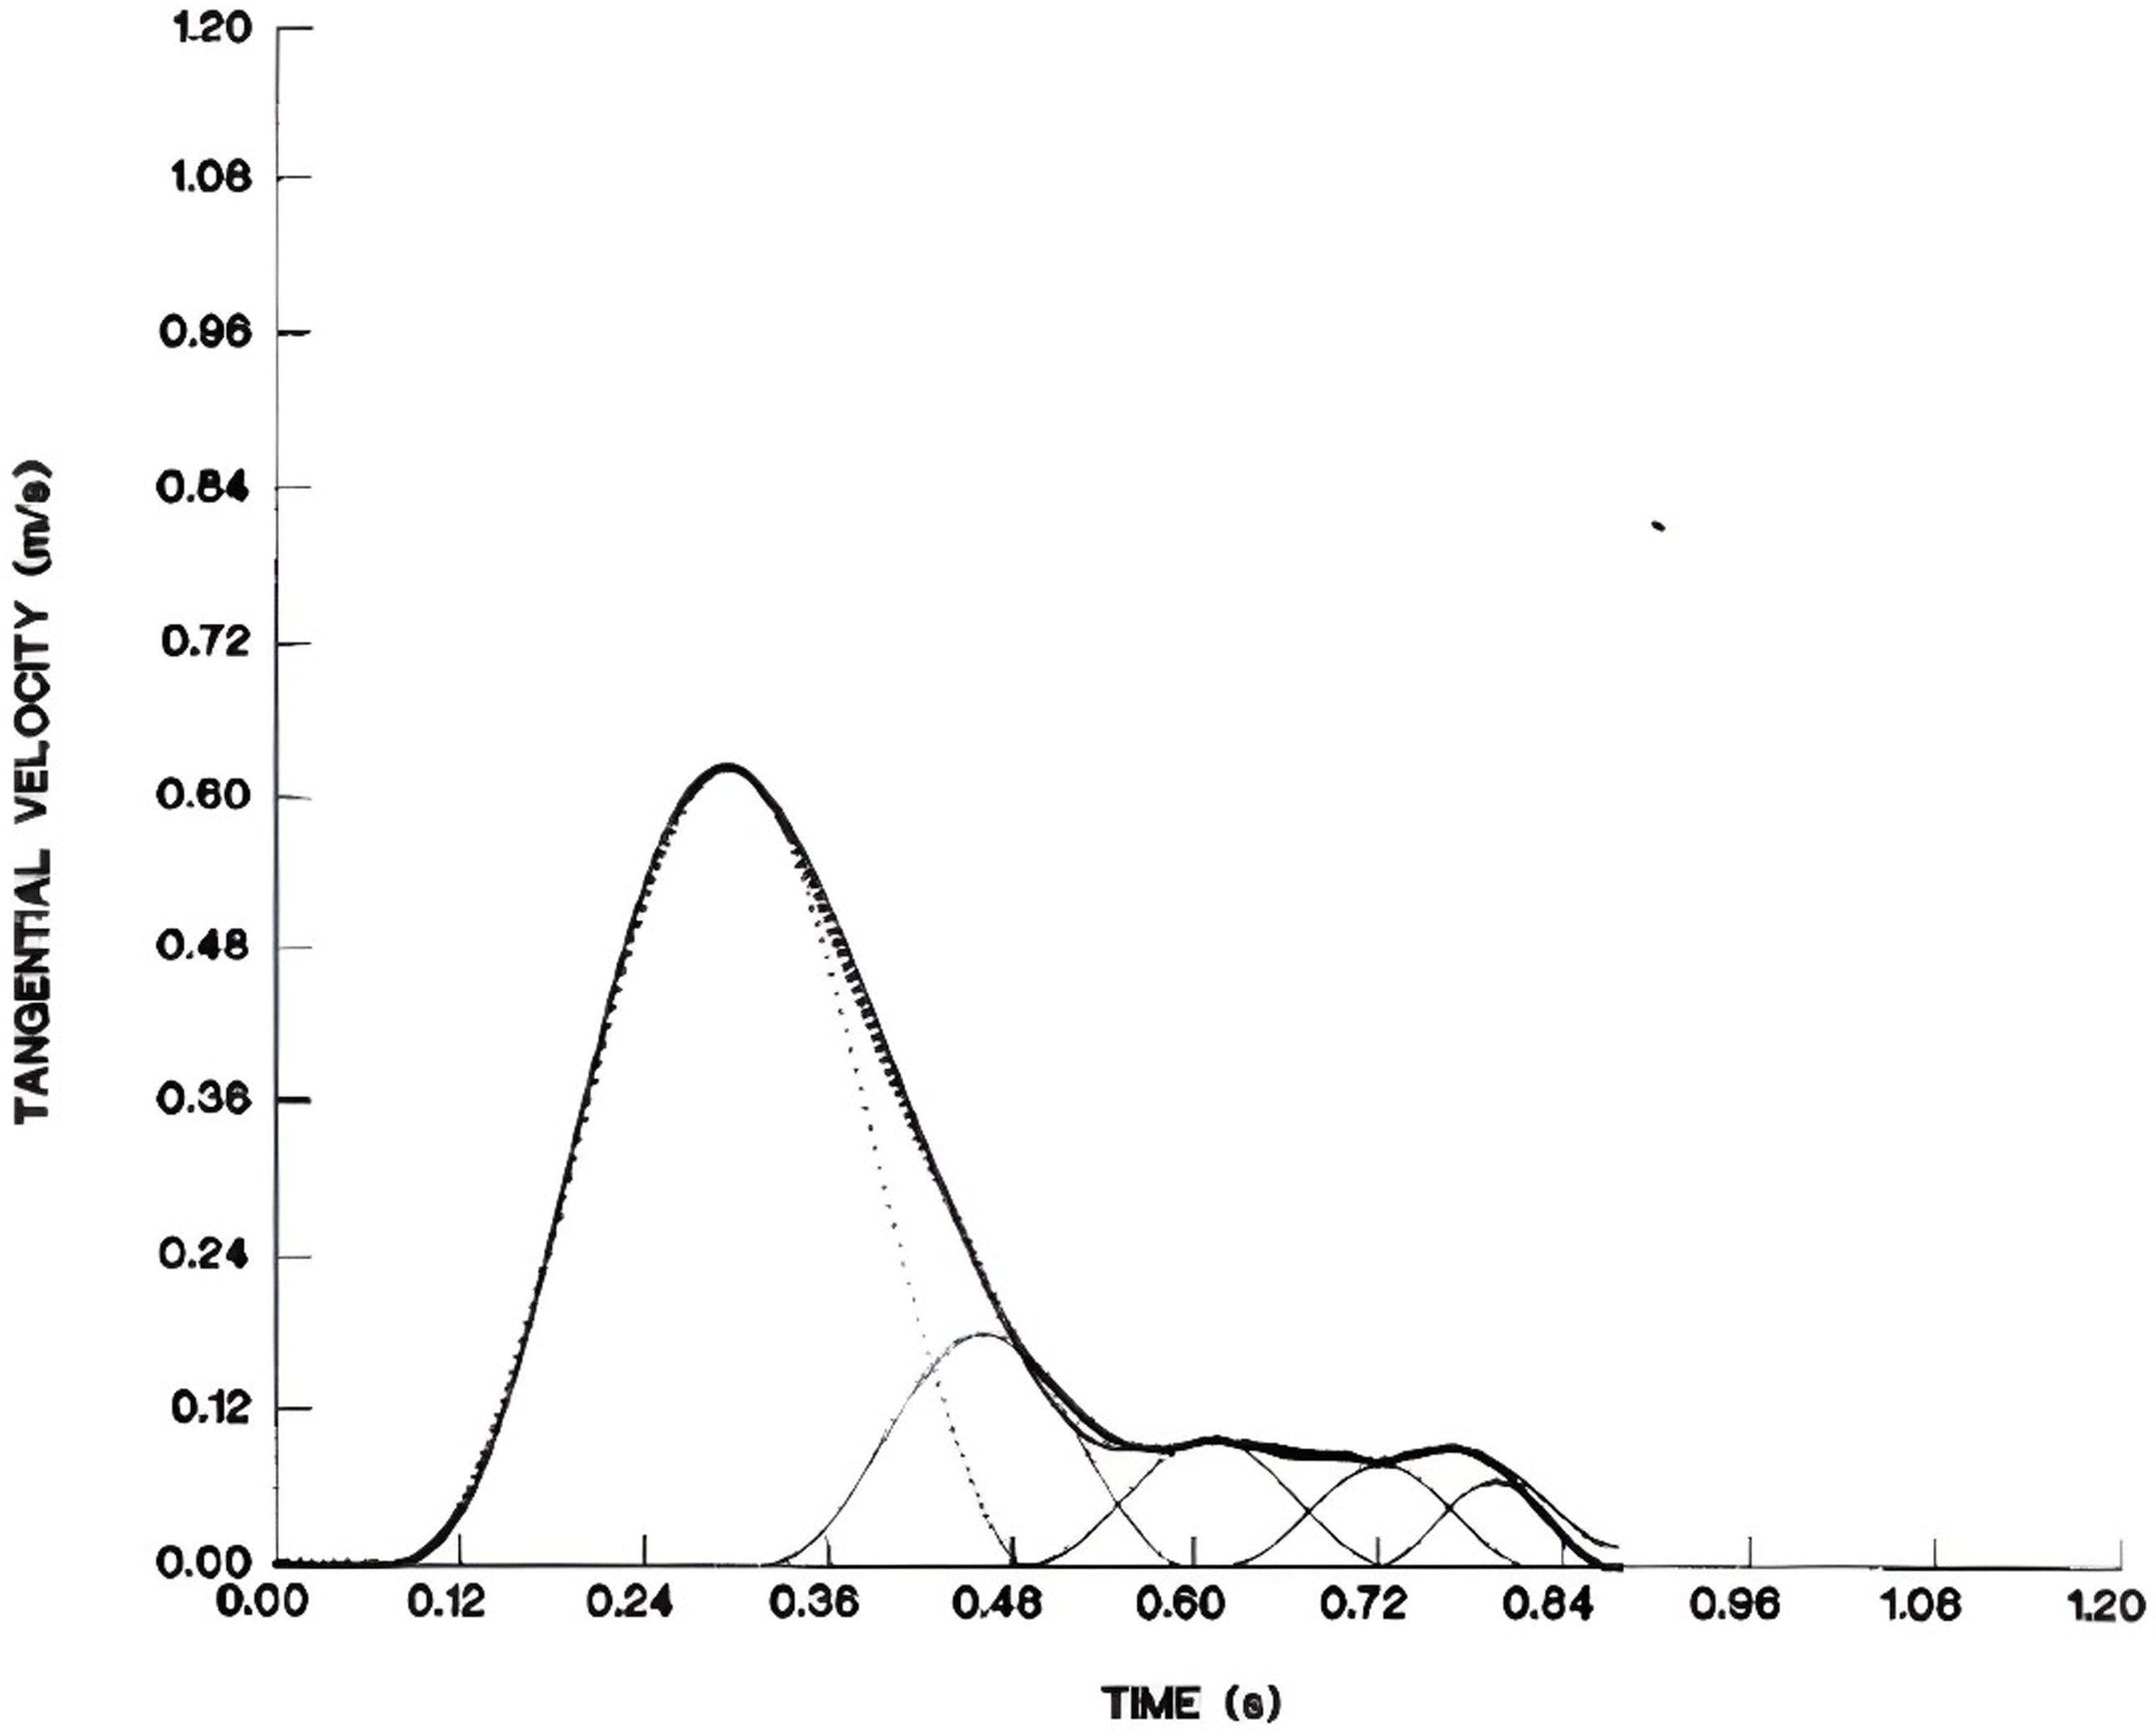
Data AnalysisThe sEMG signal was filtered with a fourth-order Butterworth bandpass filter (60–500 Hz) and subsequently rectified. Onsets of muscle activation were determined with the integrated protocol (IP) and are based on work by Santello and McDonagh and Allison [15, 16]. Given an sEMG time series S(t), the onset of muscle activation was calculated by performing a continuous integration of the rectified samples (IP(t)). A linear function R(t) was used to create a reference line going to the same final value, IP(L), which is the maximum of IP(t). Consequently, the onset time of muscle activation could be determined as the time point, t0, at which R(t) and IP(t) yield the maximal difference (Fig. 1) [17].
$$\beginIP\left(t\right)=\sum_^t\left|\mathrm S\left(\mathrm i\right)\right|,t=1,2,\dots,\mathrm L.\\\beginR\left(t\right)=\fracL,&t=1,2,\dots,L.\end\end$$
Fig. 1
Example of the IP method to detect AD and ES muscle activation onsets in one participant. a Raw sEMG traces with AD muscle activation onset marked by red vs. ES muscle activation by blue vertical lines. b The corresponding IP values. The peaks are marked by green circles, while the bottoms are marked in orange. The X-axis indicates the time in seconds
Time 0 (T0) was defined as the onset of activity of the left or right deltoid muscle, and the onset of activity of the left and right ES was expressed relative to T0. To calculate T0 in bilateral shoulder movements, we used both the left and right anterior deltoid muscles for shoulder flexion and for analysis. The mean onset time of the 10 trials for each muscle was calculated and used in the analysis. We defined the onset of activity of each muscle − 250 ms before T0 or within + 50 ms as feedforward activation [18] and after T0 + 50 ms to + 350 ms as feedback activation. Figure 1 shows typical raw sEMG data and IP values for the left AD and left ES [19, 20]. The APA and CPA values that fell outside these two ranges were excluded from the analysis.
Statistical AnalysisDescriptive statistics are reported as the mean ± standard deviation (SD). Differences in age, height, weight, and body mass index (BMI) were analyzed using one-way ANOVA in MATLAB (R2022a, The MathWorks Inc., Natick, MA, 2000). Differences in baseline levels of APAs, CPAs, swing area, and swing length were compared between groups with independent-sample Kruskal‒Wallis H tests. APA and CPA changes between sessions within groups were compared with related-sample Friedman’s two-way analysis of variance by ranks. Kruskal‒Wallis and Friedman’s tests were performed using IBM SPSS (version 20.0, IBM Corp., Armonk, NY, USA). The results were considered significant at p < 0.05.
留言 (0)