
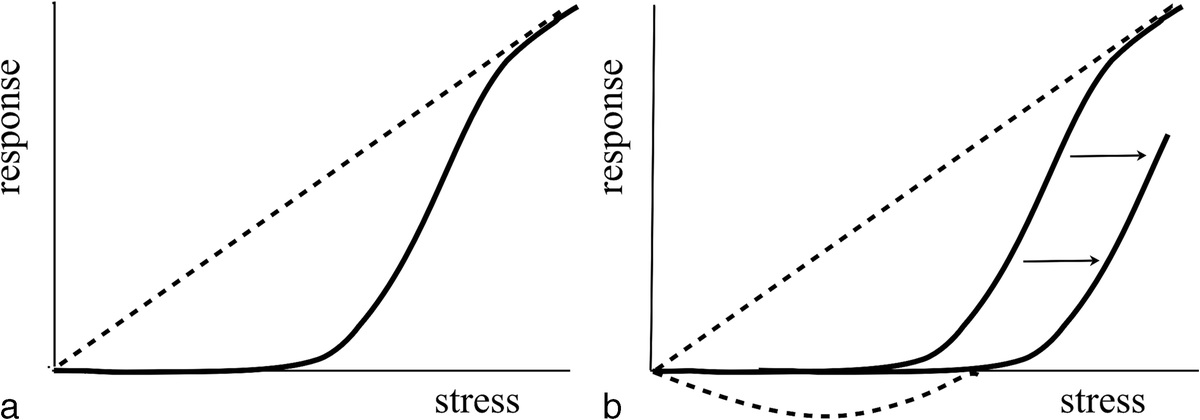
記住我

The Santa Susana Field Laboratory (SSFL or site) is located between the San Fernando Valley and Simi Valley in Ventura County in southern California (Fig. 1). Historic site operations at SSFL included rocket engine testing and energy research, including liquid metals and nuclear power. Most nuclear research and related programs ceased in 1988, and all rocket engine testing operations at SSFL ceased in 2006. Almost all buildings and structures at SSFL have been decommissioned and demolished, and the site is currently undergoing remediation of contamination caused by past industrial activities. On 8 November 2018, the Woolsey Fire started in the Woolsey Canyon area south of Simi Valley in Ventura County. It was reported to have ignited near the northern boundary of the SSFL (Citygate 2019) and burned quickly across a portion of the site pushed by the powerful Santa Ana winds. The Woolsey Fire was declared 100% contained on 21 November 2018 (DTSC 2020).
 Fig. 1: Study region around the Santa Susana Field Laboratory (SSFL) showing the Woolsey Fire burn area, suspected fire ignition points, and EPA background sample locations identified as Bridal Path, Lang Ranch, and Rocky Peak. The extent of the Woolsey Fire burn area was obtained from LA County (2019).
The purpose of this work was: (1) to determine if detectable levels of SSFL-derived radionuclides migrated from SSFL and could be detected in offsite soils because of the Woolsey Fire burning across SSFL, and (2) if so, what would be the hypothetical annual effective dose to a person exposed to both the airborne smoke plume during the fire burning at SSFL and subsequently to material deposited on the ground surface?
The progression of the Woolsey Fire across the SSFL was modeled to aid in the design of a soil-sampling plan to look for potential impacts from the fire and to confirm modeling results. Sampling locations were identified based on the modeled plume of particulate matter emitted from the fire and the areas that were predicted to be impacted by deposition of particulates from the smoke plume that originated from the fire burning at the SSFL. These locations included downwind areas where atmospheric deposition of particulates was anticipated to be largest, as well as locations that were outside the deposition plume of the fire and thus would have remained unimpacted. The analysis draws upon environmental monitoring data collected before, during, and after the Woolsey Fire.
Overview of the SSFLThe SSFL began operations in 1947 on land acquired by North American Aviation (NAA) in the Simi Hills between Simi Valley and San Fernando Valley. The SSFL site has a total area of 11.5 km2 (2,850.5 acres). The facility’s mission initially was rocket engine testing. In 1955, a portion of SSFL (1.17 km2, 289.9 acres), known as Area IV, located in the northwestern corner of the site, was set aside for nuclear research and testing by Atomics International, then a division of NAA (Fig. 2). In 1984, Atomics International merged with Rocketdyne, a division of Rockwell International, which was acquired in 1996 by The Boeing Company (Boeing). Boeing subsequently sold Rocketdyne in 2005. Today Boeing owns Areas I, III, IV, and the undeveloped land of SSFL (9.71 km2, 2,399.3 acres). Approximately 0.36 km2 (90 acres) of Area IV was leased to the US Department of Energy (US DOE) and its predecessor agencies in the past for nuclear research activities. A portion of the site (1.83 km2, 451.2 acres), Area II, is owned by the federal government and is administered by the National Aeronautics and Space Administration (NASA). Area II is used by NASA and the Department of Defense (US DOD) for rocket engine and laser testing.
 Fig. 2:
 SSFL showing administrative areas (Areas I through IV), particulate sampler locations, meteorological stations, and the 10 burn regions starting from region (1) on 8 November 2018, at 14:30 PST (rounded to the nearest half-hour) and ending with region (10). Active fire burning on SSFL ceased on the early morning of 11 November 2018, but all regions smoldered for some time after active burning.
The US DOE’s Energy Technology Engineering Center (ETEC) was in Area IV and was comprised of a group of government-owned facilities used for nuclear research and development, as well as research and testing of non-nuclear components related to liquid metals. From the mid-1950s until 1988, nuclear operations included the construction and operation of nuclear research reactors; the fabrication, disassembly, and examination of nuclear reactor fuel; and other radioactive materials research sponsored by US DOE and its predecessor agencies. Nuclear operations at the ETEC included 10 nuclear research reactors and seven critical facilities. These facilities included the Hot Laboratory, the Nuclear Materials Development Facility, the Radioactive Materials Handling Facility, and various radioactive material storage areas.
The Sodium Reactor Experiment (SRE) located in Area IV malfunctioned in July 1959 because of a partial blockage of the sodium coolant in some of the reactor coolant channels. The blockage resulted in the partial melting of 13 of the 43 reactor fuel assemblies and the release of fission products to the primary reactor cooling system and some of the inside rooms of the facility. The reactor was safely shut down, and the primary pressure vessel remained intact. All gases released from the incident were captured inside the building. Noble gases (85Kr and 135Xe) were released in a controlled manner to the atmosphere over a period of time and in compliance with airborne release limits; however, all other fission products, notably 137Cs and 131I, were retained in the sodium coolant and removed during cleanup operations. Environmental monitoring data for 1959 showed no increase in radioactivity after the incident in air, soil, or water (AI 1960). The reactor was cleaned, repaired, and continued operation until 1964 when the program ended (Boeing 2021).
Most nuclear research activities in Area IV ended in 1988. Activities conducted at the ETEC have resulted in soil contamination in Area IV. The DOE is responsible for remediation of soil contamination in Area IV and the Northern Buffer Zone. At the time of the Woolsey Fire in 2018, some of the contaminated soils had been excavated and removed, and most buildings had been decommissioned and removed.
MATERIALS AND METHODSInvestigation of potential releases and impacts from the Woolsey Fire burning across the SSFL involved first understanding the fire progression timeline followed by development of an atmospheric transport model simulation of the fire. Environmental monitoring data were reviewed and used in conjunction with dispersion factors developed from the atmospheric transport modeling to estimate potential radionuclide fallout from the fire, the dose to a hypothetical individual, and the minimum detectable dose from the confirmatory soil sampling that followed.
The Woolsey FireThe Woolsey Fire was reported to have begun on 8 November 2018 at 14:24 Pacific Standard Time (PST) near a Southern California Edison substation located along the northern boundary of the SSFL (Fig. 2) (Citygate 2019). A second ignition point ~500 m west of the first ignition point was also identified. The fire quickly spread to the southwest pushed by strong Santa Ana winds reaching speeds of about 21 m s–1 (47 mph), as measured at the SSFL. The fire spread off-site during the late afternoon/evening and was reported to be burning near the community of Oak Park at 21:00 PST the evening of 8 November (Citygate 2019). The fire jumped U.S. Route 101 between Liberty Canyon Road and Palo Comado Canyon Road overpass at 05:13 PST on 9 November (Citygate 2019). During the day of 9 November, the fire spread rapidly westward (Citygate 2019) and to portions of Thousand Oaks, Bell Canyon, Westlake Village, and West Hills (Wildfire Today 2019). The Woolsey Fire burned approximately 80% of the SSFL. The Woolsey Fire was declared 100% contained on 21 November 2018 at 18:11 PST (DTSC 2020).
A timeline of the Woolsey Fire activity on the SSFL was constructed using different sources of information including meteorological data, video from webcams located at Boeing air monitoring stations, and details regarding the fire progression (Fig. 2 and Table 1). Ten distinct regions were identified by date and time of burning. Initially, the fire burned toward the southwest from the two ignition points and crossed the western boundary of the SSFL during the late afternoon/evening of 8 November. During the late evening of 8 November to the early morning of 9 November, a portion of the Woolsey Fire burned offsite through Bell Canyon, which borders the southern boundary of SSFL (Citygate 2019). Around 22:00 PST on 9 November, a portion of the fire located offsite to the south of SSFL burned toward the north back onto SSFL, and then moved back toward the west and offsite in the early morning of 10 November. Areas of burning continued during 10 November and active burning at the SSFL ceased by the morning of 11 November 2018.
Table 1 - Fire Regions on the SSFL, area burned, and date and time. Region IDa Area (m2) Area (acres) Consumption rate (acres h–1) Date and time (PST)b 1 206,502.7 51.0 34.0 11/08/2018, 14:30–16:00 2 576,969.7 142.6 35.6 11/08/2018, 16:00–20:00 3 988,611.0 244.3 244.3 11/08/2018, 20:00–21:00 4 549,912.6 135.9 135.9 11/08/2018, 2100–2200 5 730,145.4 180.4 180.4 11/08/2018 22:00–23:00 6 1,509,361.7 373.0 124.3 11/09/2018 00:00–03:00 7 1,144,709.9 282.9 40.4 11/09/2018 03:00–10:00 8 1,477,440.3 365.1 73.0 11/09/2018 10:00–15:00 9 373,000.4 92.2 11.5 11/09/2018 15:00–23:00 10 1,620,482.3 400.4 14.3 11/10/2018, 00:00 to 11/11 04:00Radionuclides potentially present in vegetation and surface soil would be released with the burning of vegetation and the suspension of soil in a similar manner that particulate matter is released from a fire (Grogan et al. 2007). Thus, development of a radionuclide source term first involved estimating particulate releases from the fire. A fraction of the particulate matter that is released to the atmosphere will deposit from the plume on the soil as it is transported downwind. Likewise, any radionuclides in particulate form entrained in the plume would also deposit on the soil as they are transported downwind.
Each region of the Woolsey Fire on SSFL was modeled using the Fire Emission Production Simulator (FEPS) Version 1.1.0 (Anderson et al. 2004) computer program. This model takes as input the beginning and ending time of the fire, the area burned, fuel loading, relative humidity, wind speed, temperature, and atmospheric stability. Fuel loading is defined from the National Fire Danger Rating System 1978 Fuel Model Definitions (Deeming et al. 1977). Fuel model B was selected for the model because it represents California’s mixed chaparral ecosystem that covers the SSFL. Dominant plant species in a mixed chaparral ecosystem include scrub oak, chaparral oak, and several species of ceanothus and manzanita (Ornduff 1974). The default fuel loads for this material are 11.5 tons per acre of shrub, 4.5 tons per acre of woody material, and 3.5 tons per acre of litter (Deeming et al. 1977).
The fuel condition was assumed to be very dry based on the meteorological conditions recorded at the Boeing and NASA meteorological towers. The FEPS default moisture percentages for very dry fuels are 4%, 6%, 8%, and 8% for the 1-h, 10-h, 100-h, and 1,000-h times, respectively. The FEPS default moisture percentage was 60% for live material and 25% litter. Wind speed, relative humidity, and temperature were obtained from the Boeing meteorological tower located in the northeast corner of the SSFL (Fig. 2). Hourly average windspeeds increased from about 2 m s−1 (4.5 mph) to over 8 m s−1 (18 mph) about an hour before the fire started. Gusts of over 20 m s−1 (45 mph) were measured during this period, and relative humidity dropped from over 96% to about 6%. Temperatures were relatively mild for Santa Ana conditions with a maximum of about 22 °C (~72 °F) recorded on 10 November 2018. Atmospheric stability was estimated for each hour based on Pasquill-Gifford classification using Turner’s method (Turner 1964). High wind speeds and clear skies resulted in neutral stability conditions for most of the time the fire burned on SSFL.
The total area of each fire region on the SSFL was divided by the number of hours the region actively burned to provide the consumption rate that was entered into FEPS (i.e., acres per hour or tons of fuel per hour). Region 3, which burned during the highest recorded wind speeds, had the highest burn rate (see Table 1). Lower burn rates corresponded to periods of relatively light wind speeds, which were recorded on the evening of the 9 November 2018 and on the morning of 10 November 2018. Separate modeling was performed for each region of the Woolsey Fire on the SSFL and assumed linear growth of the Woolsey Fire across each region. The estimated emission rate for particulate matter with diameters less than 2.5 μm (PM2.5) from all sources as a function of time (Fig. 3) shows that the highest emission rates occurred in the late afternoon and evening of 8 November 2018 and the early morning of 9 November 2018 during the period of highest wind speeds.
 Fig. 3:
 FEPS-predicted release rate of PM2.5 as a function of time from Woolsey Fire burning on the SSFL.
The FEPS model produces emission estimates as a function of time for carbon monoxide, methane, and PM2.5 (particulate matter with diameters less than 2.5 μm). For this application, only the PM2.5 was included in the atmospheric dispersion model because measurements at the Boeing air samplers included both PM2.5 and PM10 (particulate matter with diameters less than 10 μm).
Atmospheric transport modelingThe purpose of the atmospheric transport modeling was to estimate the deposition pattern of particulate matter and any associated radionuclides from the Woolsey Fire while it burned on the SSFL. The transport and deposition of particulate matter was modeled using the CALPUFF (Scire et al. 2000) modeling system Version 7 (Exponent 2019). CALPUFF is an advanced non-steady-state meteorological and air quality modeling system used to compute particulate and gaseous concentrations of material emitted to the atmosphere. Version 7 includes an interface between FEPS and CALPUFF so that the output from FEPS can be processed and used directly in a CALPUFF simulation. The CALPUFF modeling system consists of three primary codes: a meteorological model (CALMET), a complex terrain Lagrangian puff dispersion model (CALPUFF), and a post-processing program (CALPOST). There are also numerous preprocessors for developing input data that include surface and upper air meteorological data, terrain and land-use data, and the source-term data provided by FEPS.
Model domain and discretizationThe model domain measured 33.1 km east-west by 27.5 km north-south covering an area of 910.26 km2 (224,928 acres) (see Fig. 1). Terrain in the SSFL region is characterized as complex and rugged. Elevations above mean sea level within the model domain ranged from 55 m to 917 m, with a median elevation of 331 m. The rugged terrain required a refined horizontal grid spacing of 100 m, resulting in 332 east-west nodes and 276 north-south nodes for a total of 91,632 nodes. The 100-m grid spacing allowed the steep terrain in the vicinity of the SSFL to be accounted for by the model.
The atmosphere was discretized into 10 vertical layers having upper bounds of 20 m, 40 m, 80 m, 160 m, 320 m, 640 m, 1,200 m, 2,000 m, 3,000 m, and 4,000 m above ground surface.
Meteorological dataMeteorological towers on the SSFL are illustrated in Fig. 2. Boeing operates the tower in the northeastern corner of the facility. NASA operates the tower near the center of the facility, and DOE operates the tower in the northwest portion of the facility. The DOE tower was inoperable during the fire and thus provided no data for the model simulation. The Boeing and NASA towers remained operational during the fire and were the primary source of on-site meteorological data. Wind speed and direction were measured at 10 m or 15 m, which is optimal for surface measurements and generally recommended by the US Environmental Protection Agency (US EPA).
Boeing also measures windspeed and direction at six particulate air monitoring stations that are identified in Fig. 2. These measurements are made at the 2-m level and supplemented data from the towers.
Meteorological data from the towers at the Burbank and Van Nuys airports were also obtained and used in the simulation. Although these stations are outside the model domain, they provided required data on cloud cover and barometric pressure. Cloud cover and barometric pressure were not likely to differ from conditions at the SSFL, especially during Santa Anna conditions. CALMET also requires upper air sounding from the nearest upper air station, which is at Vandenberg AFB. The twice daily soundings during the fire were obtained and used in the simulation.
Wind roses during the most active burning period of the fire at the two operational towers and the six Boeing air monitoring locations show winds predominantly out of the north-northeast to northeast direction; however, the Boeing main tower had winds predominately out of the east-northeast, and Boeing station 4 had winds predominantly out of the north. It is likely that terrain channeling influenced the wind direction at Boeing station 4. Wind speeds were highest at the NASA tower, which is at the highest elevation of all the stations. Wind speeds for the Boeing air monitoring stations (2-m measurement height) generally exhibited lower windspeeds than the meteorological towers as expected. The Boeing main tower and Boeing monitoring station 1 are relatively close to each another but exhibited different predominant wind directions. This observation is likely due to different measurement heights and the turbulent nature of the winds during the fire.
CALPUFF model optionsIn general, default technical options and parameters were used in the CALMET and CALPUFF simulations. Model parameters and options with no default value or where the default was not selected are discussed below.
The bias variable weights the surface and upper air readings in the wind field interpolation scheme. A bias value of −1 reduces the weight of the upper air stations by 100%, and a bias value of 1 reduces the weight of a surface station by 100%. Bias variable values range between −1 and 1 (i.e., a bias value of −0.3 weights the upper air observations by 30% and applies a weight of 70% to the surface stations). In this application, a gradational approach was used (as recommended in CALPUFF) so that at the surface layer, the surface stations are weighted by 100%; in the uppermost layer, the upper air station is weighted by 100%. Bias values for each layer from the surface to the highest layer were − 1, −0.9, −0.8, −0.7, −0.4, 0.0, 0.7, 1.0, 1.0, 1.0.
The CALMET default is to use all stations weighted by the distance squared. Because conditions can vary significantly across the SSFL, the varying radius of influence option was used in the simulation. For surface stations, all stations within 2 km of the model grid point were used in the wind field interpolation. If no stations were found within 2 km, then the nearest station was used. For upper air stations, the radius value was 100 km because only one station was used. Radius of influence for terrain features was 0.5 km. That is, terrain features within 0.5 km of a grid point were included in the simulation. Observations within 0.5 km of a grid point were given equal weighting between the observation and the first-guess wind field as prescribed in CALMET.
For kinematic effects (the change in air properties due to the advection of air parcels), a non-default option in CALMET was selected because of the strong and chaotic nature of Santa Ana winds that drove the fire.
The dispersion coefficients used in the CALPUFF simulation were determined from internally calculated micrometeorological variables that account for the physical and dynamic occurrences within a shallow stratum of air adjacent to the ground and provide a non-biased estimate of air concentrations. This represents the current state-of-the art in atmospheric dispersion modeling.
Predicted and observed PM2.5 concentrationsBoeing, NASA, and US DOE operate a total of 14 PM10 monitors on the SSFL, and at three stations (Boeing stations 1 and 4, NASA station 2) there is also a PM2.5 monitor (Fig. 2). Data before, during and after the fire were obtained electronically from NASA and Boeing, and US DOE data from North Wind (2019a and b). Particulate matter emission is a natural consequence of wildfires, and the measurements showed a clear increase in particulate matter concentrations during the Woolsey Fire. The response of the PM10 samplers is consistent with the fire progression. High particulate matter concentrations (Table 2 and Table 3) corresponded to times at which smoke and suspended materials were known to be present, demonstrating that the samplers captured the impacts of the fire.
Table 2 - Measured and predicted net 24-h average PM2.5 concentrations at the Boeing samplers (μg m−3). Date MeasuredP/O of sampler average: 0.52
a Predicted-to-observed (measured) ratio of sampler time average.
b Calculated from PM10 measurement based a PM10 to PM2.5 ratio of 2.05.
P/O of sampler average: 0.52
aPredicted-to-observed (measured) ratio of sampler time average.
bCalculated from PM10 measurement based on a PM10 to PM2.5 ratio of 2.05.
The CALPUFF simulation calculates the 24-h average PM2.5 concentration at each of the monitoring stations from PM2.5 emitted while the Woolsey Fire burned in the different areas of the SSFL. Because the CALPUFF-predicted concentration represents a net value that does not include the contribution from background, the average background PM2.5 concentration (11.7 μg m−3) was added to the predicted concentration at each location for comparison to the measured concentration. The background PM2.5 concentration was calculated from pre-fire data measured at Boeing stations 1 and 4 and NASA station 2. The pre-fire Boeing data spanned from 15 April 2018 to the start of the Woolsey Fire and the pre-fire NASA data spanned from 1 November 2018 to the start of the Woolsey Fire. For stations that only measured PM10, the PM2.5 concentration was estimated by dividing the PM10 concentration by the average PM10 to PM2.5 ratio measured during the fire (2.05).
Predicted and measured PM2.5 concentrations (Table 2, Table 3, and Table 4) show that predicted (P) concentrations are approximately within a factor of 2 of the observations (O) (i.e., overpredict or underpredict the measured concentration by a factor of 2). Atmospheric transport model predictions within a factor of 2 of the observations are generally considered acceptable model performance (Chang and Hanna 2004). Previous modeling studies of wildfires show that PM10 was predicted generally within a factor of 2 of the observations using a similar modeling approach (Grogan et al. 2007). For this study, the average observed value across all samplers was 63.8 μg m−3, the average predicted value was 37.1 μg m−3, and the P/O ratio of the averages was 0.58. However, the measured data may include not only PM2.5 generated by the Woolsey Fire burning on the SSFL but also PM2.5 generated by the Woolsey Fire burning on land outside the SSFL boundary, whereas the modeled concentrations only include PM2.5 generated by the Woolsey Fire burning on SSFL land. Consequently, some model underprediction of the measured concentrations in ambient air would be expected.
Table 4 - Measured and predicted net 24-h average PM2.5 concentrations at the US DOE Samplers (μg m−3). Date Measured cP/O of sampler average: 1.5
a Predicted-to-observed (measured) ratio of sampler time average.
b US DOE Sample 4 ceased operation on November 8 and was repaired on December 19, 2018. Because no corresponding measurements existed during the fire, no model predictions were made for DOE-4
c Calculated from PM10 measurement based on a PM10 to PM2.5 ratio of 2.05.
The distribution of individual P/O ratios had an average value of 1.4 (standard deviation 1.90) and a median value of 0.69, suggesting a lognormal distribution. The geometric mean P/O ratio was 0.80 and geometric standard deviation was 2.75.
Predicted ambient air concentrations of PM2.5 above background are illustrated in Fig. 4. The contours represent the average PM2.5 concentration from 8 November 14:00 PST to 10 November 22:00 (57 h). Plumes of PM2.5 from areas that burned on 8 November traveled southwest of SSFL and then funneled down a north-south drainage skirting the community of Oak Park. Average concentrations were typically 60 to 90 μg m−3 in this uninhabited region and were lower in the residential areas (20 to 50 μg m−3) of Oak Park and Agoura Hills. A second PM2.5 plume from the SSFL Buffer Zone and Area I that burned on 9 and 10 November traveled almost directly south down Bell Canyon at concentrations less than those at Oak Park and Agoura Hills.

留言 (0)