
記住我
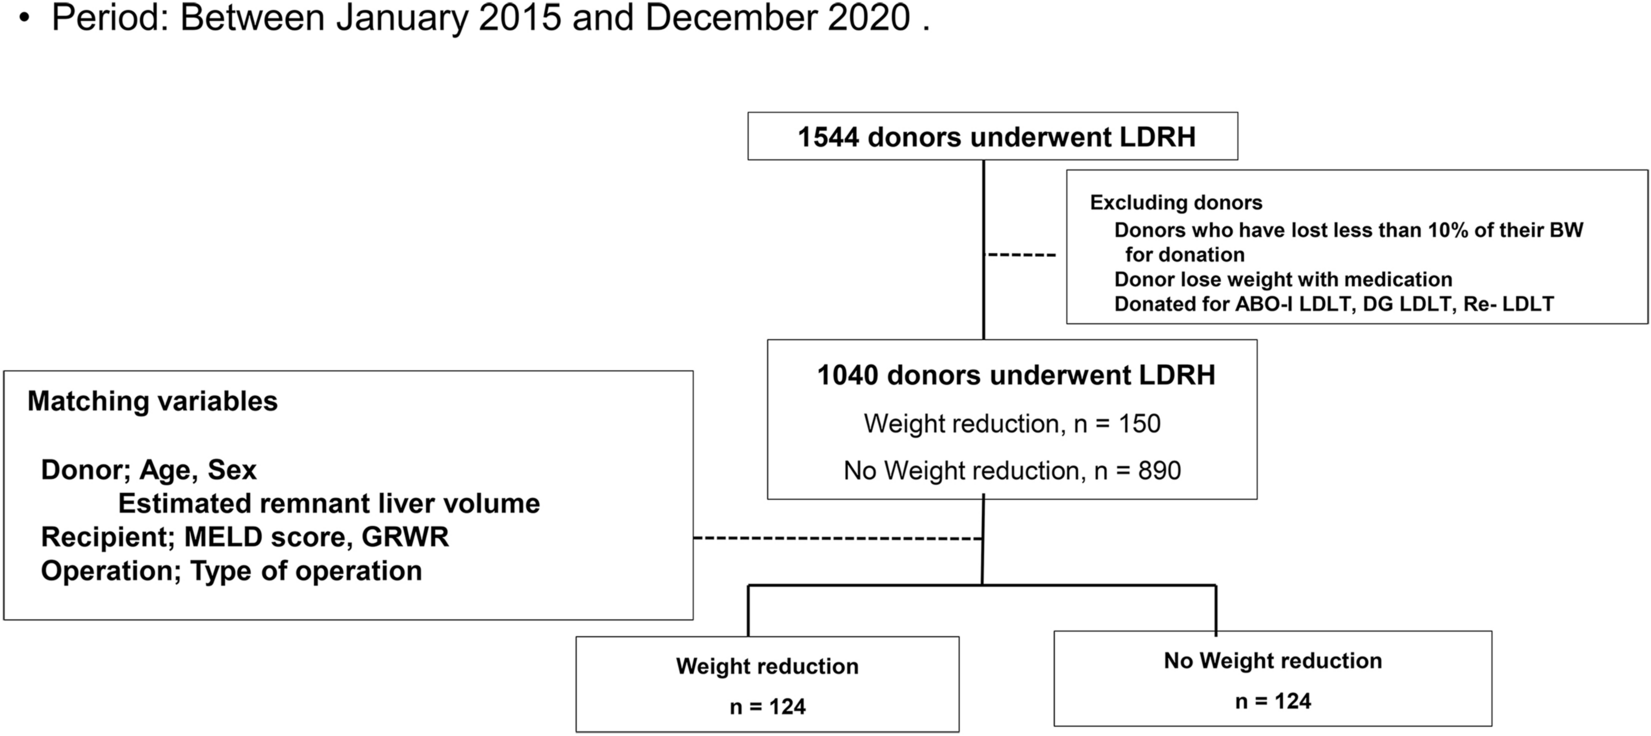
We screened 3663 consecutive patients with cirrhosis who underwent TIPS for secondary prophylaxis of variceal bleeding and were admitted to the six participating hospitals between January 2010 and June 2020; finally, 2100 patients were included in the study. All patients with non-standard PPG measurements, incomplete basic information, advanced liver cancer, and cardiopulmonary diseases affecting survival were excluded. The median follow-up period was 32.38 (19.03–56.37) months. The baseline characteristics of the patients are summarized in Table 1. Before TIPS, 714 (34.0%) patients were treated by endoscopy, including 510 (24.3%) patients with EVL and 693 (33.0%) patients with ECI. The frequency of EVL and ECI was 1.7 and 1.9 for one patient on average. There were 1413 (67.29%) patients with ascites before TIPS, and 163 (7.8%) of them were refractory ascites which was treated by large volume paracentesis and diuretic. Of all patients, 47.6% had a portal vein thrombosis with stenosis < 50%, including the main trunk (38.8%) or branch (38.8%). A total of 818 (38.95%), 1073 (51.10%), and 209 (9.95%) patients were graded as Child–Pugh A, B, and C, respectively. Stent diameters of 6, 8, and 10 mm were used in 95 (4.52%), 1904 (90.67%), and 101 (4.81%) patients, respectively. The median PPG decreased from 24 to 8.8 mmHg in the entire cohort. Difference of the portal pressure according to stent diameters was shown in Supplementary Table 18. Demographic and baseline characteristics are shown in Table 1.
Table 1 Demographic and baseline characteristicsClinical outcomesRebleeding occurred in 409 patients during the follow-up period, resulting in a cumulative incidence of rebleeding of 19.48%. In all rebleeding patients, 184 (45.0%) patients underwent shunt dysfunction. Among shunt dysfunction patients, 102 (55.4%) received stent recanalization. All other 307 (75.1%) out of these 409 rebleeding patients were treated with medication and endoscopy. OHE occurred in 704 patients during the follow-up period, with a cumulative incidence of 30.52%. Twenty-two patients had pre-TIPS HE, and all of them had OHE 1 year after TIPS. Twenty (1.0%) patients had TIPS reduction for refractory HE, and there were 298 (14.2%) patients with stent stenosis after TIPS. Overall, 640 patients died, resulting in a cumulative mortality incidence of 28.76%. During follow-up, 110 (5.2%) patients died of liver failure. Clinical outcomes differed significantly among patients with different Child–Pugh classes (Fig. 1). The results of multivariate Cox regression analysis are shown in Supplementary Table 1.
Fig. 1
Outcomes and PPG of patients in different Child–Pugh classes. The proportion of patients without a rebleeding, b OHE, and c mortality in the different Child–Pugh classes. d Pre- and post-TIPS PPG of patients in different Child–Pugh classes
The effect of PPG reduction on clinical outcomes in all patients PPG < 12 mmHg in all patientsTo validate different PPG values as the target to prevent bleeding, we divided all patients into two groups according to post-TIPS PPG < 12 mmHg or ≥ 12 mmHg. In the < 12 mmHg group, 1682 patients had a post-TIPS cumulative rebleeding incidence of 37.95%. Meanwhile, in the ≥ 12 mmHg group, 418 patients had a post-TIPS cumulative rebleeding incidence 43.29%. Significant differences between the two groups were observed for rebleeding (p = 0.022, HR = 1.314, 95% CI 1.040–1.660), but not for OHE and mortality (p = 0.066, HR = 0.833, 95% CI 0.686–1.012 and p = 0.909, HR = 0.988, 95% CI 0.806–1.212, respectively) (Fig. 2 and Supplementary Fig. 2). After 1:2 PSM, the significance of between-group differences in rebleeding was not robust (38.81 vs. 43.29%, p = 0.067, HR = 1.267, 95% CI 0.983–1.656), and no significant difference was detected in terms of OHE and mortality (p = 0.192, HR = 0.868, 95% CI 0.701–1.074 and p = 0.897, HR = 0.985, 95% CI 0.788–1.233, respectively) (Fig. 2 and Supplementary Fig. 2). Competing risk analysis (Fine-Gray test) showed similar results (Supplementary Fig. 3).
Fig. 2
Proportion of patients without rebleeding with a 12 or 14 mmHg post-TIPS PPG threshold. The proportion of patients without rebleeding a before and b after PSM with a 12 mmHg PPG threshold. The proportion of patients without rebleeding c before and d after PSM with a 14 mmHg PPG threshold
Other PPG thresholds of 8, 10, and 14 mmHg in all patientsWe also explored other PPG values (8, 10, and 14 mmHg) as potential thresholds. A post-TIPS PPG < 8 or 10 mmHg could not achieve less rebleeding without increasing the OHE (Supplementary 4–7). When stratified by 14 mmHg, a significant difference was observed between the two groups for rebleeding (39.12 vs. 51.22%, p = 0.006, HR = 1.489, 95% CI 1.120–1.979) before PSM, but not in OHE and mortality (Fig. 2 and Supplementary Fig. 8–9). Decision curve analysis (DCA) showed that using 12 mmHg as a cut-off in terms of rebleeding could achieve more net benefit than using 14 mmHg (Fig. 5).
The effect of PPG reduction on clinical outcomes in patients with different liver function categories PPG < 12 mmHg in different liver function categoriesAs shown in Fig. 1, the outcomes of different Child–Pugh class patients were significantly different. Therefore, we further analyzed the PPG thresholds in different Child–Pugh classes.
In patients graded Child–Pugh A, setting 12 mmHg as the cutoff value for post-TIPS PPG was not discriminative of rebleeding, OHE, or mortality before or after PSM (Supplementary Fig. 10). Competing risk analysis also showed consistent results (Supplementary Fig. 11).
In patients with Child–Pugh B, significant differences were observed between the PPG < 12 mmHg and PPG ≥ 12 mmHg groups for rebleeding (45.18 vs. 36.79%, p = 0.022, HR = 1.446, 95% CI 1.055–1.982), but not for OHE and mortality (p = 0.183, HR = 0.836, 95% CI 0.642–1.088 and p = 0.925, HR = 1.013, 95% CI 0.774–1.326, respectively). After 1:2 PSM, PPG < 12 mmHg group showed reduced rebleeding compared with PPG ≥ 12 mmHg group (45.33 vs. 43.32%, p = 0.028, HR = 1.479, 95% CI 1.044–2.095), but presented similar OHE incidence and mortality (p = 0.089, HR = 0.779, 95% CI: 0.584–1.039 and p = 0.146, HR = 1.247, 95% CI 0.926–1.679, respectively) (Fig. 3 and Supplementary Fig. 12). The competing risk analysis confirmed these results (Supplementary Fig. 13).
Fig. 3
Proportion of Child–Pugh class B patients without rebleeding with a 12 or 14 mmHg PPG threshold. The proportion of Child–Pugh class B patients without rebleeding a before and b after PSM with a 12 mmHg PPG threshold. The proportion of Child–Pugh class B patients without rebleeding c before and d after PSM with a 14 mmHg PPG threshold
In class C patients, no significant difference was detected in rebleeding, OHE, and mortality either before or after 1:3 PSM between the two groups (Fig. 4 and Supplementary Fig. 14). Competing risk analysis, however, showed significant differences in rebleeding before PSM (43.14 vs. 53.50%, p = 0.032, HR = 1.913, 95% CI = 1.018–3.595), even though OHE incidence and mortality were similar (p = 0.280, HR = 0.768, 95% CI 0.479–1.231 and p = 0.062, HR = 0.610, 95% CI 0.363–1.023, respectively; Supplementary Fig. 15).
Fig. 4
Proportion of Child–Pugh class C patients without rebleeding with a 12 or 14 mmHg PPG threshold. a Proportion free of rebleeding in all patients with 12 mmHg threshold before PSM. b Proportion free of rebleeding in all patients with 12 mmHg threshold after PSM. c Proportion free of rebleeding in all patients with 14 mmHg threshold before PSM. d Proportion free of rebleeding in all patients with 14 mmHg threshold after PSM
Other PPG thresholds of 8, 10, and 14 mmHg in different liver function categoriesNone of the tested PPG thresholds (8, 10, and 14 mmHg) showed significant differences in rebleeding, OHE, or mortality in patients graded as Child–Pugh class A (Supplementary Fig. 16–21).
In the Child–Pugh class B, PPG < 8 and 10 mmHg could not reduce rebleeding either before or after PSM (Supplementary Fig. 22–25). Although PPG < 14 mm Hg showed reduced rebleeding (41.33 vs 48.06%, p = 0.037, HR = 1.521, 95% CI 1.026–2.255), no improvement regarding OHE occurrence or mortality was noted (p = 0.064, HR = 0.706, 95% CI 0.489–1.020 and p = 0.239, HR = 1.225, 95% CI 0.874–1.718, respectively). After a 1:6 PSM, there were no significant differences in rebleeding, OHE, or mortality. (Fig. 3 and Supplementary Fig. 26) Similarly, competing risk analysis showed no significant difference in any outcome (Supplementary Fig. 27).
In Child–Pugh class C, no significant difference was observed in rebleeding, OHE, or mortality between groups when stratified by 8 mmHg or 10 mmHg (Supplementary Fig. 28–31). PPG < 14 mmHg could reduce rebleeding (40.92 vs 73.04%, p = 0.017, HR = 2.380, 95%CI 1.168–4.851), but failed to show statistically different OHE incidence or mortality (p = 0.216, HR = 0.674, 95% CI 0.360–1.260 and p = 0.351, HR = 0.733, 95% CI 0.381–1.409, respectively). After 1:5 PSM, the significance of between-group differences regarding rebleeding remained robust (45.17 vs. 73.23%, p = 0.046, HR = 2.082, 95% CI 1.013–4.281), and the lack of significant differences in OHE and mortality also persisted (p = 0.423, HR = 0.760, 95% CI 0.388–1.487 and p = 0.678, HR = 0.868, 95%CI 0.445–1.694, respectively) (Fig. 4 and Supplementary Fig. 32). Competing risk analysis showed similar results for these outcomes (Supplementary Fig. 33).
Therefore, as both 12 and 14 mmHg could reduce rebleeding in Child–Pugh class B and C patients, we compared their net benefits in rebleeding by DCA to determine the optimal threshold. DCA showed that 12 mmHg was marginally better than 14 mmHg in patients graded Child–Pugh class B, while 14 mmHg was superior to 12 mmHg in patients graded Child–Pugh class C (Fig. 5).
Fig.5
Decision curve analysis of rebleeding in Child–Pugh class B and C patients with 12 and 14 mmHg PPG thresholds. DCAs of rebleeding in a all patients, b Child–Pugh class B patients, and c Child–Pugh class C patients with PPG thresholds of 12 and 14 mmHg
Alternative standards (PPG reduction rate)We also dichotomized patients with PPG reductions of 30, 40, and 50%; none which were statistically discriminative of rebleeding, OHE, or mortality (Supplementary Fig. 34).
留言 (0)