
記住我


Cardiovascular diseases (CVDs) and stroke are the leading causes of mortality in India, with ischaemic heart disease as the major attributing factor. The Global Burden of Disease study has estimated the CVD death rate in India to be 272/100 000 population, as against the global average of 235/100 000. The situation is even more alarming in India as the onset of disease is at an earlier age with increased morbidity and mortality.1
The prevalence of ‘first-time’ coronary artery disease (CAD) is at nearly twice that of the prevalence of ‘recurrent’ CAD. This is inspite of vigorous preventive efforts in place for earlier risk recognition, assessment and characterization, with early risk management and interventions.2 Coronary calcium score (CCS) is an established surrogate marker of coronary atherosclerosis with significant association with medium- to long-term occurrence of major adverse cardiovascular events. It has evolved from the days of electron beam computed tomography (CT) to more precise measurements on dual-energy CT, but the Agatston and volume scores and estimation of plaque burden have remained largely unchanged. However, the major drawback is that only the stable calcified plaques are estimated and a relative risk of the disease is extrapolated. The vulnerable plaques, on the other hand, are predominantly fatty and escape detection on CCS.
Localized thoracic fat depots, especially the estimation of epicardial fat volume (EFV), is gaining importance as a new and independent risk predictor of CAD. Moreover, detection of calcification in various thoracic extracoronary (ECC) sites such as the aortic valve, mitral valve3 or thoracic aorta4 is a useful adjunct in predicting cardiovascular atherosclerosis, as the disease has a more all-encompassing presence.
Previously, we had observed that higher EFV was seen in patients having CAD compared to patients without CAD. Using an EFV cut-off value (49.75 ml) for CAD prediction, the sensitivity, specificity, positive predictive value (PPV) and negative predictive value (NPV) were 81%, 45.9%, 58.2% and 72.2%, respectively, with an overall diagnostic accuracy of 62.84%. Moreover, higher EFV was seen in patients with greater degrees of coronary arterial stenosis. On multivariate analysis, EFV was found to be an independent predictor for the presence of CAD.5 However, at present, EFV and thoracic ECC are not being used consistently for risk profiling of individuals.
We assessed the role of traditional CCS, and the less-recognized, but more promising, non-traditional factors, i.e. EFV and thoracic ECC, alone and in combination with each other to improve the detection of subclinical CAD with higher sensitivity and specificity. These were compared with the degree of coronary artery stenosis on coronary CT angiography performed concurrently for substantiating their roles.
METHODSThis cross-sectional, observational study comprised 950 Indian patients suspected to have CAD (symptomatic patients with intermediate pre-test probability of CAD or uninterpretable electrocardiogram or unable to exercise on stress tests). Coronary CT angiography was done for these patients during 2013–2016. Details of the analysed group and scan acquisition are referenced elsewhere.5 The study was approved by the ethical committee of the hospital and followed the guidelines mentioned in the Declaration of Helsinki.
Coronary artery calcium scoring was done as Agatston scores. Each calcified segment of coronary arteries was scored using software (semi-automatic) available at our institution. Predefined prediction of calcification was presence of minimal of three contiguous pixels with an attenuation of ≥130 Hounsfield Units.
Non-contrast scans were also analysed for the presence of calcification at four extracoronary sites, namely (i) aortic valve calcification (AVC); (ii) mitral valve calcification; (iii) thoracic aorta calcification (TAC); and (iv) aortic root calcification (ARC). Any calcified focus observed extending from the aortic valve to the aortic root was called AVC. TAC included visualized portions of the ascending and descending thoracic aorta. ARC was assessed and measured at the level of the aortic ring. Simple ordinal scoring from 0 to 4 was done for the above-mentioned sites.
The quantification of EFV was done using the abovementioned semi-automatic technique.5 Finally, coronary arteries were assessed for the presence of CAD and its degree of severity. The severity of CAD was classified as mild (<50% stenosis, non-obstructive), moderate (50%–75% stenosis) and severe (>75% stenosis). Greater than 50% stenosis was considered obstructive/significant CAD. In patients with varying degrees of stenosis in different coronary artery segments, the highest degree of stenosis was considered for classification of the severity of CAD.
Statistical analysisThe following methods were adopted: (i) statistical testing was done using the Statistical Package for Social Sciences (SPSS) software, version 17.0; (ii) continuous variables are presented as mean (standard deviation; SD) or median (interquartile range [IQR]); (iii) categorical variables are expressed as frequencies and percentages. Kruskal–Wallis test/Mann–Whitney U-test were used to compare medians as the data were non-normally distributed; (iv) a receiver operating characteristic (ROC) analysis was done; (v) the area under the curve (AUC), sensitivity, specificity, PPV, NPV and diagnostic accuracy were estimated. A value of p<0.05 was taken to indicate a significant difference.
RESULTSA total of 950 patients were enrolled in the study. The mean (SD) age was 51 (11.2) years. The men-to-women ratio was 1.9:1 with 623 men (65.6%). Figure 1 shows the prevalence of traditional risk factors.
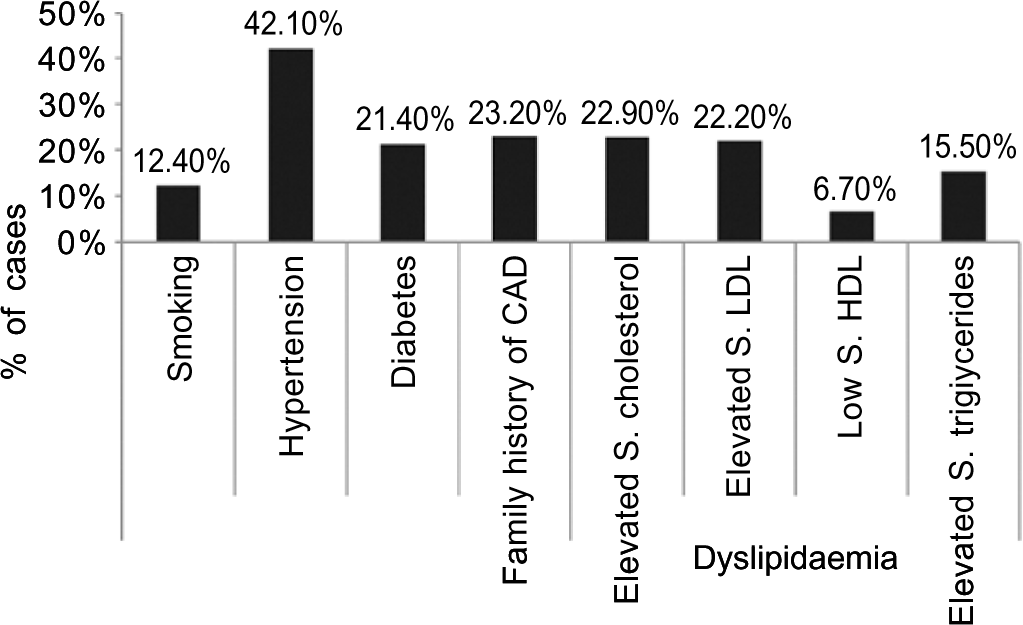
FIG 1.: Bar diagram showing distribution of various traditional risk factors in the study population CAD coronary artery disease S.HDL serum high-density lipoprotein S.LDL serum low-density lipoprotein
Export to PPT
CCS was done in all the patients. The mean (SD) CCS in all patients was 98.5 (290.18). The patients were categorized on the basis of Agatston scores (Table I). A majority of patients (n=583, 61.4%) had a calcium score of 0. The majority of patients with a calcium score of 0 had a normal CT coronary angiogram (n=492). However, there was a subset of patients with a CCS 0 but having CAD (n=91). Hence, using CCS as the sole tool for CAD prediction, the sensitivity, specificity, PPV and NPV were 80.1% 100%, 100% and 84.4%, respectively, with a diagnostic accuracy of 90.2%. Higher CCS was observed in CAD groups with increasing severity of stenosis (Table II).
TABLE I.: Coronary calcium score (CCS): Overall distribution in the study population
CCS severity (%) n (%) Normal: 0 583 (61.4) Minimal: 1–9 4 9 (5.1) Mild: 10–99 133 (14) Moderate: 100–399 118 (12.4) Severe: >400 6 7 (7.1) Total 950 (100) Coronary calcium score Mean (SD) 98.5 (290.18) Median (IQR) 0 (0–43.91) Range 0–3897TABLE II.: Comparison of coronary calcium score in patients with ‘no coronary artery disease’ versus non-obstructive coronary artery disease versus obstructive coronary artery disease groups
Case Coronary calcium score total p value Mean (SD) Median (IQR) Coronary artery disease (CAD) No CAD (n=492) 0 0.00 (0) <0.001 Non-obstructive CAD (mild, n=244) 94.58 (215.030) 16.70 (0–92.74) Obstructive CAD (moderate+severe, n=214) 329.34 (496.449) 157.87 (31.35–397.65) Mann–Whitney U-test No CAD Mild (non-obstructive CAD) <0.001 Obstructive CAD (moderate+severe) <0.001 Mild (non-obstructive CAD) Obstructive CAD (moderate+severe) <0.001EFV was calculated in all patients with similar results. A higher volume of regional fat was noted with increasing severity of CAD. The presence of calcium at an extracoronary site was found in 207 patients (21.8%). The most common site of calcification was thoracic aorta, whereas the least common site was mitral valve. The prevalence of traditional cardiovascular risk factors across the thoracic ECC sites is given in Table IIIa. The number of thoracic ECC sites in various CCS groups is given in Table IIIb.
TABLE IIIa.: Prevalence of thoracic extracoronary calcium in the study population along with traditional cardiovascular risk factors in each category
Characteristic Number of extracoronary calcium sites (%) 0 (n=743, 78.2%) 1 (n=128, 13.5%) 2 (n=60, 6.3%) 3 (n=18, 1.9%) 4 (n=1, 0.1%) Age (mean, median) 48.44, 49 58.27, 58 64.23, 64 64.78, 64 73, 73 Men 482 (64.87) 85 (66.40) 43 (71.67) 13 (72.22) 0 Smoking 90 (12.1) 21 (16.4) 3 (5.0) 2 (11.1) 0 Hypertension 279 (37.5) 73 (57.0) 39 (65.0) 8 (44.4) 1 (100) Diabetes mellitus 135 (18.2) 37 (28.9) 24 (40.0) 6 (33.3) 1 (100) Family history of CAD 167 (22.5) 35 (27.3) 17 (28.3) 0 1 (100) Dyslipidaemia High serum cholesterol 161 (21.7) 37 (28.9) 15 (25.0) 4 (22.2) 1 (100) Low serum HDL 44 (5.9) 10 (7.8) 8 (13.3) 3 (16.7) 0 High serum TG 114 (15.3) 21 (16.4) 10 (16.7) 2 (11.1) 0TABLE IIIb.: Prevalence of thoracic extracoronary calcium in the study population in various coronary calcium score groups
Coronary calcium score (n=950) Number of extracoronary calcium sites (%) 0 (n=743, 78.2%) 1 (n=128, 13.5%) 2 (n=60, 6.3%) 3 (n=18, 1.9%) 4 (n=1, 0.1%) Normal: 0 (583, 61.4%) 554 (95.02) 27 (4.63) 2 (0.3) 0 0 Minimal: 1–9 (49, 5.1%) 37 (75.51) 6 (12.24) 5 (10.20) 1 (2.04) 0 Mild: 10–99 (133, 14%) 86 (64.66) 33 (24.81) 12 (9.02) 2 (1.50) 0 Moderate: 100–399 (118, 12.4%) 46 (38.98) 41 (34.74) 24 (20.34) 7 (5.93) 0 Severe: >400 (67, 7.1%) 20 (29.85) 21 (31.34) 17 (25.37) 8 (11.94) 1 (1.49)On taking into account the presence of thoracic extracoronary calcium in at least one site, the sensitivity, specificity, PPV and NPV for the presence of CAD were 40.6%, 95.7%, 89.9% and 63.4%, respectively, with a diagnostic accuracy of 69.2%. All patients with a CCS of 0 (n=583) were categorized into two groups based on the absence or presence of CAD (n=492 and 91, respectively). Subsequently, the median EFV and presence of ECC were compared between the two groups (Table IV). The median values of EFV were significantly higher in the ‘CAD present and CCS=0’ group compared to the ‘CAD absent and CCS=0’ group (p<0.001). Presence of thoracic ECC involving at least single site was seen in only 6 of the 91 patients.
TABLE IV.: Comparison of epicardial fat volume in ‘patients without coronary artery disease’ with coronary calcium score=0 versus ‘patients with coronary artery disease’ with coronary calcium score=0
Group Epicardial fat volume Mean (SD) Median CAD present and CCS=0, 91 cases 69.07 (27.54) 64.72 CAD absent and CCS=0, 492 cases 56.69 (27.65) 51.802It was observed that when the combination ‘EFV and/or CCS’ is considered for the detection of presence of CAD, the sensitivity and NPV for predicting CAD significantly improved compared to either of them taken in isolation (95% and 90.7%, respectively). However, the specificity had reduced (45.9%). When the ECC is taken together with CCS and EFV, no further improvement in sensitivity or NPV was observed (95% and 90.5%, respectively). Therefore, considering EFV together with CCS may provide an added advantage for CAD screening, as it can identify those cases who had CAD with a 0-calcium score (due to non-calcified plaques), thereby improving the sensitivity and NPV. When ROC curves were plotted, the combination of CCS and ECC was found to have the highest AUC (>0.80); however, the sensitivity and NPV were 81.4% and 84.7%, respectively (lower than those observed with the abovementioned combination of fat volume and calcium score). These results are given in Table V. On multivariate analysis, ECC was not found to be an independent predictor of CAD.
TABLE V.: Various combinations in ‘no coronary artery disease’ versus ‘coronary artery disease present’ in the form of sensitivity, specificity, negative predictive value, positive predictive value and diagnostic accuracy
‘No CAD’ versus ‘CAD present’ AUC Sensitivity (%) Specificity (%) PPV (%) NPV (%) Accuracy (%) p EFV and/or CCS total 0.705 95.0 45.9 62.1 90.7 69.58 <0.001 EFV and/or ECC total 0.655 86.2 44.7 59.2 77.7 64.7 <0.001 CCS total and/or ECC total 0.885 81.4 95.5 94.4 84.7 88.7 <0.001 EFV and/or CCS total and/or ECC total 0.698 95.0 44.7 61.5 90.5 68.9 <0.001 DISCUSSIONCCS is a time-tested tool for the evaluation of coronary atherosclerosis and a predictor of future cardiovascular events. It is well known that the presence of calcium in the coronary arteries is pathognomonic of atherosclerosis. The total CCS is a representation of the overall coronary plaque burden.6–12 Asymptomatic patients without any detectable coronary calcium have a low prevalence of CAD and have a good prognosis.13–20 CCS has outperformed the veracity of conventional risk factors for CAD, carotid intima media thickness and highly sensitive C-reactive protein as a predictor of cardiovascular events, in both symptomatic and asymptomatic patients. The relevant prognostic information obtained using CCS may be useful to initiate or intensify appropriate treatment strategies to slow atherosclerotic disease progression.21 Although the absence of coronary calcification has a high NPV for ruling out presence of atherosclerosis, a number of patients with non-calcified or mixed density coronary atherosclerotic plaques may escape detection or be underestimated by assessing CCS alone. This has been evaluated in previous studies by Gottlieb et al.22 and Morita et al.23 It has been proposed that patients with acute coronary syndrome were found to have higher prevalence of non-calcified vulnerable plaques rather than calcified plaques, in contrast to patients with stable CAD.24,25
In such cases, the newer non-traditional tool for cardiovascular risk prediction—EFV coupled with estimation of ECC—can help improve prediction of CAD. Our previous study showed higher values of EFV in patients with higher degree of coronary artery stenosis. Moreover, it was an independent risk factor for the presence of CAD.5 In the present study, it was observed that the subset of patients with even mild CAD but a CCS of 0 had significantly higher median values of EFV compared to the patients without CAD. This not only strengthens the fact of EFV being an independent contributing risk factor for detection of CAD, but also implies a possibility that it may even predate CCS as a CAD risk predictor. After multivariate adjustment in patients with a 0-calcium score, Ito et al. had found EFV to be a significant predictor of obstructive CAD, and its utility as an important marker for CAD in symptomatic patients with non-calcified plaques.26
A graded association of increasing amount of multisite extracoronary calcium with higher CAD and mortality risk has been suggested in previous studies, and the information supplemented the traditional cardiovascular risk markers.27 In our study, although multisite ECC was more frequently seen in patients with CAD, especially obstructive CAD compared to patients without CAD, ECC if considered alone was found to be a poor predictor of CAD. Moreover, when considering ECC together with CCS and EFV, no further improvement in CAD detection was achieved. Although the AUC for combination of ECC and CCS was maximum, the sensitivity and NPV were lower compared to that of other combinations.
There are a few limitations of our study. First, for any new suggested diagnostic criteria, it has to be validated. Ideally, two datasets should be made a test dataset and a validation dataset (having similar characteristics). The results of the test dataset have to be applied on the validation dataset. However, for our study, a sequential study needs to be designed for studying the results. Another limitation is lack of follow-up of the patients enrolled in the study, to look for any major adverse cardiovascular events as well as CAD progression.
ConclusionsWe advocate the combined use of CCS along with EFV to serve as a more robust model for predicting CAD. Future research should determine the prognostic value of EFV and pericardial fat volume, their distribution and comparative analysis with abdominal fat estimation and the perivascular fat attenuation index with the development of extensive normograms for early cardiovascular risk prediction. These can be useful adjuncts in primary prevention of a cardiovascular event with no additional radiation burden or expenditure to the patient as these are analysed on the same set of non-contrast CT images obtained for the estimation of coronary artery calcium. The research is capable of catapulting individualized CAD risk profiling to a higher and more sensitive level. Moreover, it also expands the utility of CT as a modality for CAD prediction and evaluation: predating CCS by EFV on the one end of the spectrum, visualization and characterization of vulnerable plaques on dual source CT, and finally FFR-CT for physiological assessment of stenosis at the other end of the spectrum.
留言 (0)