
記住我
Patients were recruited from the ED clinic at Uppsala University Hospital between October 2014 and December 2019. The ED clinic is an outpatient clinic for patients with AN and atypical anorexia nervosa (AAN), moderate to severe BN, and other complex ED cases with comorbidities or suicidality. Binge eating disorder (BED), avoidant restrictive food intake disorder (ARFID), and subclinical BN are generally not treated at the clinic, but generally referred to the obesity unit, primary or private care or the general psychiatry. All patients referred to the clinic, fulfilling the inclusion criteria of a minimum age of 18 years and an ED diagnosis were eligible for this study, and in total 227 patients were included at the start of their treatment. The inclusion was broad to represent a clinical sample. The exclusion criteria included being assessed as unable to participate and fill out questionnaires due to severe mental illness, i.e., when patients needed inpatient care or other emergency interventions, had insufficient knowledge of Swedish, or had limited cognitive abilities. ED diagnoses were determined by any one of 15 psychologists, trained in the Eating Disorder Examination Interview (EDE-I) by one expert. To assess the inter-rater reliability six filmed interviews conducted by the expert, were assessed by all the 15 trained psychologists, who showed complete agreement in all ratings. As the University hospital, where the study was performed, used DSM-IV for diagnostics when the study was initiated, a decision was made to continue diagnosing according to the DSM-IV throughout. Afterwards, a recoding in accordance with the DSM-5 criteria was performed so that the sample could be presented in accordance with the revised diagnostic criteria. The group of other eating disorders included ARFID (n = 2), other specified eating disorders (OSFED): BN of low frequency (n = 16), purging disorder (n = 14), and others (n = 21), where the reason for not fulfilling a specific ED diagnosis was another than exemplified OSFED groups in the DSM-5. BED (n = 6) was also included in the group of other eating disorders, since it was rarely treated at the clinic.
All patients who decided to participate in the study received verbal and written information about the study at their first meeting during the psychological assessment phase and gave written informed consent. Weight and height measurements were performed at the clinic and background variables such as age, gender, marital status, occupation and level of education were collected at baseline.
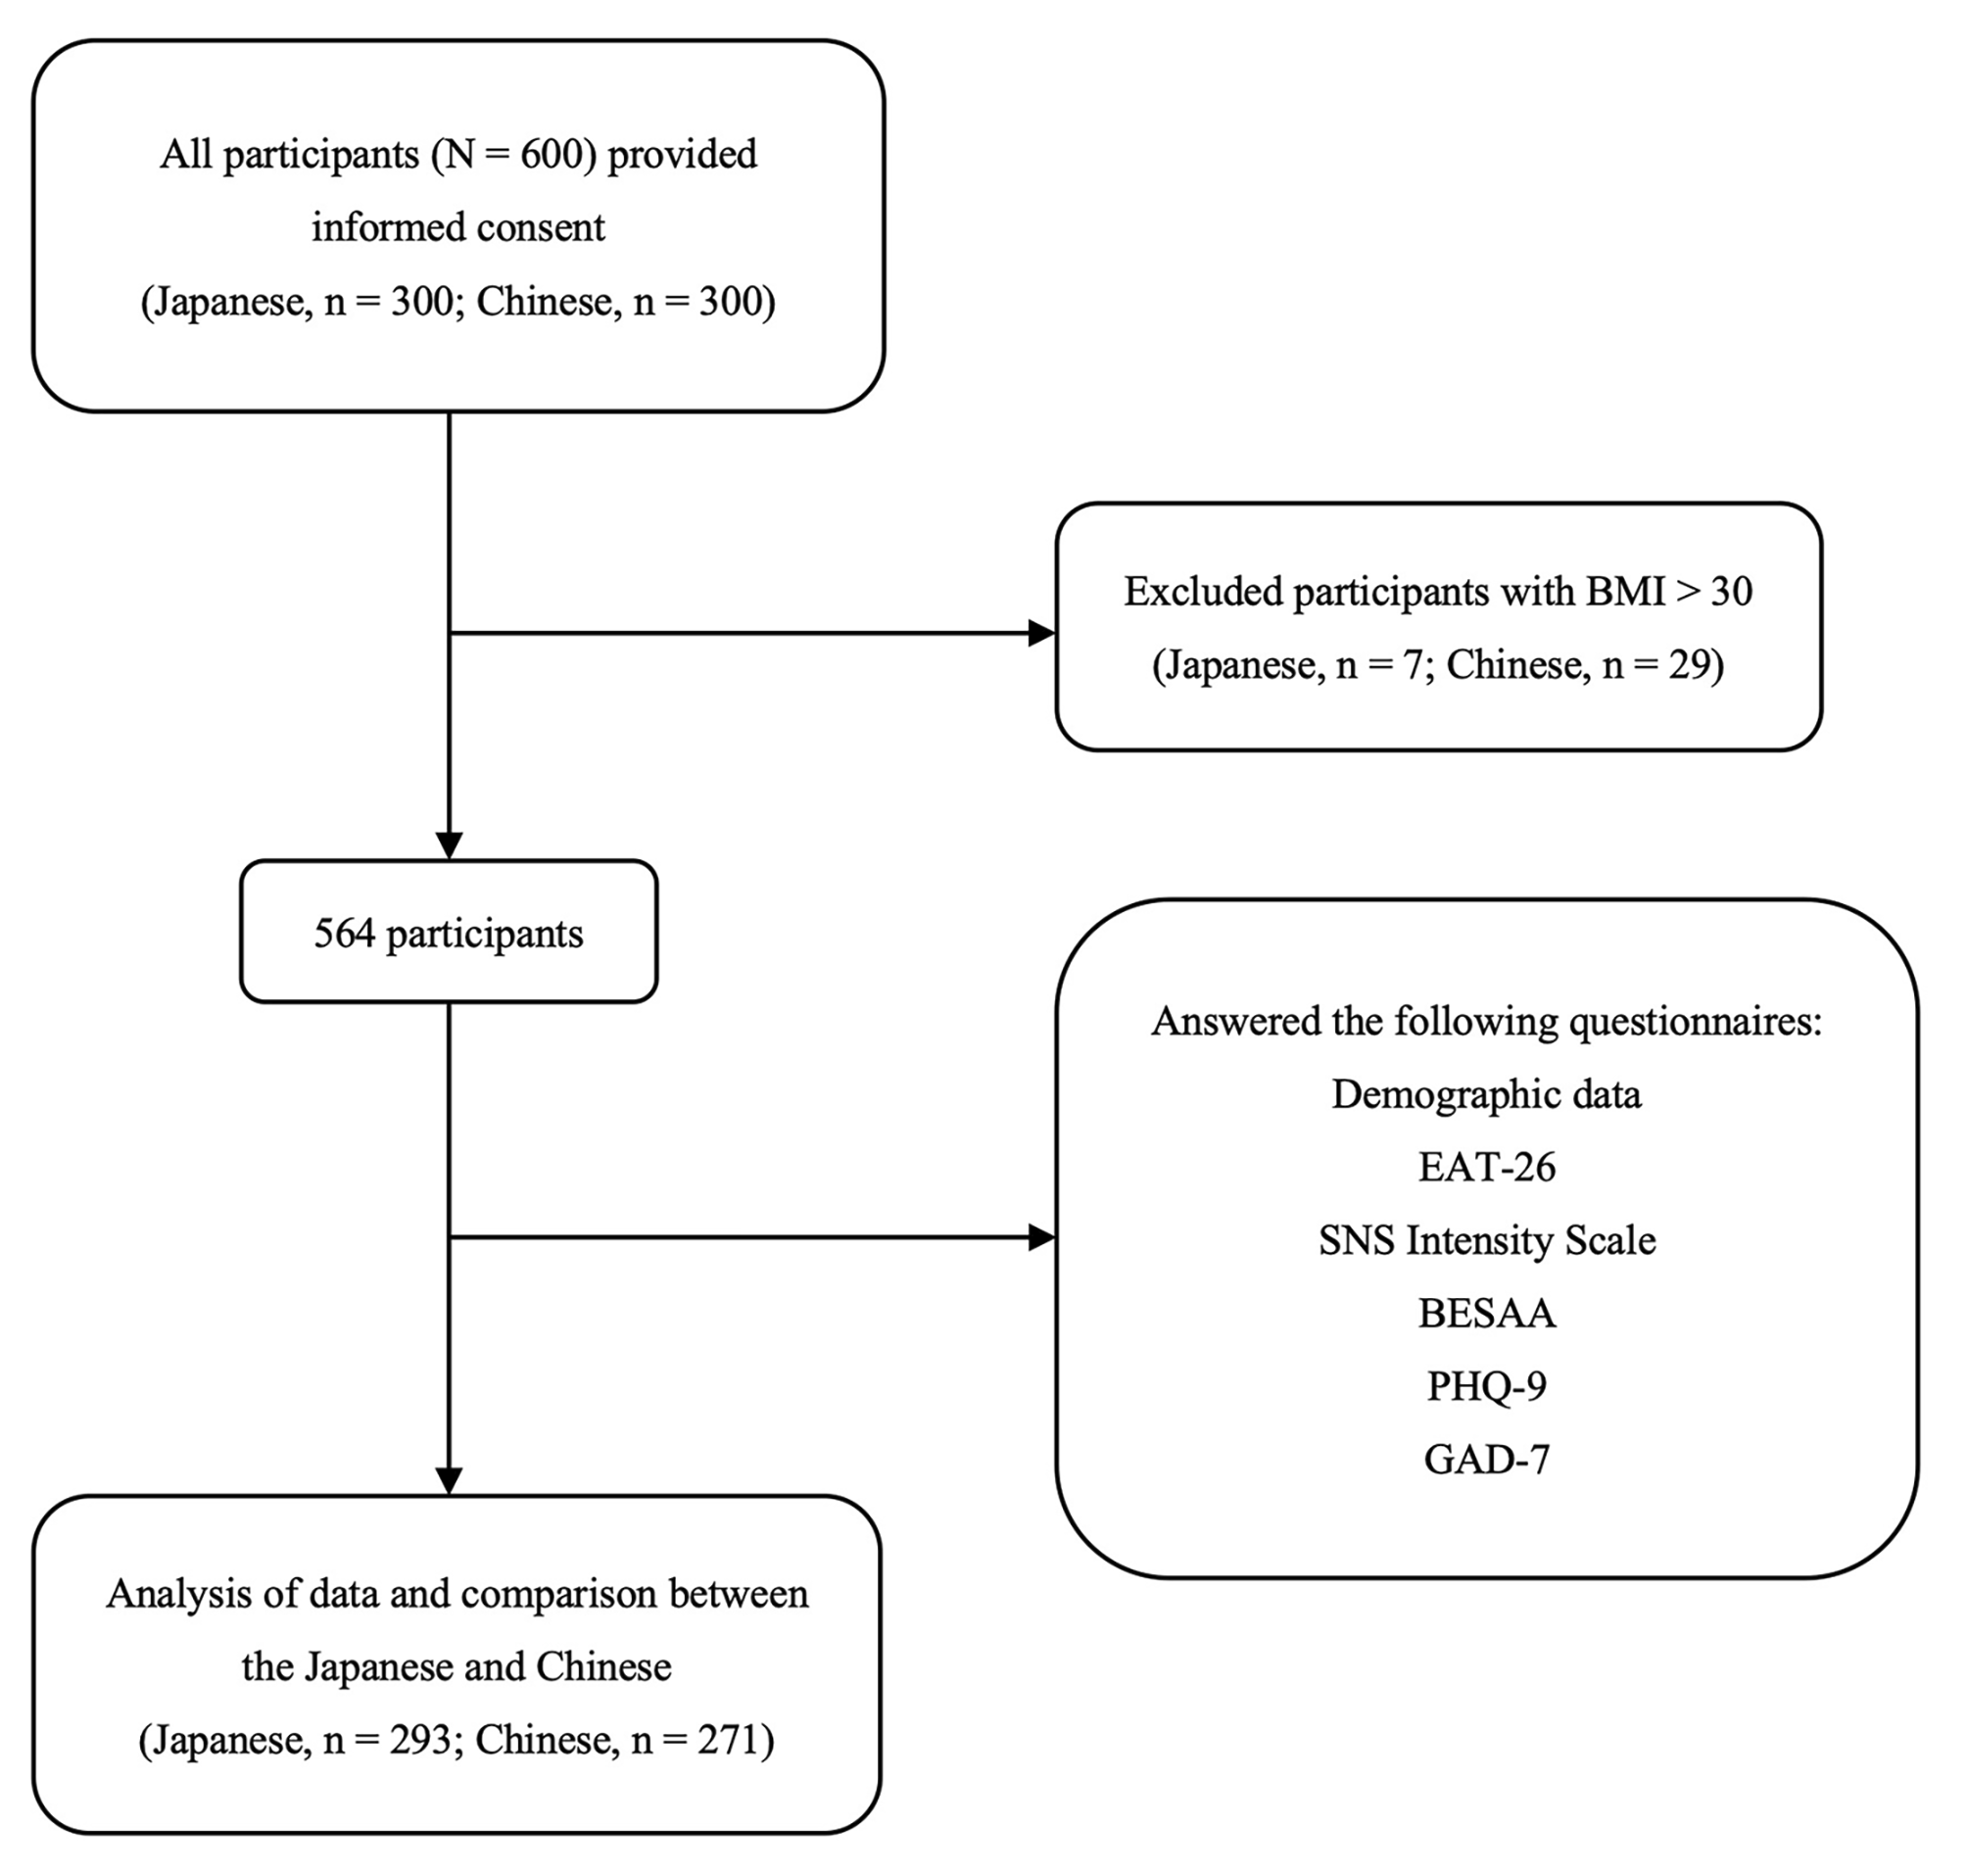
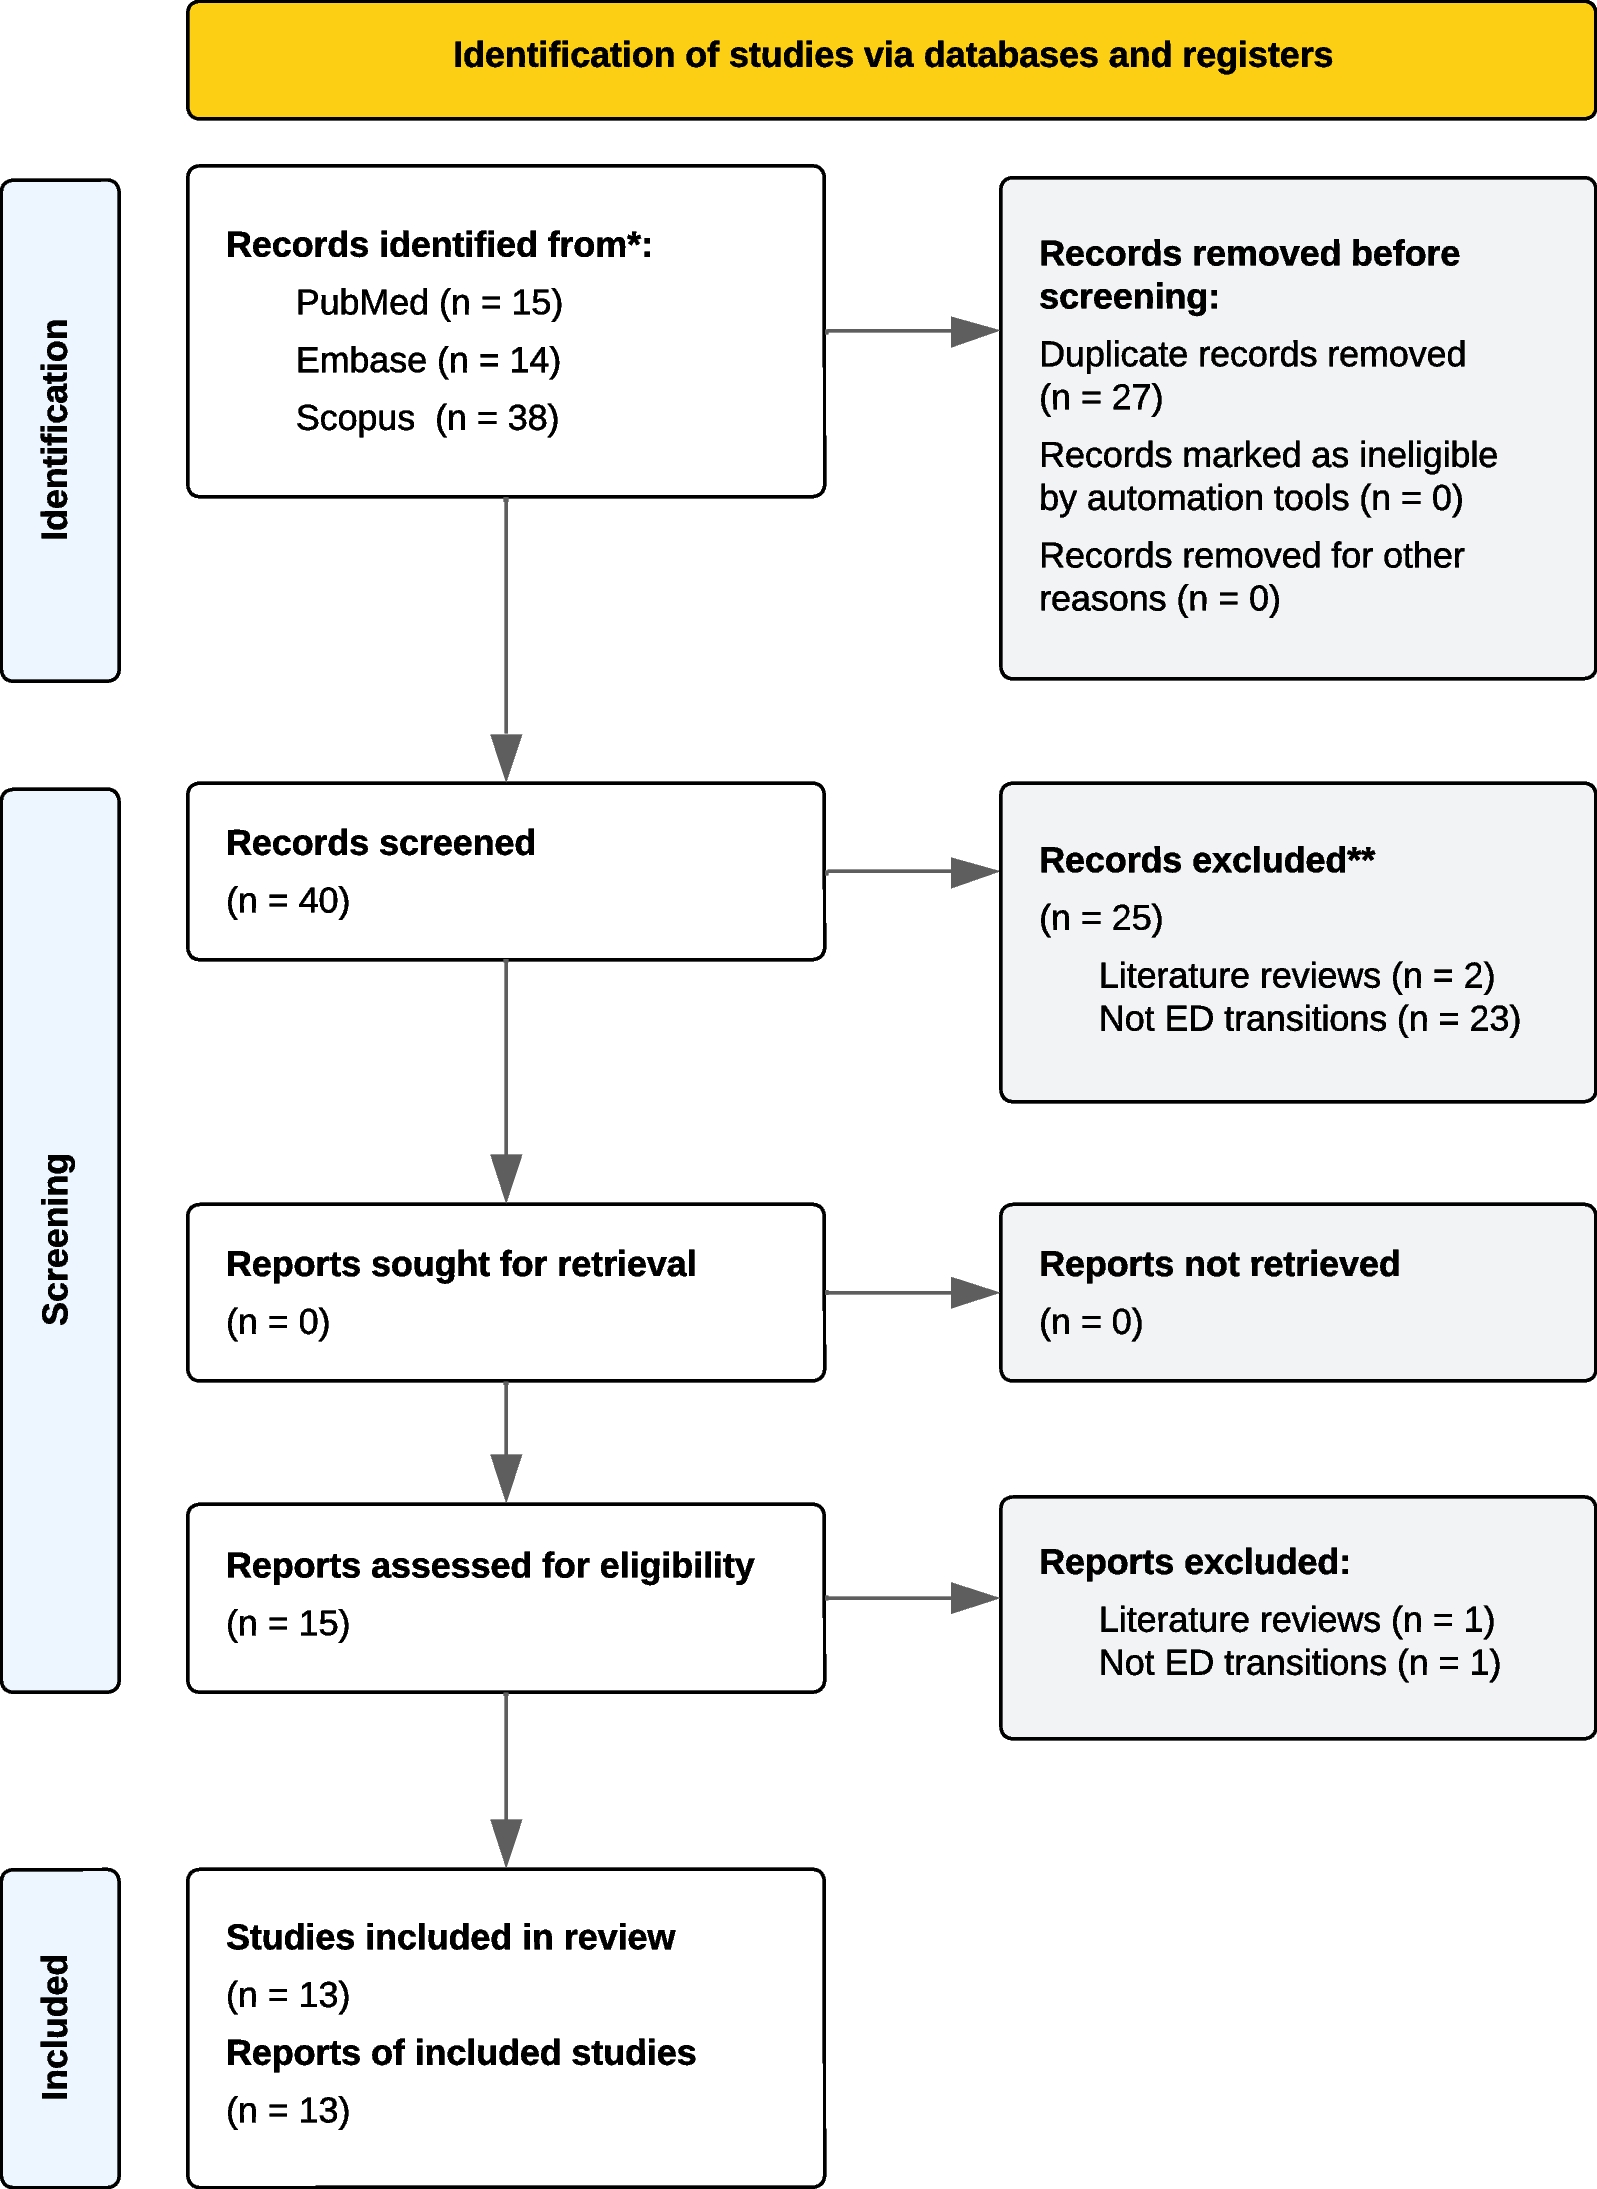
At the time of their last therapy session, a subset of patients were asked to fill out questionnaires yet again. Twenty agreed, with 14 patients completing all questionnaires, i.e., EDE-Q, HSCL-25 and EUC-13 at both time-points. Due to organizational issues at the clinic, the post-treatment measurements were not always handed out and collected as planned, explaining the small sample. The 14 patients had received Enhanced Cognitive Behavioral Therapy, typically consisting of 20 sessions for BN and 40 sessions for AN patients, over the same number of weeks. 10 had reached ratings within one SD of the mean of a non-clinical sample, indicating possible remission [Eating Disorder Examination Questionnaire (EDE-Q) ≤ 2.83]. The recruitment process is shown in Fig. 1.
Fig. 1
Flowchart of participant recruitment. AAN = Atypical Anorexia Nervosa. AN = Anorexia Nervosa. BN = Bulimia Nervosa. ED = Eating Disorder
InstrumentsEDE-I and EDE-QAll participants underwent the semi-structured EDE-I at baseline, to determine ED diagnosis. The interview was conducted by a trained psychologist and focused on attitudes and behavior central to ED pathology [20].
The EDE-Q is a well-established self-report instrument with 36 items, derived from the EDE-I, to assess ED symptoms. The attitudinal items are divided into four subscales—restraint, eating concern, shape concern, and weight concern—and are rated by patients for severity or frequency, using a 7-point rating scale. Responses to behavioral questions, for instance on binge eating and vomit induction, are given as number of days. The level of ED psychopathology increases with a higher score. As with the EDE-I, the questions cover the preceding 28 days. Swedish norms are available with a mean score of 1.56 (SD = 1.27), with 84% of the population scoring 2.83 or below, in the non-clinical population [21]. Considering the prevalence of EDs, scores below this value can be used as an indication of EDE-Q values similar to those in a non-clinical population and, in the absence of other measures, as a proxy for remission or at least partial remission. Correlations with other measures of similar constructs range from 0.40 to 0.79 for the different subscales [22].
Data support the test–retest reliability of both EDE-I and EDE-Q, as well as their validity in differentiating those with ED pathology from non-clinical controls. The internal consistency of EDE-Q is acceptable to high, with the different subscales ranging from coefficient alpha 0.7 to 0.93 [22].
EUC-13The Ego Undercontrol Scale—short version (EUC-13) is a self-rating questionnaire that contains 13 items, measuring levels of expression and inhibition of emotional impulses on a single spectrum ranging from over- to undercontrol. The EUC-13 is based on a three-factor model consisting of the subscales uninhibited behavior (five items), planful conscientious behavior (five items), and socially restrained behavior (three items). The items on each subscale are rated on a four-point Likert scale, ranging from “Disagree very strongly” [1] to “Agree very strongly” [4]. When calculating the final score, the subscales of planful conscientious behavior and socially restrained behavior are reversed. Thus, a high score indicates low levels of emotional impulse inhibition (high undercontrol). The EUC-13 has been validated in a non-clinical Swedish community sample, showing adequate test–retest reliability, in addition to construct validity and acceptable internal consistency (α = 0.71) [23]. However, use of the global score is recommended due to its higher validity [24].
HSCL-25The Hopkins Symptom Checklist-25 (HSCL-25) is a 25-item self-report questionnaire designed to screen for anxiety (10 items) and depression (15 items) symptoms. The respondent rates each symptom, depending on how bothersome it has been during the week prior to assessment, on a scale ranging from “Not at all” [1] to “Extremely” [4, 25]. The scale has been widely used for screening, with a cut-off of 1.75, demonstrating accuracy when validated against various diagnostic interviews worldwide and has a high internal consistency, with a coefficient alpha of 0.80 for both subscales, respectively [26]. The scale’s median average score has also shown high correlation with other measures of mental health [27], and satisfactory validity and reliability in assessing mental symptoms [28]. The scale is validated in a Swedish sample [26].
Data collection and analysesMissing values for single questions in EUC-13 and HSCL-25 were handled through single imputation using the mean of the affected subscale, as long as the missing values were limited to less than 20% of the subscale, in accordance with recommendations [29]. If this limit was exceeded, the entire scale was omitted for that individual. However, missing values were rare (< 0.5%). For the EDE-Q, a global score was calculated as the mean score of all rated items, as long as at least 50% of the items were rated, in accordance with the scoring recommendations [30].
Normal distribution of the data was checked by visualization in histograms, and through the values of skewness and kurtosis, and data were further checked for outliers using box- and scatterplots.
The relationship between global HSCL-25 scores and the EUC-13 was initially visualized in a scatterplot and through locally estimated scatterplot smoothing (LOESS), which indicated a slight curvilinear trend. An analysis of variance (ANOVA) was conducted, further strengthening indications of a quadratic term, with a higher R2 and a lower standard error of the estimate, in addition to a significant F-ratio and nonsignificant Levene’s test. Additionally, a linear regression was tested, resulting in similar, but somewhat lower, explained variance than in the quadratic regression. A quadratic regression model was therefore chosen, with global HSCL-25 score as the dependent variable, as well as a model with the subscale for depressive symptoms as the dependent variable. As the LOESS of levels of self-control in relation to symptoms of anxiety showed a linear trend, a linear regression was chosen for this analysis. Assumptions for these models were tested, all of which showed the data as suitable for regression models. The analysis was also conducted excluding the rarer and atypical eating disorders OSFED: ARFID, purging disorder, and OSFED: others with essentially unchanged results, and these participants were therefore included in all analyses.
Next, a visual representation of potential confounders was performed in a directed acyclic graph. Adjustments for gender, age, and starvation were found to be necessary to estimate the effect of EUC-13 scores on HSCL-25 scoring, for which we applied BMI as a proxy. The potential confounding effect of EDE-Q was more unclear, depending on whether the relationship between EUC-13 and EDE-Q scoring was considered uni- or bidirectional. Subsequently, two adjusted models were created, one correcting only for gender, age, and BMI, and the other also including EDE-Q scores. Correlations between the described factors and the outcome, HSCL-25, were tested, and the factors were checked for data multicollinearity prior to analyses, showing weak to non-significant correlations. Data on confounding factors were available for 220 of the participants.
To examine how extreme values of self-control, i.e., over- and undercontrol, related to the degree of symptoms of anxiety and depression, measured with HSCL-25, the participants were divided into four groups, based on their EUC-13 scores, for a subset of analyses. These groups were defined by standard deviation (SD) from the sample mean, in steps of 1 SD. The number of groups was chosen to enable comparison between what may be considered functional levels of over- and undercontrol (in the groups − 1 and + 1 SD from the sample mean, respectively) and those with more extreme levels, while still ensuring sufficient numbers of participants in each group. This generated the following groups: highly overcontrolled (n = 32), overcontrolled (n = 101), undercontrolled (n = 68), and highly undercontrolled (n = 26). The analyses conducted in these groups included visualization in boxplots for the two subscales anxiety and depression symptoms, a one-way ANOVA, and Tukey’s test.
For the exploratory analyses in the subgroup of participants with both pre- and post-treatment measurements, sample differences were tested with Wilcoxon’s signed-rank test, which was chosen due to the small sample size. Data was further visualized in side-by-side boxplots and the reliable change index was calculated for each individual.
Analyses were all conducted with SPSS Statistics version 28.0.1.0.
留言 (0)