
記住我

We conducted a retrospective, single-center study approved by the institutional review board. All clinical CTLS exams performed from January 1st, 2012, through September 30th, 2014, on participants who had an in-network primary care physician (n = 1703) were included. This enrollment period was chosen to allow for a 5-year follow-up time period from the last baseline scan. The dataset was closed on September 30th, 2019, except for data collection on pulmonary referral and ILD diagnosis, which was closed on October 31st, 2020. To qualify for our study, individuals had to satisfy the National Comprehensive Cancer Network (NCCN) Guidelines® Lung Cancer Screening Version 1.2012 high-risk criteria for lung cancer. Enrollees were asymptomatic and had a physician order for CTLS, were free of lung cancer for ≥ 5 years, and had no known metastatic disease [20]. Individuals with a documented history of ILD were excluded.
Follow-up scans used to evaluate ILA progression were designated by annual screening rounds with T0 representing the initial scan and T4 representing the 5th round of screening. Each round of screening ended with a negative scan (Lung-RADS® 1 or 2) and the next round of screening was determined by the first screening exam at least 11 months (335 days) after that negative scan. Individuals found to have a malignancy were censored at the time of first positive scan. Those with T4 screening scans were scored for progression (n = 652).
Clinical variablesBaseline demographic and clinical variables, including age, sex, ethnicity, BMI, smoking history, were collected prospectively as part of the CTLS program and stored in a centralized data repository as previously described [21, 22]. Additional clinical variables, including cancer, mortality, cause of death, date of pulmonary referral, reason for pulmonary referral, and ILD diagnosis, not already available in this data repository, were collected retrospectively by manual review of the electronic medical record or pulled directly from the EMR and stored utilizing a custom-designed database (FileMaker ProVersion 11; Filemaker Inc, Santa Clara, California). Hospital admissions were collected using Lahey administrative coding data with hospitalization defined as first hospitalization after the baseline scan.
CT analysisClinically acquired CTLS examinations were performed on ≥ 64-row multidetector CT scanners (LightSpeed VCT and Discovery VCT [GE Medical Systems, Milwaukee, Wisconsin]; Somatom Definition [Siemens AG, Erlangen, Germany]; iCT [Philips Medical Systems North America, Cambridge, Massachusetts]) at 100 kV and 30 to 100 mA, depending on the scanner and the availability of iterative reconstruction software. Axial images were obtained at 1.25- to 1.5-mm thickness with 50% overlap and reconstructed with both soft tissue and lung kernels [23].
CT images were qualitatively scored retrospectively for the presence and nature of ILA utilizing Philips PACS and clinical grade monitors for image review. Scoring was performed independently by two thoracic radiologists (B.J.M, J.H). Scores that were discordant between the two radiologists were subsequently scored by a third reader—a pulmonologist with expertise in ILD (L.G.). Descriptors used for ILA were defined based on the Fleischner Society position paper [3]. The presence of ILA was scored as Yes/No/Indeterminate. ILA features that were scored include: A) nondependent ground glass, B) reticular abnormalities, C) traction bronchiectasis, D) honeycombing, and E) cysts. Indeterminate ILA was defined as focal or unilateral ground glass opacity, focal or unilateral reticulation, and patchy ground glass opacity (< 5% of lung) [1].
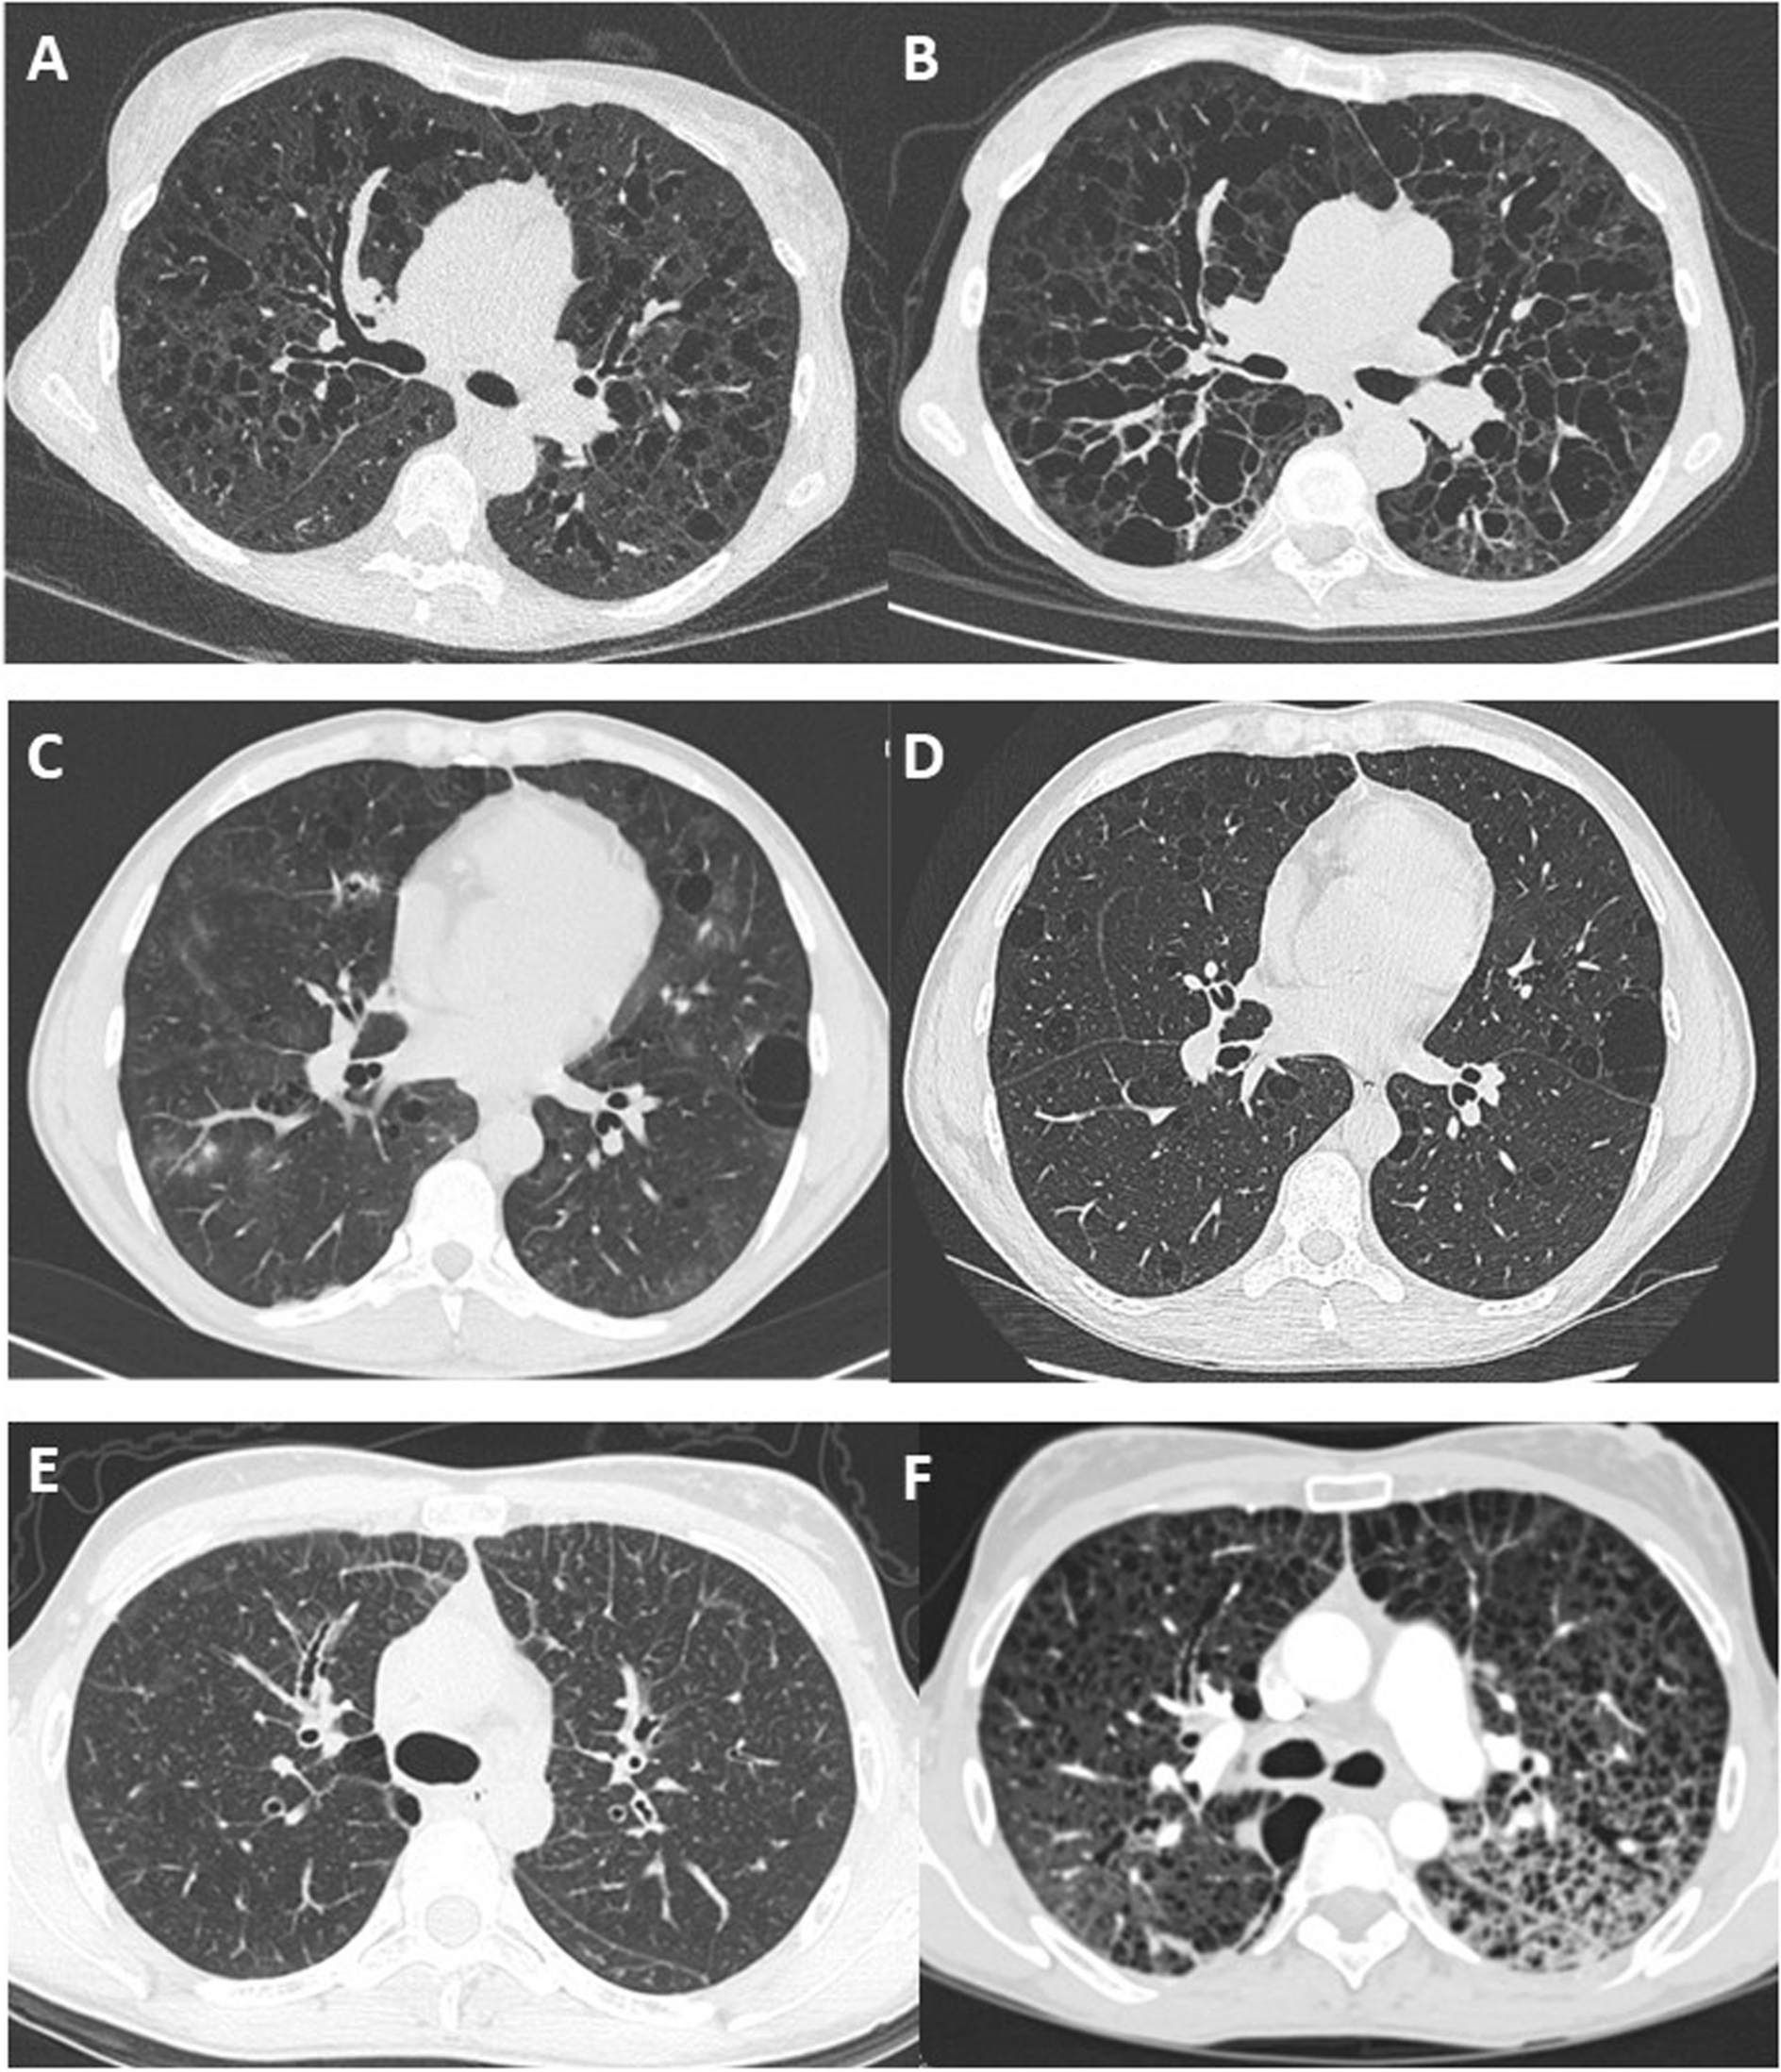
Usual interstitial pneumoniaILA were further classified for usual interstitial pneumonia (UIP) (typical, probable, indeterminate, alternate diagnosis) based on ATS/Fleischner Criteria [24, 25]. Figure 1 depicts examples of individuals with ILA (A) and ILA meeting probable UIP criteria (B).
Fig. 1
A Representative CT images from individual with ILA (arrows denote reticular opacities). B Representative CT images from individual with ILA, further characterized as probable UIP CT pattern (arrows denote subpleural reticular opacities, arrowheads denote traction bronchiectasis). C CT images demonstrating development of fibrotic ILA (asterisk) in a T4 scan (right) compared to no ILA at baseline (left)
ProgressionThe subset of individuals who had T4 screening scans were independently scored as above, and in addition, were compared to their baseline (T0) scans and scored for progression: stable, improved, and progressed. Figure 1C illustrates an example of an individual with ILA progression.
Statistical analysisThe ILA prevalence at baseline was described for the full cohort using frequencies and percentages by descriptor. Both presence and absence of ILA, as well as phenotypes, were described for the entire cohort. Progression of ILA, defined as worsening of existing ILA or incidence of ILA over 4 years, was described for the subset with T4 scans.
The primary analyses examined the association between baseline indeterminate ILA and ILA (presence/absence) and time to mortality, time to first hospitalization, and time to development of lung cancer in the full cohort. Kaplan–Meier plots were generated to visualize the associations between ILA variables and lung cancer, hospital admission and all-cause mortality. Cox regression proportional hazards models were used to test for this association in both univariate and multivariable models. The multivariable model was adjusted for age, sex, BMI, smoking status and pack years exposure; for the cox regression proportional hazards model for all-cause mortality, age was included as a time-dependent covariate.
Secondary analyses included Cox regression models to examine the association between phenotypes of ILA as the independent variables (separately) with outcomes of time to first hospitalization, lung cancer, and mortality adjusted for age, sex, BMI, smoking status and pack years exposure.
The Kappa (κ) value was calculated for agreement between first and second readers for the baseline scan. Interobserver agreement was categorized as poor (κ = 0–0.20), fair (κ = 0.21–0.40), moderate (κ = 0.41–0.60), good (κ = 0.61–0.80), or excellent (κ = 0.81–1).
To adjust for multiplicity, Bonferroni correction was utilized for our three primary outcomes and p-value significance was set at < 0.017. Otherwise, significance levels were set at a p-value ≤ 0.05. All statistical analyses were performed using STATA14.1 software (StataCorp LLC, College Station, TX).
留言 (0)