
記住我
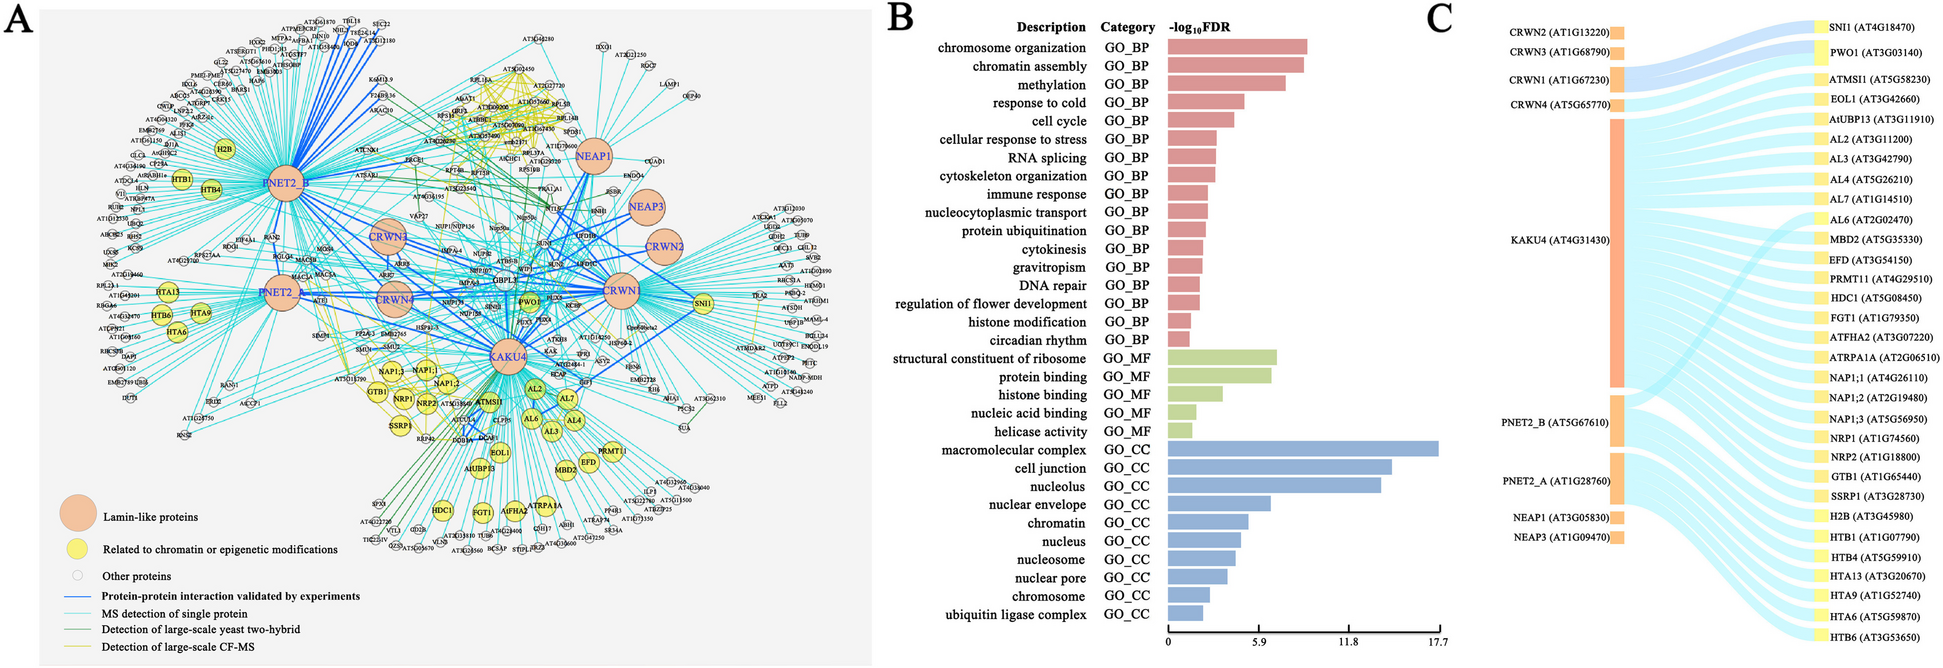
Whole-genome DNA methylation changes occurring between 2-m/o (A2), 8-m/o (A8), and/or 16-m/o (A16) mouse livers were determined by WGBS (Additional file 1: Fig. S1A). Bioanalyzer results showed that average insert sizes for bisulfite converted libraries were ~ 320 bp (Additional file 1: Fig. S1B). The sequenced data showed an average tenfold coverage of the whole mouse epigenome, where > 17 million CpGs (> 80% of the total 21.3 million CpGs) had at least threefold coverage (Additional file 1: Fig. S1C). Each liver sample is a pool of millions of cells. While DNA methylation on a single CpG site is binary (0 or 1) in nature at the single cell level, the average methylation of such a site from a pool of cells represents a gradient from 0 to 100%. WGBS data were analyzed using the MOABS software [39] that calculated the average methylation percentages across all CpG sites. Raw DNA methylation data of all samples were deposited individually in the GEO database (GSE211999). The levels of DNA methylation for each age group (representing the average of four biological samples) were displayed in histograms, where the X-axis showed the DNA methylation level (from 0 to 100%), and the Y-axis showed the event frequency (Fig. 1A). A DMC is defined by a change in the average methylation percentage of a CpG site whose absolute value is > 0.2 (20%) in one sample compared to another. A DMR is defined by ≥ 3 consecutive DMCs within 300 bp with the step size of 1 nt. 105,264 differentially hyper-methylated CpGs (hyper-DMCs) and 90,280 hypo-DMCs were identified by comparing 8-m/o to 2-m/o livers (A8:A2), which corresponded to 432 hyper-DMRs and 699 hypo-DMRs (Fig. 1B1, Additional file 3: Table 1). 98,810 hyper-DMCs (574 hyper-DMRs) and 93,115 hypo-DMCs (546 hypo-DMRs) were identified by comparing 16-m/o to 8-m/o livers (A16:A8) (Fig. 1B2, Additional file 3: Table 1). 119,899 hyper-DMCs (641 hyper-DMRs) and 102,384 hypo-DMCs (1,273 hypo-DMRs) were identified by comparing 16-m/o to 2-m/o livers (A16:A2) (Fig. 1B3, Additional file 3: Table 1).
Fig. 1
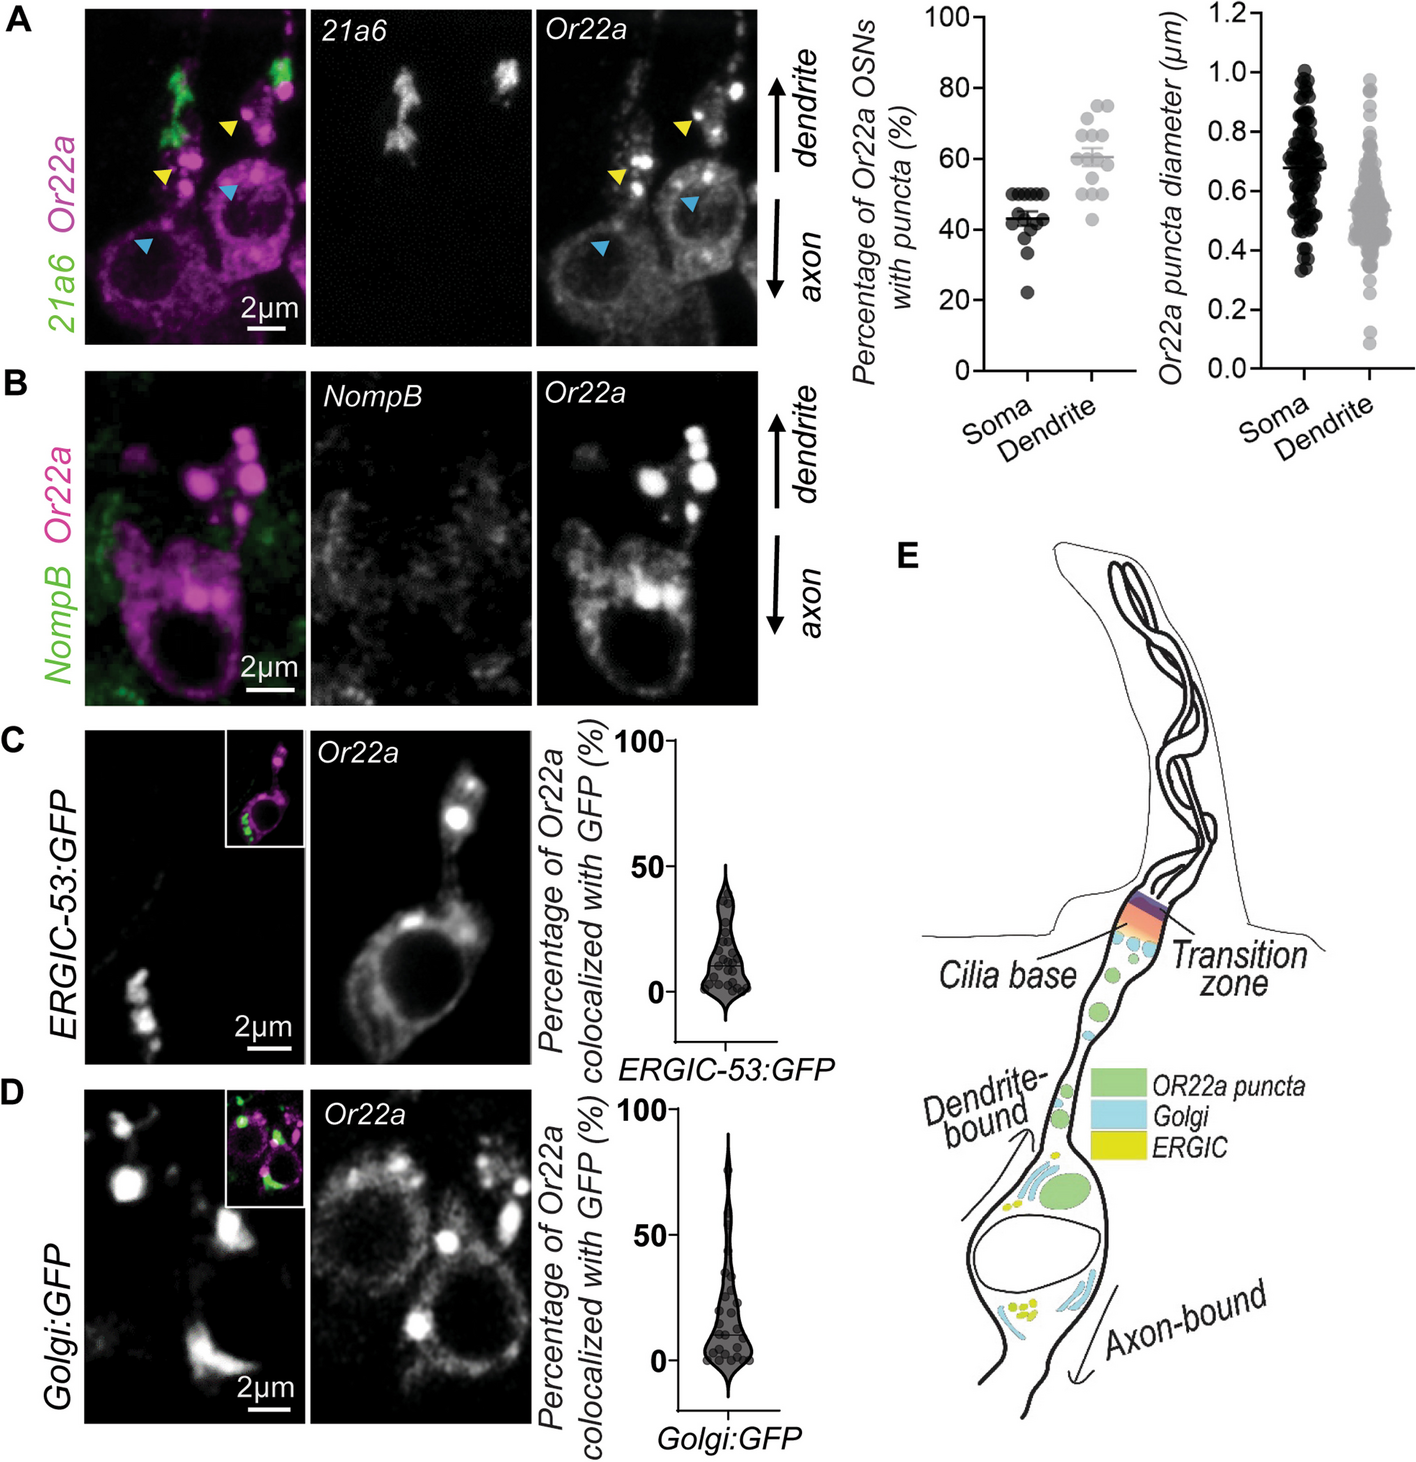
Discovery and characterization of differentially methylated regions (DMRs) in aging livers by whole-genome bisulfite sequencing (WGBS). A Histograms of CpG event frequencies categorized by their DNA methylation levels for three baseline age groups (A2R0, A8R0, and A16R0), where the X-axis shows the DNA methylation level (from 0 to 100%) and the Y-axis shows the CpG event frequency. Each graph represents the average of four biological samples. B Heat maps of aging DMRs by comparing 8-m/o (A8R0) to 2-m/o (A2R0) livers (B1), 16-m/o (A16R0) to A8R0 livers (B2), and A16R0 to A2R0 livers (B3). Color scale indicates Z score, showing increased or decreased methylation by red or green color, respectively. Hyper-DMRs are listed on top of hypo-DMRs. R0 indicates the non-regenerative condition. C Genomic distributions of hypo-DMRs (grey bars) and hyper-DMRs (black bars) in comparing A8R0-to-A2R0, A16R0-to-A8R0, or A16R0-to-A2R0 livers. Abbreviations: rsmk, repetitive DNA regions; gBody, gene body; TSS, transcription start site; rep, repeat; SINE, short interspersed nuclear elements; LINE, long interspersed nuclear elements; UTR, untranslated region. Y-axis indicates the percentage (%) of total hypo-DMRs or hyper-DMRs found in specific genomic regions of interest (hotspot analysis, see the “Methods” section). Different genomic regions are not mutually exclusive. D Pie charts of aging DMR percentages found in genomic regions containing gene structures versus intergenic regions (D1) or in repeat versus non-repeat sequences (D2). Abbreviations: TSS-7 k, within 7kB upstream of TSS; GB, gene body; IG, intergenic region; LINE, long interspersed nuclear elements; SINE, short interspersed nuclear elements; SimRep: simple repeats (micro-satellites); Satellite, satellite repeats; Others: other repeat categories as defined in RMSK from the UCSC genome browser (https://genome.ucsc.edu/cgi-bin/hgTables?db=hg38&hgta_group=rep&hgta_track=rmsk&hgta_table=rmsk&hgta_doSchema=describe+table+schema); nonRep: non-repeat regions
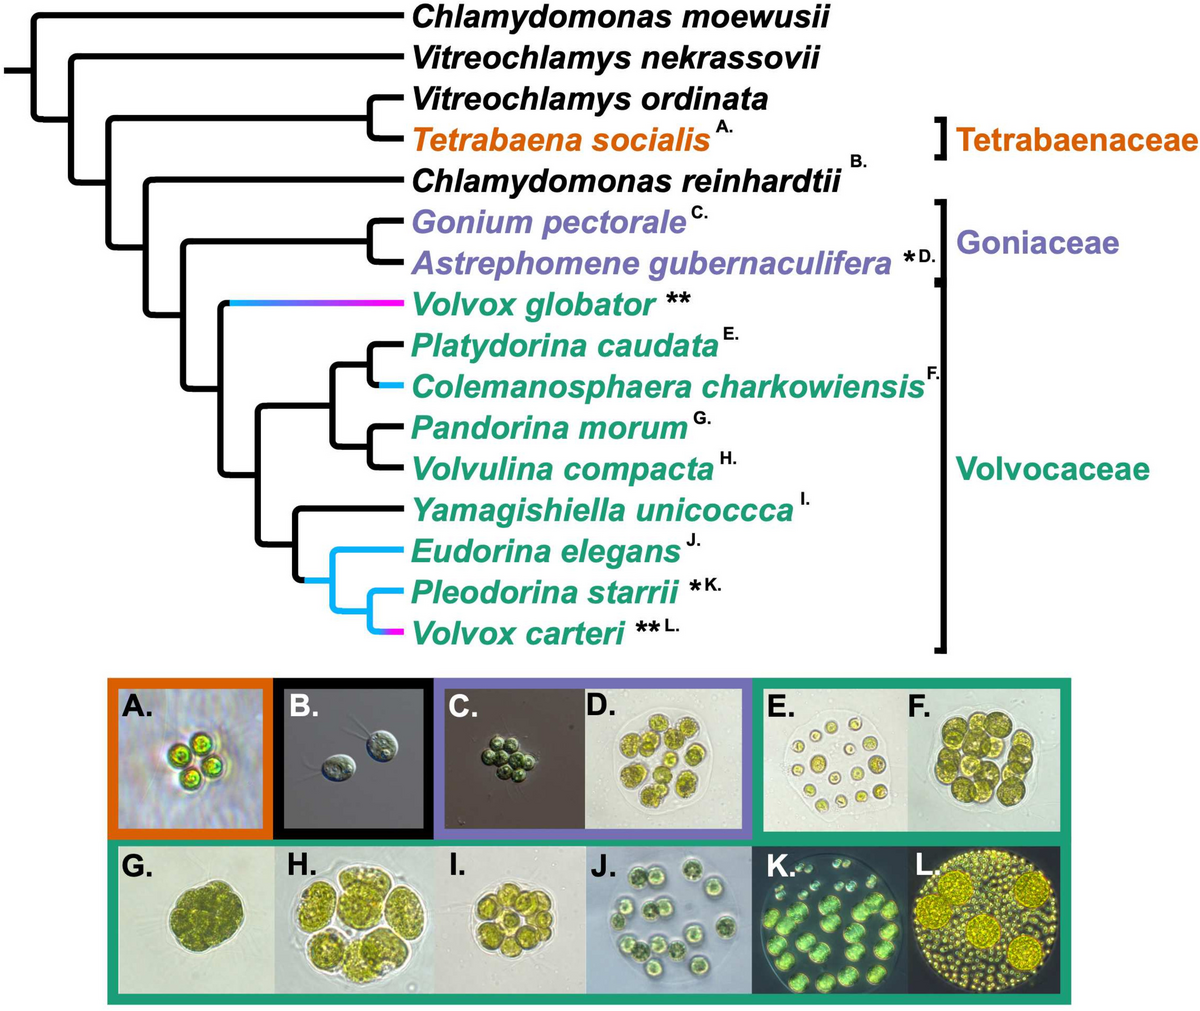
High percentages of the aging DMRs were found in two types of genomic regions (Fig. 1C, D, and Additional file 2: Fig. S2). One is related to gene structures, such as the transcription start site (TSS), gene body (gBody), 5′-untranslated regions (UTR), and 3′-UTR, indicating their potential roles in gene expression regulation. The other is related to repetitive elements listed in the rmsk (RepeatMaster track), including short interspersed nuclear elements (SINEs), long interspersed nuclear elements (LINEs), simple (microsatellite) or satellite repeats, and others, indicating their roles in genomic stability maintenance. gBody, TSS, and repeat sequences were the three most common genomic regions where aging DMRs were found. On average, 55% (52–58%) of the aging DMRs were associated with gene structures (Fig. 1D1 and Additional file 2: Fig. S2A), and 47% (39–59%) were associated with repeat sequences (Fig. 1D2 and Additional file 2: Fig. S2B). The percentages of hyper-DMRs on CpG islands are significantly higher than that of hypo-DMRs in 8 or 16 m/o compared to 2 m/o. Two examples of aging hyper-DMRs were found in association with c-Myc and Rai1 (Fig. 2A1). Aging increased DNA methylation in the gBody (exon2) region of c-Myc (chr15:61,988,015–61,988,032) between 2 and 16 m/o and in the gBody (exon2) region of Rai1 (chr11:60,140,252–60,140,367) between 2 and 8 m/o. c-Myc is known to be activated during liver regeneration and suppressed by C/EBPα. Rai1 has not yet been implicated in liver aging or regeneration. Two examples of aging hypo-DMRs were found in association with GSK3β and Nceh1 (Fig. 2A2). Aging decreased DNA methylation in the gBody (intron1) region of GSK3β (chr16:38,135,334–38,135,558) between 2 and 8 m/o and in the gBody region (ENSMUSG00000027698) of Nceh1 (chr3:27,279,398–27,279,785) in a progressive fashion from 2-to-8 to 16 m/o. Decreased expression of GSK3β has been associated with liver aging [27]. Nceh1 has not yet been implicated in liver aging or regeneration.
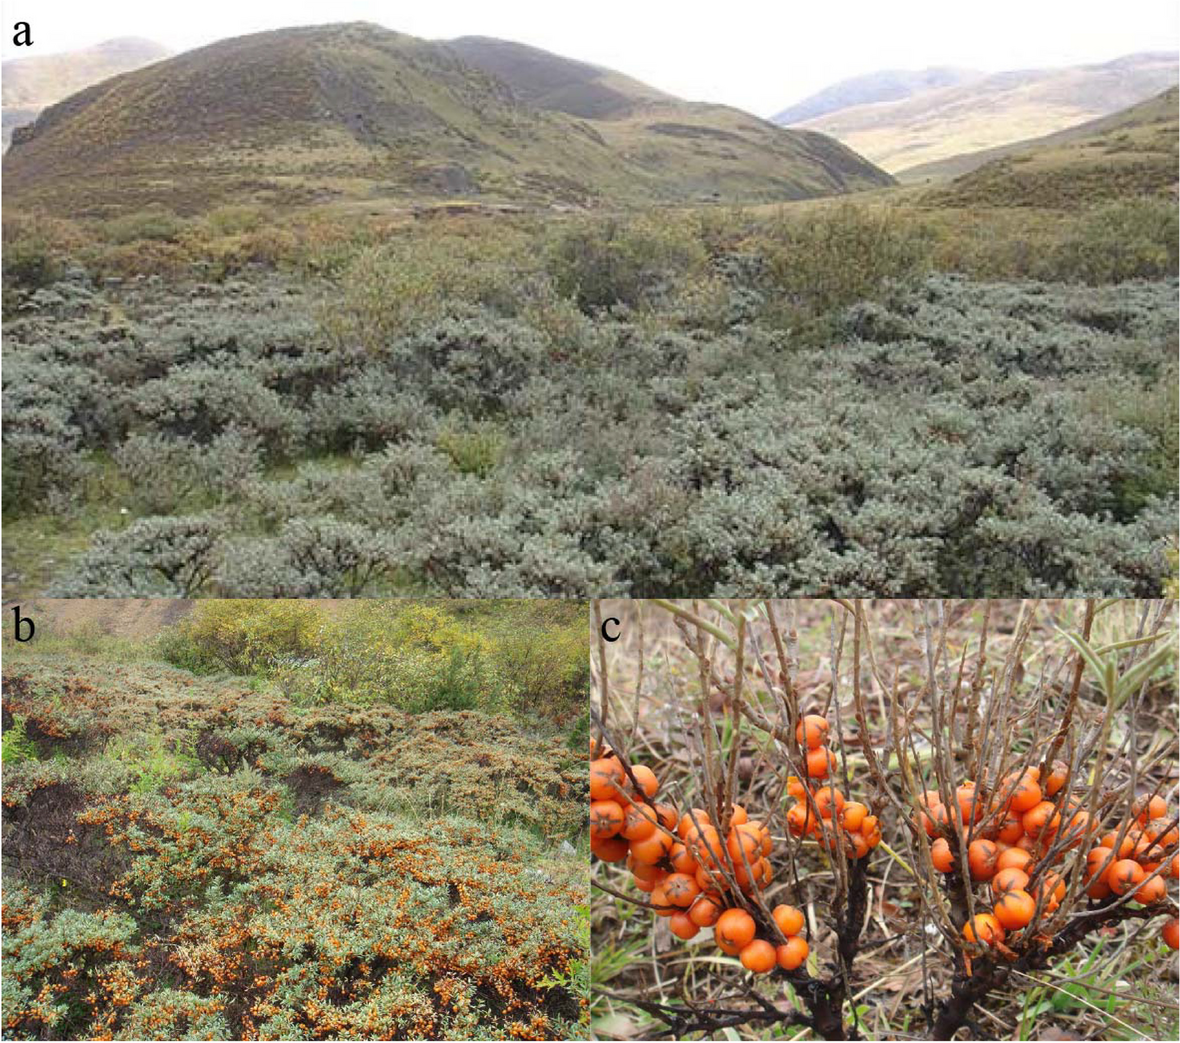
To dissect the biological events associated with the DNA methylation changes from 2-to-8 and from 8-to-16 m/o, we determined the numbers, genomic sites, and associated genes of aging DMRs that occurred between only 2 and 8 m/o (early single), only 8 and 16 m/o (late single), or both 2 and 8 and 8 and 16 m/o in a progressive or inverse fasion (Fig. 2B, Additional file 4: Table 2). Our results showed that most DMRs occurred as single events between 2 and 8 m/o (396 hyper-DMRs and 632 hypo-DMRs) or 8 and 16 m/o (510 hyper-DMRs and 507 hypo-DMRs). Only three DMRs showed progressive changes from 2-to-8 to 16 m/o. A sizable number of DMRs occurred in both 2-to-8 and 8-to-16 m/o but in an inverse fashion (36 hyper/hypo-DMRs and 64 hypo/hyper-DMRs). These findings indicated that early and mid-to-late aging DMRs are associated with genes of distinct biological functions. In the event that they are associated with the same genes, early and mid-to-late aging DMRs are often inversely methylated. Mapping of DMRs to both TSS and gBody regions identified 750 genes in the early single group, 654 genes in the late single group, 3 genes in the progressive group, and 70 genes in the inverse group. Gene Set Enrichment Analysis (GSEA) analyses revealed pathways enriched in genes mapped by early and late single DMRs (Fig. 2C). Notably, genes mapped by early single hyper-DMRs were enriched in the cell adhesion pathway, whereas genes mapped by early single hypo-DMRs were enriched in the Jak-STAT, TGF-beta, and growth factor receptor pathways. Contrarily, genes mapped by late single hyper-DMRs were enriched in the growth, develpmental growth, and chromatin modification pathways, whereas genes mapped by late single hypo-DMRs were enriched in the TNF-alpha and metabolic pathways (Fig. 2C, bolded). No specific pathways were found enriched by the progressive or inverse DMRs due to their low numbers. These results show that early (2-to-8-m/o) and mid-to-late (8-to-16-m/o) aging DMRs are indicative of downstream events of growth/regeneration and aging/degeneration, respectively.
Fig. 2
Examples and pathway analysis of aging liver DMRs. A Genome-browser (TRACK) views displaying two aging hyper-DMRs associated with Myc and Rai1 (A1) and two hypo-DMRs associated with GSK3β and Nceh1 (A2). DMRs are highlighted in blue shade. B Numbers of DMRs (No.) and their mapped genes in the early single, late single, progressive, and inverse categories. C GSEA analyses of genes mapped by the four different types of DMRs using the Hallmark (H), Canonical Pathway (CP), and Gene Ontology (GO) filters
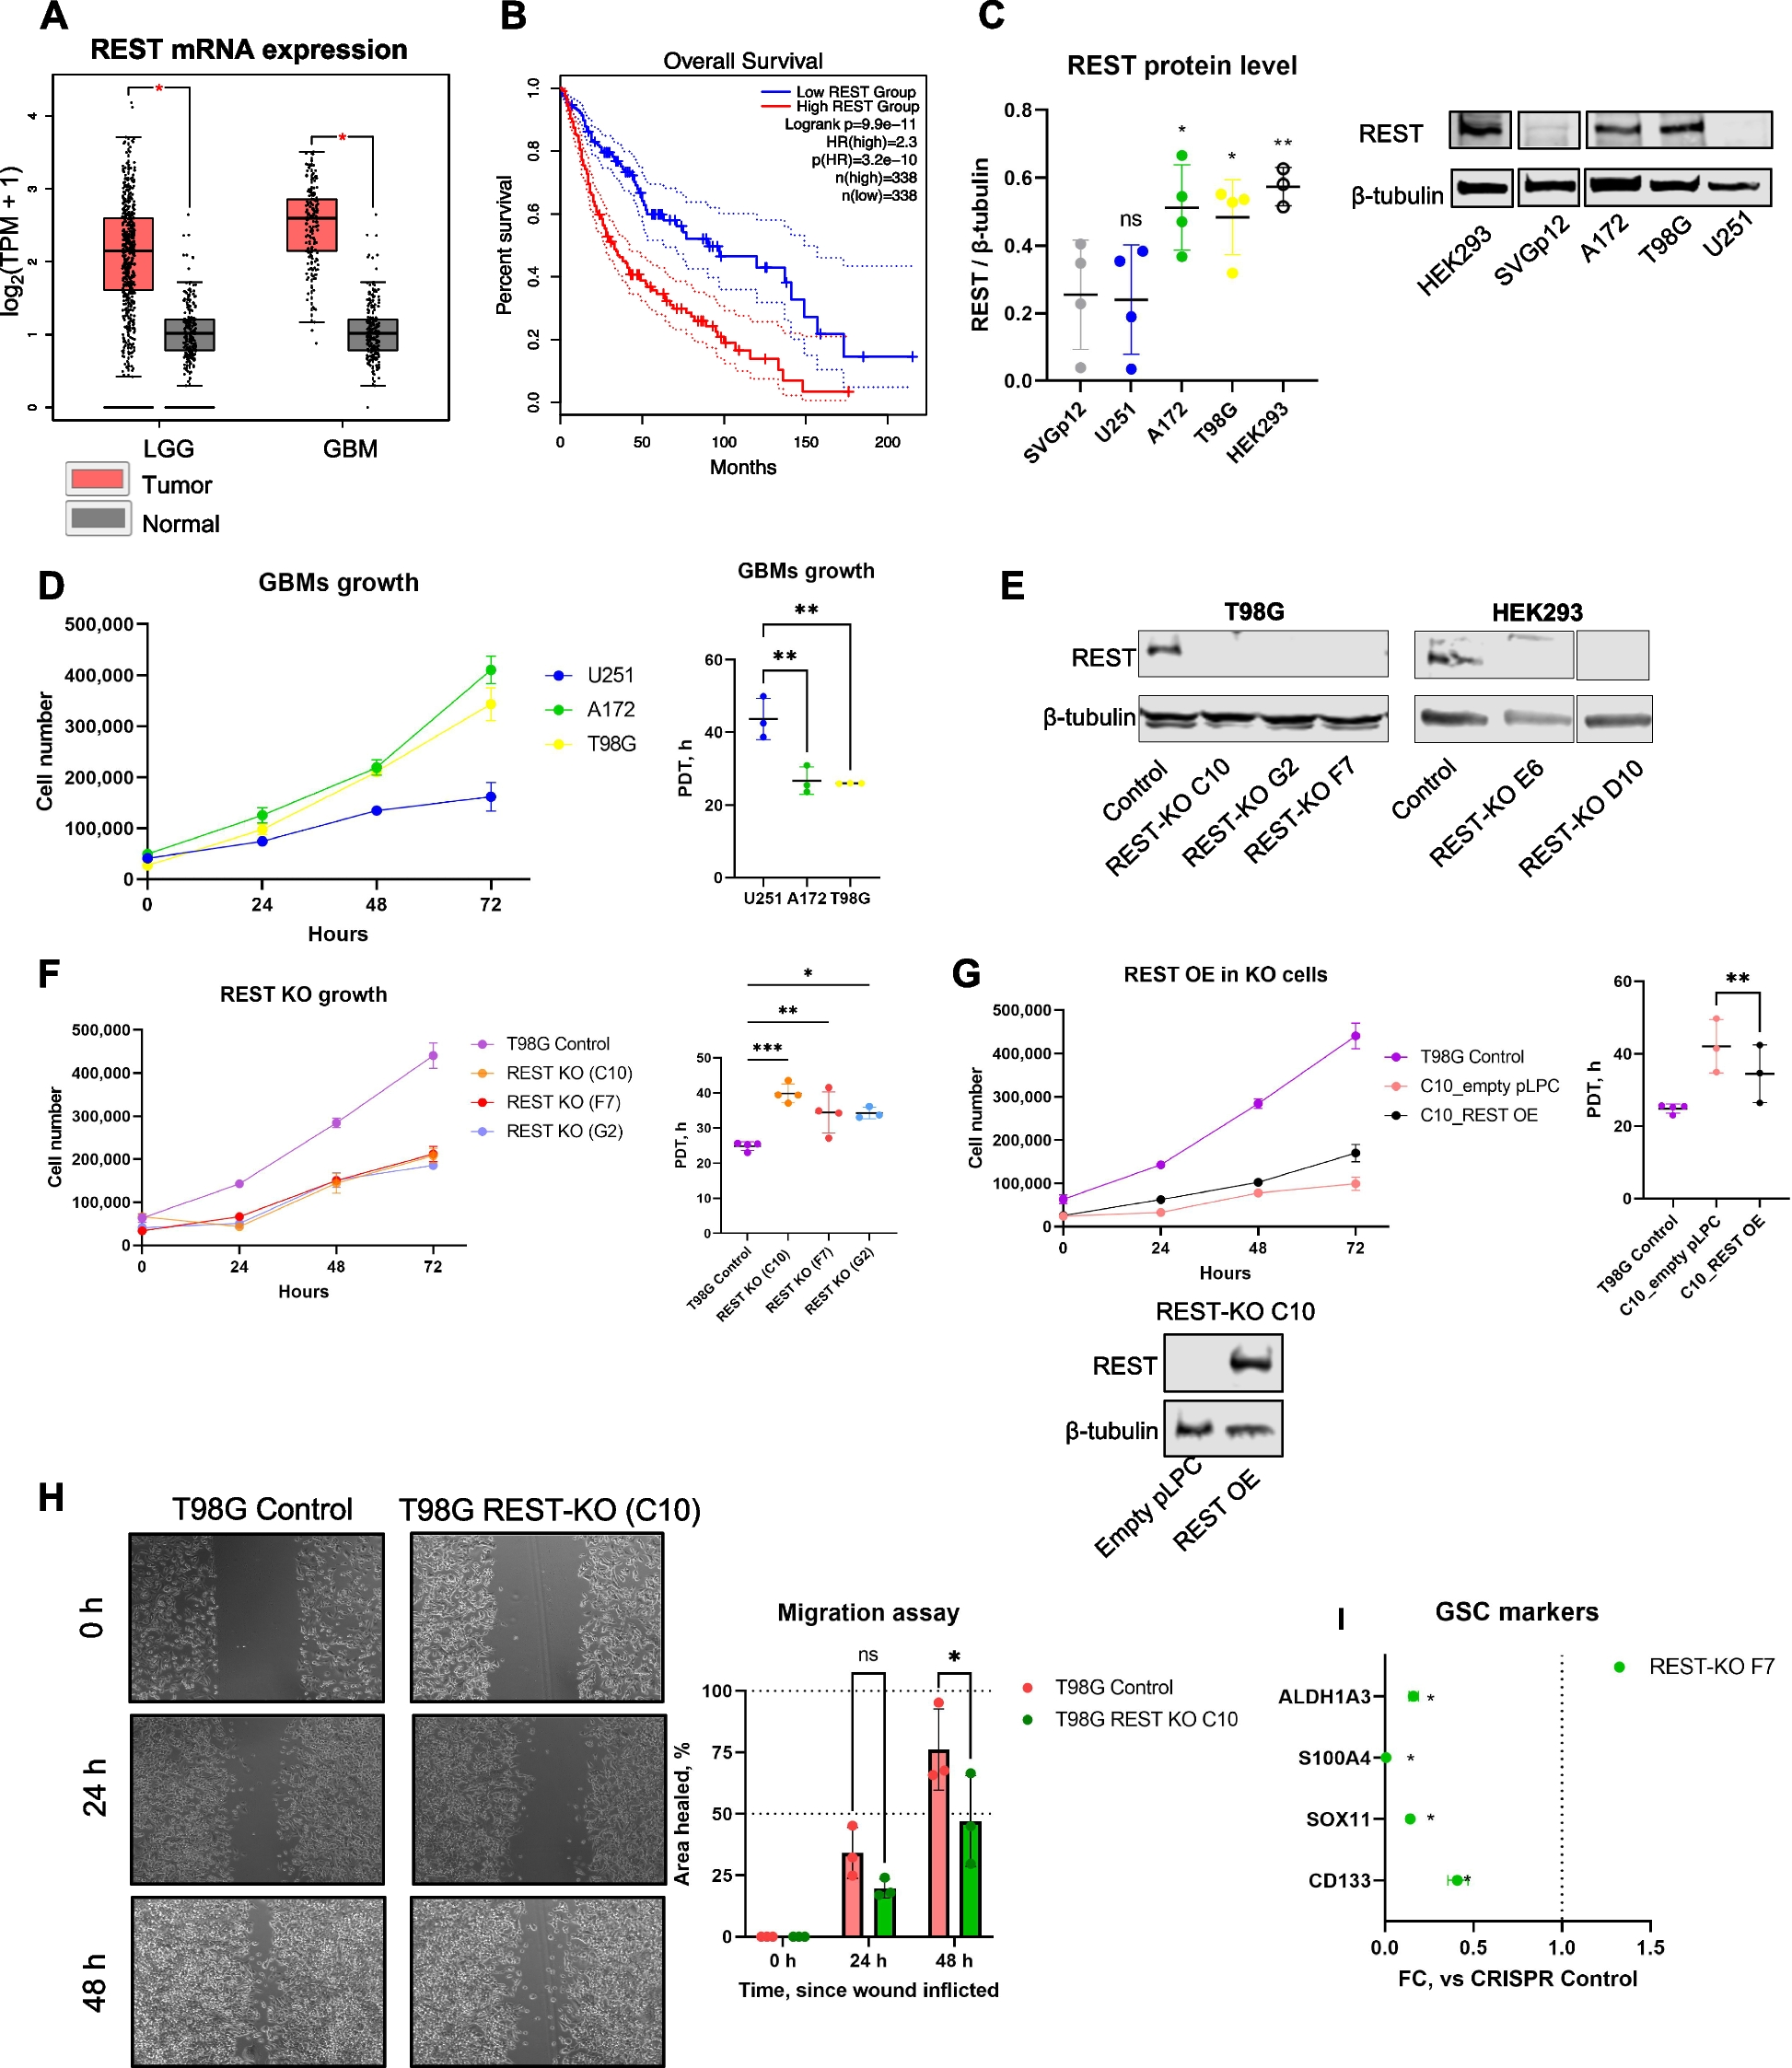
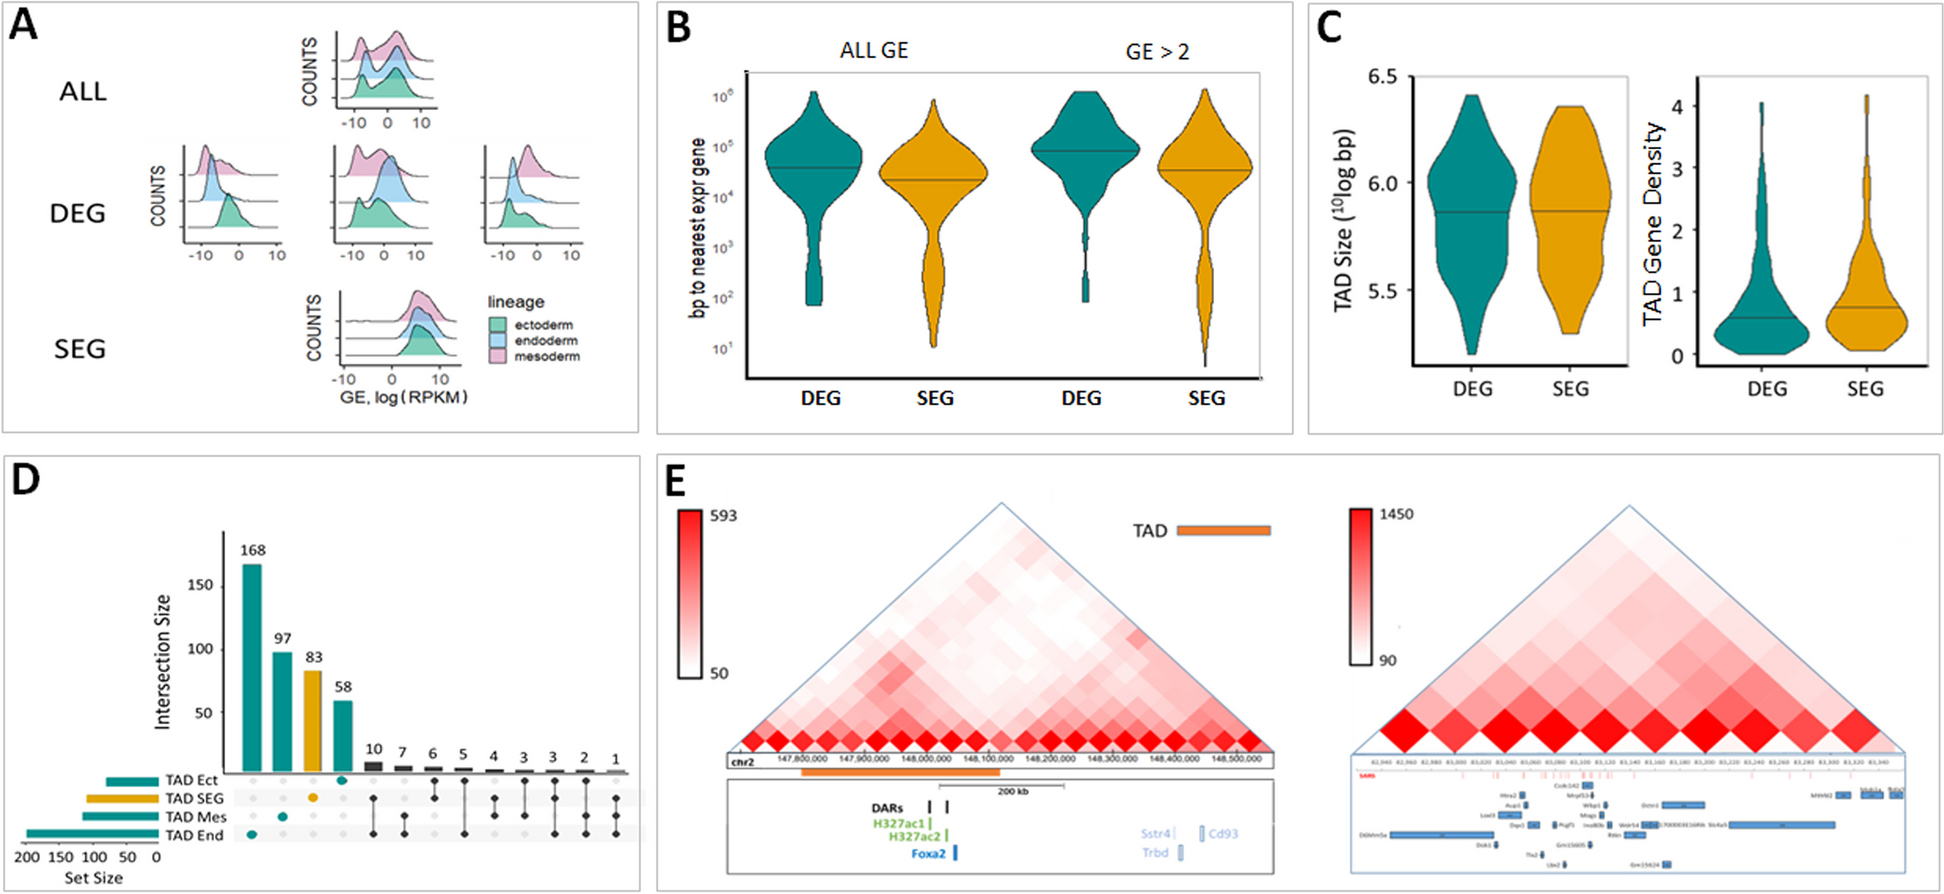
Discovery of whole-genome DMRs during liver regenerationRegenerative DMRs were determined by measuring DNA methylation levels of 2-m/o (A2) liver samples at 1d (A2R1), 2d (A2R2), and 4d (A2R4) post-PHx and comparing them to non-regenerative samples collected before the surgery (A2R0). Analyses of the WGBS data showed bisulfite conversion rates > 99% and an average tenfold coverage of the whole epigenome (Additional file 1: Fig. S1D). Raw DNA methylation data of all samples were deposited in the GEO database (GSE211999). The levels of DNA methylation for each PHx group (representing the average of four biological samples) were displayed in histograms (Fig. 3A). Compared to the baseline non-regenerative samples (A2R0), we identified 206/581 hyper/hypo-DMRs in 1d post-PHx livers (A2R1), 186/839 hyper/hypo-DMRs in 2d livers (A2R2), and 156/447 hyper/hypo-DMRs in 4d livers (A2R4) (Fig. 3B, Additional file 5: Table 3). Among those DMRs, there are 32/83 hyper/hypo-DMRs shared by the R1:R0 and R2:R0 groups, 38/91 hyper/hypo-DMRs shared by the R4:R0 and R1:R0 groups, 30/83 hyper/hypo-DMRs shared by the R4:R0 and R2:R0 groups, and 15/38 hyper/hypo-DMRs shared by all three (Fig. 3C, Additional file 6: Table 4). Hostspot analyses showed that the majority of regenerative DMRs (R2:R0) were found in genomic regions associated with gene structures (e.g., TSS and gBody) or repeat sequences (e.g., rsmk) (Fig. 3D). Two examples of regenerative hypo-DMRs were found in association with Sox9 and Errfi1. Regeneration decreased DNA methylation in the gBody (exon3) region of Sox9 (chr11:112,784,975–112,785,325) and in a region (chr4:150,871,175–150,871,499) located 2.3 kb downstream of the 3′-UTR of Errfi1 in liver samples collected at 1d, 2d, and 4d post-PHx compared to pre-PHx samples (Fig. 3E1). In consistence, Sox9 is up-regulated during liver regeneration [40, 41]. The role of Errfi1, also known as mitogen-induced gene 6 (mig-6), in liver regeneration is unclear but has been reported to be down-regualted in hepatocellular carcinoma [42]. Two examples of regenerative hyper-DMRs were found in association with Chrombox 6 (Cbx6) and A-kinase anchoring protein 5 (Akap5) (Fig. 3E2). Regeneration increased DNA methylation in the gBody (exon5) region of Cbx6 (chr15:79,828,706–79,828,923) and in the TSS (− 39 to − 17) region of Akap5 (chr12:76,324,852–76,324,874) at 1d, 2d, and 4d compared to 0d. Cbx6 is a transcription repressor, whose overexpression was shown to contribute to the progression of hepatocellular carcinoma, thus predicting a poor prognosis [43]. Akap5 was shown to regulate the activity of the vascular L-type Ca2+ channel in response to elevated glucose [44], but its function in liver regeneration remains unclear.
Fig. 3
Discovery and characterization of DMRs in regenerating livers by WGBS. A Histograms of CpG event frequencies categorized by their DNA methylation levels for three 2-m/o PHx groups (A2R1, A2R2, and A2R4), where the X-axis shows the DNA methylation level (from 0 to 100%) and the Y-axis shows the CpG event frequency. Each graph represents the average of four biological samples. B Heat maps of regenerative DMRs found in regenerating 2-m/o livers collected on 1d (A2R1), 2d (A2R2), and 4d (A2R4) after 70% partial hepatectomy (PHx) compared to baseline livers collected before the surgery (A2R0). Hyper-DMRs are listed on top of hypo-DMRs. C Venn diagrams of unique and overlapped hypo-DMRs and hyper-DMRs shared by the R1:R0 (red), R2:R0 (green), and/or R4:R0 (blue) groups. D Genomic distributions of regenerative DMRs by comparing A2R2 to A2R0 liver samples. E Genome-browser (TRACK) views displaying two regenerative hypo-DMRs associated with Sox9 and Errfi1 (E1) and two hyper-DMRs associated with Cbx6 and Akap5 (E2)
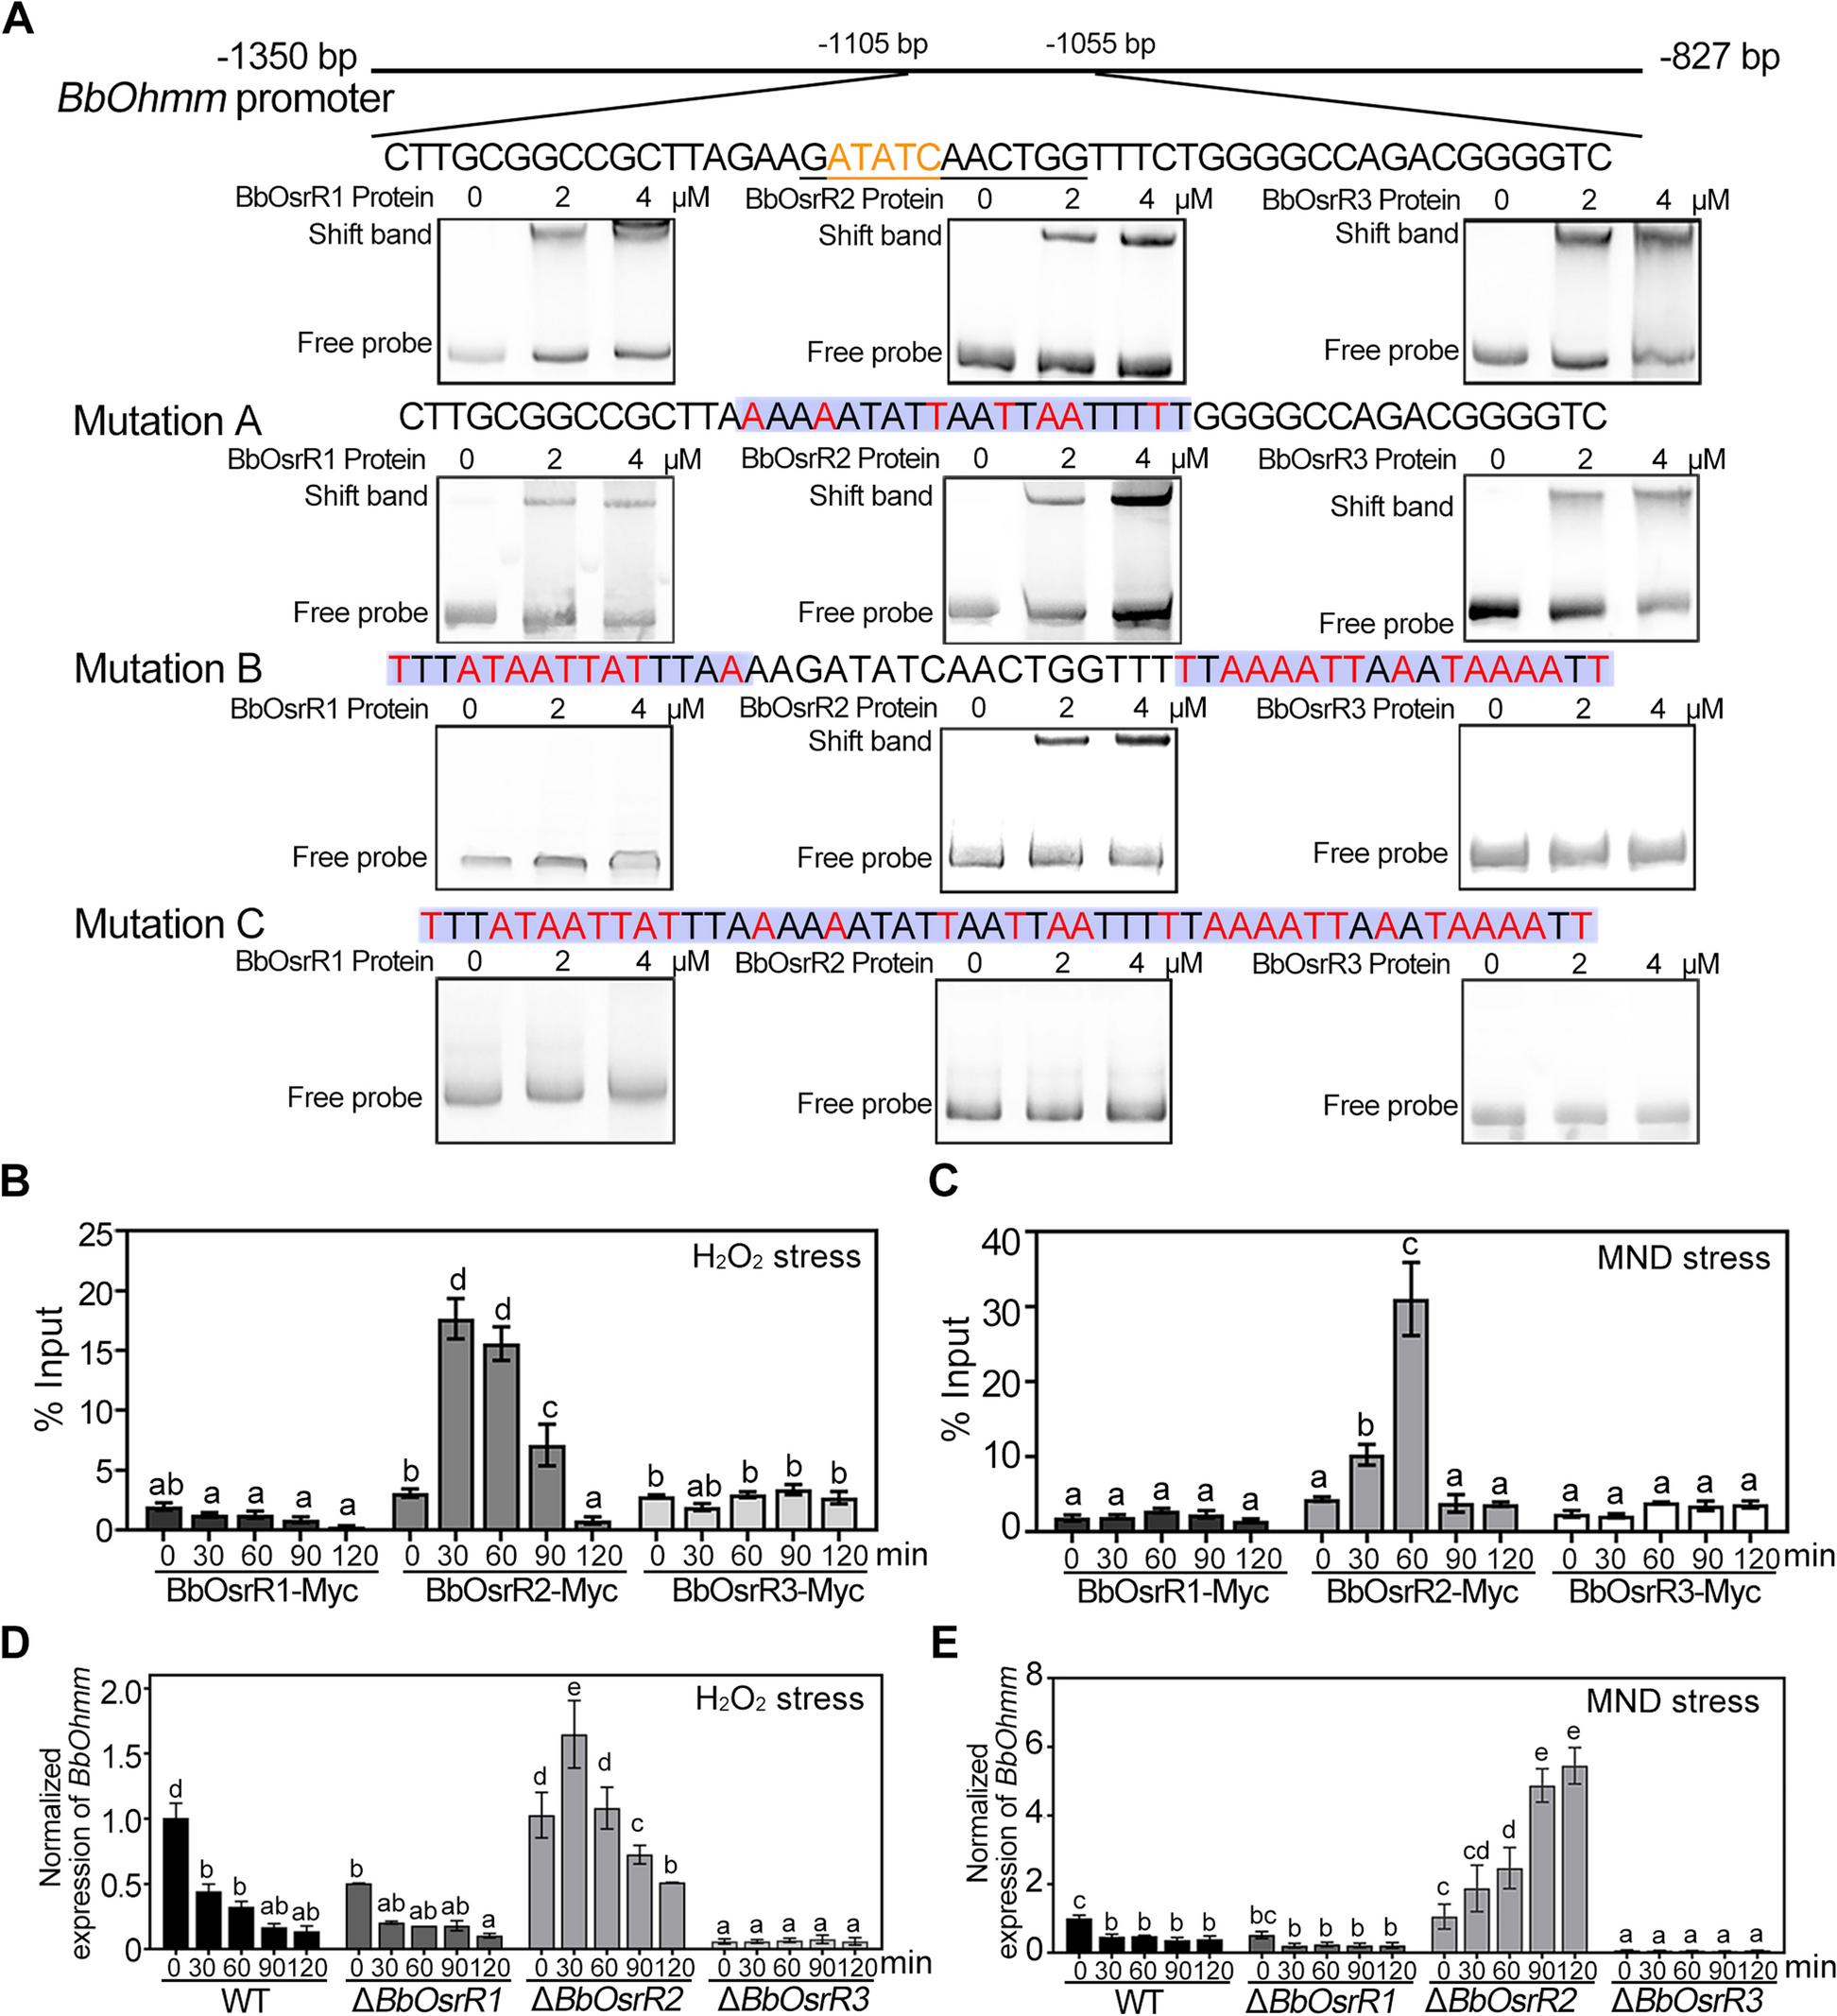
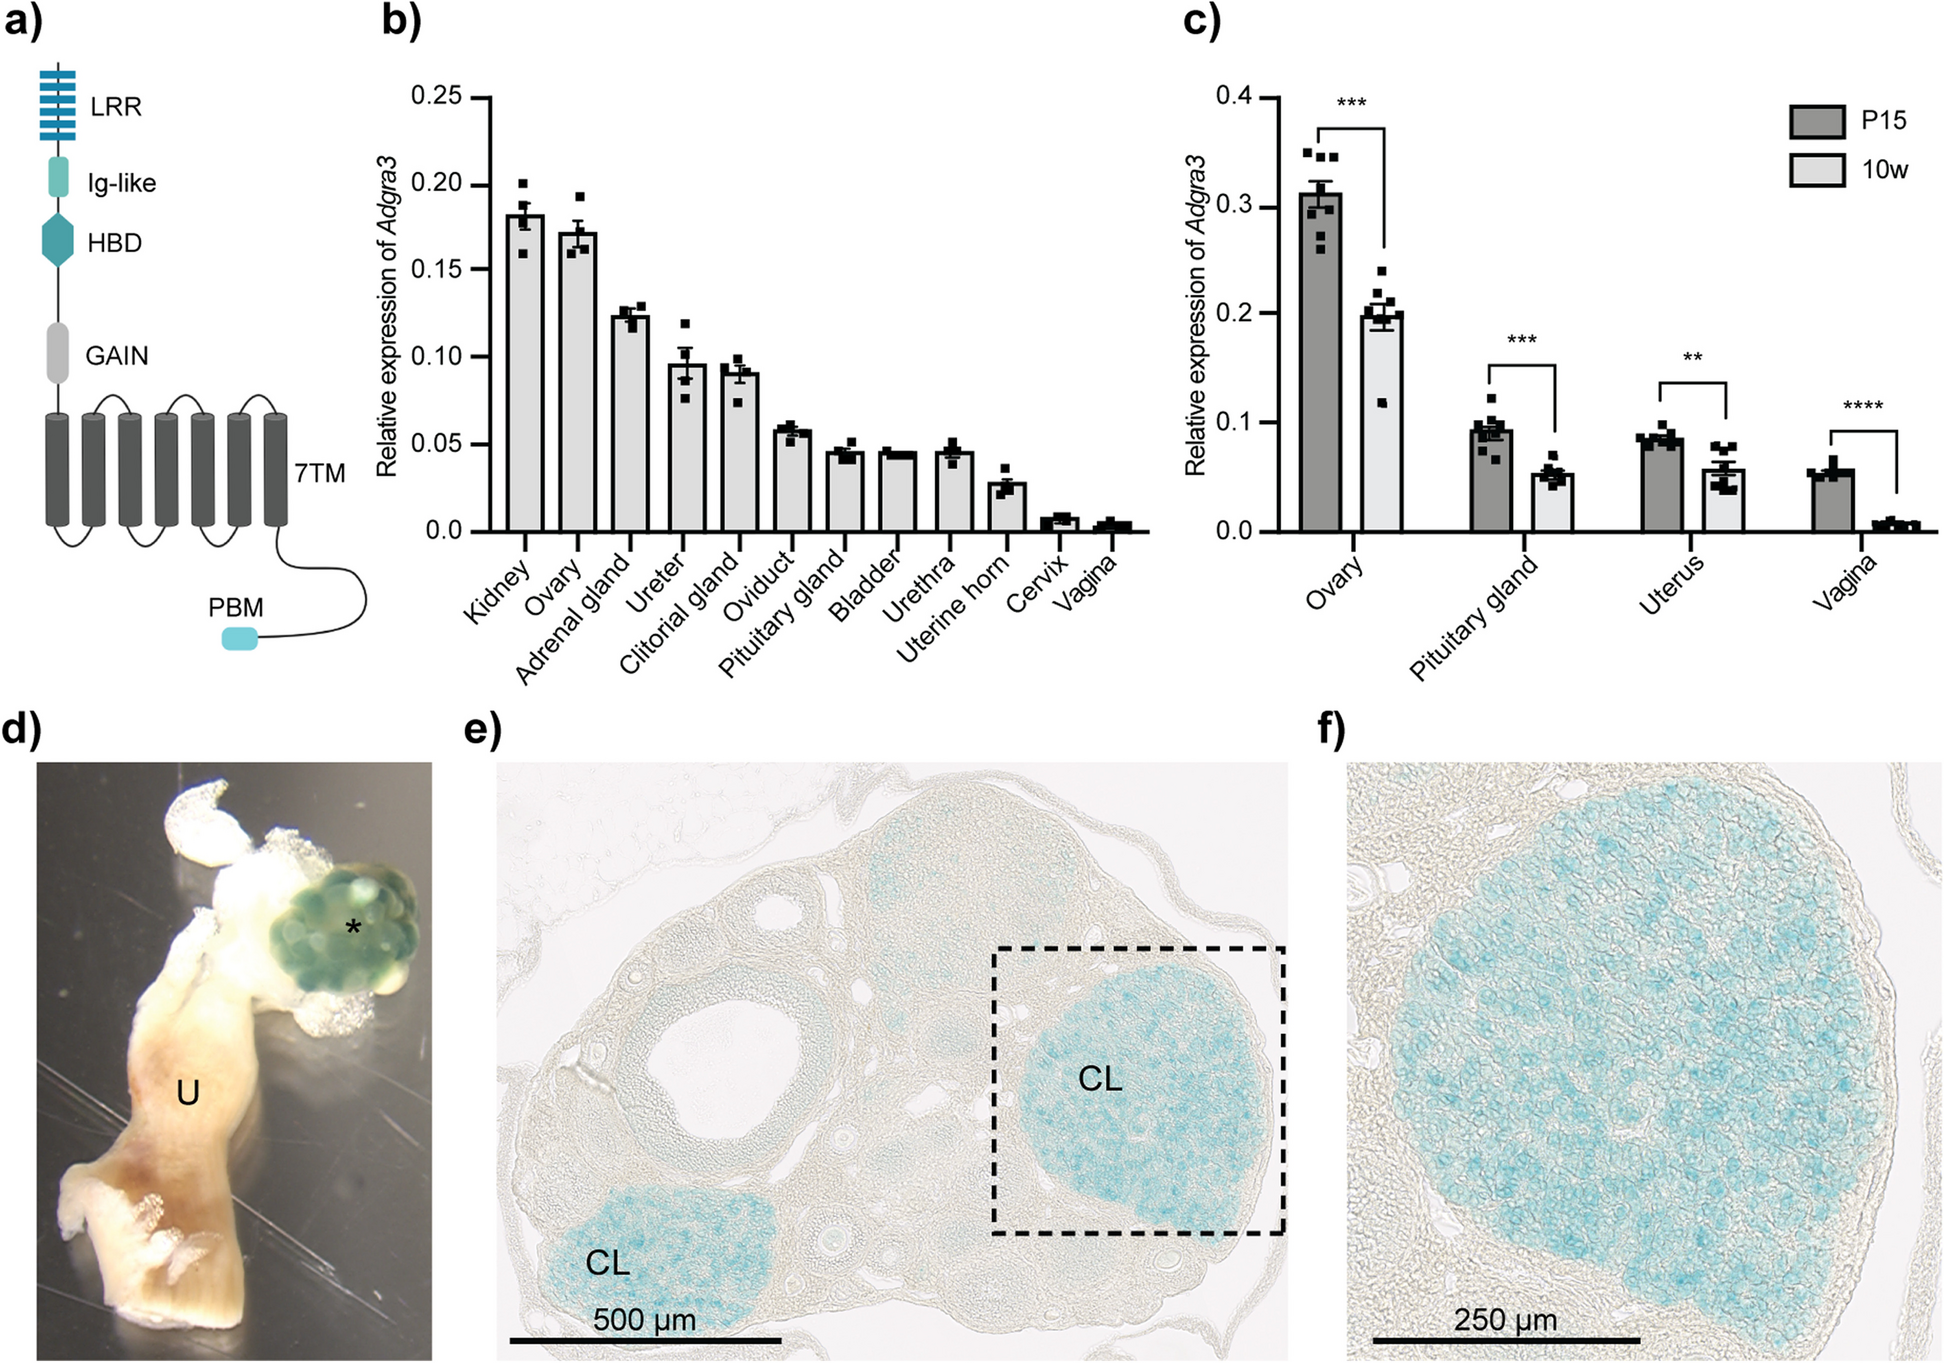
Mapping regenerative DMRs to the promoter regions of differentially expressed genes in regenerationTo identify regenerative DMRs with functional roles in regulating gene expression in response to PHx-induced liver regeneration, raw RNA-seq data were extracted from a GEO dataset (GSE125007) containing transcriptomic data of 8–12-w/o mouse livers before and after partial hepatectomy at 24 h (h), 30 h, 40 h, 48 h, 96 h, 7 days (d), and 4 weeks (w) [45]. RNA-seq data were analyzed and mapped to the mouse genome. Uniquely mapped reads were used to assemble the transcriptome and quantify gene expression levels with reads per kb per million (FPKM). DEGs were identified as those with corrected p values ≤ 0.05 and absolute fold changes ≥ 2. The numbers of up-regulated DEGs (up-DEGs) and down-regulated DEGs (down-DEGs) were within the range of 457–999 for the first 48 h post-PHx and began to drop after 96 h to 117–309 (Fig. 4A). We then mapped regenerative hypo-DMRs to the promoter regions (− 7 to + 3 kB of the TSS) of up-DEGs and hyper-DMRs to the promoter regions of down-DEGs. Forty-two hypo-DMRs (21 up-DEGs) and 30 hyper-DMRs (12 down-DEGs) were mapped in the R1:R0 paradigm. One hundred two hypo-DMRs (38 up-DEGs) and 38 hyper-DMRs (13 down-DEGs) were found in the R2:R0 paradigm. Twenty-five hypo-DMRs (13 up-DEGs) and 13 hyper-DMRs (6 down-DEGs) were found in the R4:R0 paradigm (Fig. 4B, Additional file 7: Table 5).
Fig. 4
Mapping of regenerative DMRs to differentially expressed genes (DEGs) during liver regeneration. A Heat maps of DEGs at different time points of liver regeneration after PHx. Numbers of up- (top, up) and down-regulated genes (bottom, dn) are indicated on the left. Hour (h), day (d), week (w). B Numbers of up-regulated DEGs (up-DEGs) mapped by regenerative hypo-DMRs and down-regulated DEGs (down-DEGs) mapped by regenerative hyper-DMRs in the R1:R0, R2:R0, and R4:R0 groups. Gene Set Enrichment Analysis (GSEA) showing pathways enriched in up-DEGs and down-DEGs mapped by regenerative hypo-DMRs and hyper-DMRs, respectively, in the R1:R0 (C), R2:R0 (D), and R4:R0 (E) paradigms. Abbreviations: H, hallmark; CP, canonical pathway; GO, gene ontology; FDR, false discovery rate; n1/n2, the number of DEGs enriched in specific pathways (n1) over the total number of query DEGs (excluding putative genes) (n2)
Fig. 5
Synchronous and inverse changes between aging and regenerative DMRs. (A1) Numbers of regenerative hypo-DMRs hypermethylated during aging (top) and hyper-DMRs hypomethylated during aging (bottom). (A2) Lists of genes mapped by age-inverse regenerative hypo-DMRs (upper panel) or hyper-DMRs (lower panel), their aging paradigms, and liver-related publications found by PubMed search. Six showed liver-related functions (L), with or without additional functions in regeneration (R) or aging (A). B1 Numbers of DMRs that are synchronously hypomethylated or hypermethylated during liver aging and regeneration. B2 Lists of Hallmark (H) and Gene Ontology (GO) pathways enriched in genes whose promoter regions were mapped by early (A8:A2) age-synchronous regenerative hypo-DMRs
Pathways enriched in the regenerative DMR-mapped DEGs were analyzed by GSEA using the Hallmark (H), Canonical Pathway (CP), and Gene Ontology (GO) gene set filters with FDR q-value cut-off set at < 0.05. All Hallmark-identified pathways, CP-identified pathways with ≥ 4 enriched genes, and GO-identified pathways with ≥ 5 enriched genes were listed (Fig. 4C–E). Pathways enriched in DMR-mapped DEGs were found more in the R2:R0 paradigm than in the R1:R0 or R4:R0 paradigm. Pathways enriched in R1:R0 hypo-DMR-mapped up-DEGs include those involved in immediate early responses (e.g., protein phosphorylation, receptor tyrosine kinase signaling, and immune), glycolysis, and ribonucleotide binding (Fig. 4C1), whereas pathways enriched in R1:R0 hyper-DMR-mapped down-DEGs include those involved in bile acid metabolism and adipogenesis (Fig. 4C2). Pathways enriched in hypo-DMR-mapped up-DEGs in the R2:R0 paradigm include those involved in cell proliferation, cell cycle regulation, tissue development/differentiation, early estrogen response, and KRAS signaling (Fig. 4D1), whereas pathways enriched in hyper-DMR-mapped down-DEGs in the R2:R0 paradigm include those involved in p53 response, hypoxia response, cell adhesion, and several other cell biological events (Fig. 4D2). There were only a few pathways enriched in hypo-DMR-mapped up-DEGs in the R4:R0 group, including those involved in mitotic spindle, KRAS UP, and Sertoli cell development/differentiation (Fig. 4E). No enriched pathway was found for down-DEGs mapped by the R4:R0 hyper-DMRs.
Analysis of regenerative DMRs showing age-dependent changesTo identify potential targets on which aging might regulate liver regeneration via the DNA methylation mechanism, we determined regions showing DNA methylation changes during liver aging and regeneration either in the same methylation (synchronous) direction (hyper/hyper and hypo/hypo) or in the inverse direction (hyper/hypo and hypo/hyper). Our primary focus was on the age-inverse regenerative DMRs, which might underlie the negative effect of aging on liver regeneration. We identified only 42 regenerative hypo-DMRs that were hypermethylated by aging and 11 regenerative hyper-DMRs that were hypomethylated during aging (Fig. 5A1, Additional file 8: Table 6). Those age-inverse regenerative DMRs were found predominantly in the A16:A8 group (n = 44) compared to the A8:A2 group (n = 6) but showed no preferential distribution among different regeneration groups (R1:R0, R2:R0, and R4:R0). This finding suggests that mid-to-late aging and regeneration may represent biologically opposite events. GREAT analyses of age-inverse regenerative DMRs found no enriched GO term. We then mapped those DMRs to the TSS (-7 k + 3 k) and gene regions and identified 22 genes associated with age-inverse regenerative DMRs (Additional file 9: Table 7). Seventeen genes were mapped by age-inverse regenerative hypo-DMRs, including 14 known genes, two predicted genes, and one pseudogene. Among the 10 known genes mapped by the mid-to-late aging-inverse regenerative DMRs, three genes are related to liver pathophysiology, including the epigenetic silencing of Duox1 by promoter hypermethylation in hepatocellular carcinoma (HCC) [46], Rap2c-mediated inactivation of pathological fibrosis [47], and the unique expression of a spliced variant of Rbbp7 in HCC [48] (Fig. 5A2, top). Five genes were mapped by the age-inverse regenerative hyper-DMRs, including Rspry1 (ring finger and SPRY domain containing 1), Gata6, and three predicted genes (Fig. 5A2, bottom). Gata6 was connected to liver regeneration. GSEA found no pathway enriched in those genes mapped by age-inverse regenerative hyper- or hypo-DMRs due to their low numbers.
The numbers of DMRs that were synchronously hypomethylated (n = 341) or hypermethylated (n = 230) during liver aging and regeneration were significantly higher compared to those changed inversely (Additional file 8: Table 6). Those age-synchronous regenerative DMRs were found predominantly in the A8:A2 (n = 284) or A16:A2 (n = 262) group compared to the A16:A8 paradigm (n = 25), suggesting that early aging and regeneration may represent biologically similar events but showed no preferential distribution among different regeneration groups (Fig. 5B1). GREAT analyses showed that age-synchronous regenerative hypo-DMRs were enriched in 2 GO terms of Biological Process (sex differentiation and smooth muscle cell differentiation), 3 GO terms of Molecular Function (RNA polymerase II repressing transcription factor binding, repressing transcription factor binding, and RNA polymerase II transcription factor binding), 2 GO terms of Mouse Phenotype (early eyelid opening and abnormal mucous gland morphology), and 32 GO terms of Human Phenotype. No GO term was found for age-synchronous regenerative hyper-DMRs. Regenerative hypo-DMRs and hyper-DMRs showing synchronous changes during early aging (2-to-8 m/o) were mapped to the promoter regions (− 7 to + 3 kB, TSS-7 k + 3 k) of 61 and 28 genes, respectively (Additional file 9: Table 7). Thirty-nine of the 61 hypo-DMR-associated genes and 18 of the 28 hyper-DMR-associated genes were analyzed by GSEA (Hallmark, CP, and GO). Eleven pathways were enriched in genes mapped by A8:A2 age-synchronous regenerative hypo-DMRs, four of which were growth-related (growth, response to growth, cell growth, and developmental growth) (Fig. 5B2). Thirteen genes were enriched in two or more of the 11 pathways, including Gata4, Sox9, Usp9x (ubiquitin specific peptidase 9 X-linked), Lgmn (legumain), Epb41l5 (erythrocyte membrane protein band 4.1 like 5), Gnas, Rbbp7 (RB binding protein 7), Grb10 (growth factor receptor bound protein 10), Peg10 (paternally expressed 10), Gjb2 (gap junction protein beta 2), Tat (tyrosine aminotransferase), Hnf4A (hepatocyte nuclear factor 4 alpha), and TF (transferrin). No pathway was found enriched in genes mapped by age-synchronous regenerative hyper-DMRs.
Age-dependent methylation on the promoter regions of regenerative DEGsTo determine if regenerative DEGs are differentially methylated during the aging process, we mapped early (2-to-8 m/o) and mid-to-late (8-to-16 m/o) aging DMRs to the promoter (TSS-7 k + 3 k) regions of regenerative DEGs (Fig. 6A, Additional file 10: Table 8). During 2-to-8 m/o, 28 and 29 hyper-DMRs were mapped to the promoter regions of up- and down-DEGs, respectively, and 27 and 47 hypo-DMRs were mapped to the promoter regions of up and down-DEGs, respectively. During 8-to-16 m/o, 18 and 20 hyper-DMRs were mapped to the promoter regions of up- and down-DEGs, and 35 and 38 hypo-DMRs were mapped to the promoter regions of up- and down-DEGs. Given that early and mid-to-late aging DMRs were related to biologically opposite events, regenerative DEGs that were synchronously mapped by early aging DMRs (i.e., hyper-DMRs to down-DEGs and hypo-DMRs to up-DEGs) but inversely mapped by mid-to-late aging DMRs (i.e., hyper-DMRs to up-DEGs and hypo-DMRs to down-DEGs) were most likely our targets of interest for the adverse effect of aging on liver regeneration. Regenerative down-DEGs mapped by early hyper-DMRs or mid-to-late hypo-DMRs were shown in Fig. 6B1. Two of them, Igfals (insulin like growth factor binding protein acid labile subunit) and Thrsp (thyroid hormone responsive), were mapped by both early hyper-DMRs and mid-to-late hypo-DMRs. Regenerative up-DEGs mapped by early hypo-DMRs or mid-to-late hyper-DMRs were shown in Fig. 6B2. Two of them, Sox9 and Kif4 (kinesin family member 4), were mapped by both early hypo-DMRs and mid-to-late hyper-DMRs. In contrast, no regenerative down-DEGs were mapped by both early hypo-DMRs and late hyper-DMRs, and no regenerative up-DEGs were mapped by both early hyper-DRMs and late hypo-DMRs.
Fig. 6
Regenerative DEGs inversely regulated by aging DMRs. A Numbers of regenerative up-DEGs and down-DEGs whose promoter regions were hypomethylated or hypermethylated during early (A8:A2) and mid-to-late (A16:A8) aging, respectively. Genes whose promoter regions were synchronously mapped by early aging DMRs and inversely mapped by mid-to-late aging DMRs were shaded in yellow for down-DEGs or green for up-DEGs and listed in (B1) and (B2), respectively. Genes regulated by both early and mid-to-late aging DMRs were bolded
Expression profiles of DMR-mapped genes during liver aging and regenerationTo validate some of the discoveries made in this study, expression profiles of lead DMR-mapped genes in liver aging and/or regeneration were measured by qRT-PCR. For the aging DMR-mapped genes listed in Fig. 2A, we confirmed that (1) c-Myc (mapped by an A16:A2 hyper-DMR) showed decreased expression in 16-m/o compared to 2-m/o livers; (2) Rai1 (mapped by an A8:A2 hyper-DMR) showed decreased expression in 8-m/o and 16-m/o livers compared to 2-m/o livers; and (3) Nceh1 (mapped a A16:A8 and A8:A2 hypo-DMR) showed increased expression in 8-m/o and 16-m/o livers compared to 2-m/o livers (Fig. 7A). GSK3β showed no difference in expression during liver aging despite that it was mapped by an A8:A2 hypo-DMR. For the regenerative DMR-mapped genes listed in Fig. 3E, we confirmed that (1) Sox9 (mapped by a R1/2/4:R0 hypo-DMR) showed increased expression in 4d compared to 0d, 1d, and 2d livers and (2) Cbx6 (mapped by a R1/2/4:R0 hyper-DMR) showed decreased expression in 1d (post-PHx) compared to 0d (pre-PHx) livers, with increasing expression on 2d, 4d, and 7d compared to 1d (Fig. 7B). In contrast, Errfi1 (mapped by a R2/4:R0 hypo-DMR) showed decreased expression in 2d compared to 0d livers. Akap5 expression showed no significant changes after PHx (data not shown). For the genes associated with mid-to-late age-inverse regenerative DMRs (see Fig. 5A2), Rap2c showed increased expression in 4d compared to 0d livers, supporting its association with a R1/4:R0 hypo-DMR (Fig. 7C1). During aging, Rap2c showed decreased expression in 8-m/o compared to 2-/mo livers, but its DMR pattern was somewhat complex, being mapped by one hyper/hypo-DMR and another hypo/hyper-DMR during early/mid-to-late aging. Rspry1 showed decreased expression in PHx 1d and 2d compared to 0d livers, consistent with its association with a R1:R0 hyper-DMR, but it also displayed decreased expression in 8-m/o and 16-m/o compared to 2-m/o livers, which was at odds with its association with an A16:A8 hypo-DMR on the same site (Fig. 7C2). For the regenerative DEGs mapped by early-late aging inverse DMRs (see Fig. 6B), Thrsp1, which was mapped by an A8:A2 hyper- and A16:A8 hypo-DMR, was significantly upregulated in 8-m/o and 16-m/o livers compared to 2-m/o livers and was significantly downregulated after PHx as early as 1d (Fig. 7C3). Kif4, which was mapped by an A8:A2 hypo- and A16:A8 hyper-DMR, was downregulated in 16-m/o livers compared to 2-m/o and 8-m/o livers and was significantly upregulated after PHx as early as 1d and most prominently on 2d (Fig. 7C4).
Fig. 7
Expression profiles of DMR-mapped genes during liver aging and/or regeneration. A Expression of aging DMR-mapped c-Myc, Rai1, GSK3β, and Nceh1 in 2, 8, and 16-m/o livers by qRT-PCR, indicated by light grey, dark grey, and black bars, respectively. B Expression of regenerative DMR-mapped Cbx6, Sox9, and Errf1 in 2-m/o livers after PHx. C Expression profiles of two genes mapped by age-inverse regenerative DMRs (C1, C2) and two DEGs mapped by early-late aging inverse DMRs (C3, C4). D1 Regeneration of 2-m/o and 16-m/o livers, measured by the ratio of dissected liver mass (for 0d) or remaining liver mass (for 1d, 2d, and 4d) to body weight. (D2) Regeneration of 2-m/o and 16-m/o livers, measured by the numbers of Ki67 + cells per high-power field (HPF = 0.126 mm.2). E Expression profiles of Sox9, Rap2c, Thrsp, Rspry1, and Kif4 in response to PHx at 16 m/o. Expression levels were normalized against that of Rplp0 as an internal reference and compared to their respective baseline (0d) or 2-m/o baseline (for E5) samples. Bars represent means (± s.e.m.) of six biological replicates with two technical repeats each (n = 12) in reference to the Rplp0 level of the same sample. *p < 0.05; **p < 0.01; ***p < 0.001
Next, we determined how the genes cross-regulated by aging and regeneration reacted to PHx at 16 m/o. To demonstrate that the regenerative capacity of mouse livers was indeed compromised at 16 m/o compared to 2 m/o, we measured the restored mass and mitotic activity of the remaining liver. The dissected liver mass on 0d pre-PHx and the remaining liver mass on 1d, 2d, and 4d post-PHx were measured and expressed as ratios to their respective body weights in percentages. Our results showed that the recovery of liver mass was significantly reduced in 16-m/o livers compared to 2-m/o livers on 2d (n = 11, 6) and 4d post-PHx (n = 4, 7) (Fig. 7D1). The mitotic activity, measured by the abundance of Ki67 cells per high-power field (HPF = 0.126 mm2), was also lower in 16-m/o livers (n = 7) compared to 2-m/o livers (n = 5) on 2d post-PHx (p = 0.07) (Fig. 7D2). In response to PHx, we found that aging had a noticeable effect on reducing the levels of Sox9, most significantly on 2d (Fig. 7E1), as well as delaying the upregulation of Rap2c from 4 to 7d (Fig. 7E2). Conversely, the level of Thrsp, although still suppressed during PHx-induced regeneration, was significantly elevated on 7d in 16-m/o compared to 2-m/o livers (Fig. 7E3). Although the baseline expression level of Rspry1 were reduced by ~ 40% at 16 m/o compared to 2 m/o, its PHx-induced expression changes remained the same proportionally (Fig. 7E4). Finally, the expression of Kif4 in 16-m/o livers was reduced by 60% before PHx (Fig. 7C4) but was upregulated to the same level on 1d, 2d, and 7d or even to a higher level on 4d post-PHx compared to 2-m/o livers (Fig. 7E5).
Expression of DNA (hydroxy)methylation enzymes during liver regeneration and agingLastly, we determined the changes in DNA (de)methylation enzyme expression during liver aging and regeneration. DNA methylation is catalyzed by one conservative DNA methyltransferase, Dnmt1, and two de novo DNA methyltransferases, Dnmt3a and Dnmt3b [49]. Conversely, active demethylation of methylated cytosine involves hydroxymethylation steps catalyzed by three Ten-eleven translocation (Tet) enzymes, Tet 1, Tet 2, and Tet 3. qRT-PCR assays were performed on 2-m/o liver samples collected before (0d) and after PHx at the 1d, 2d, 4d, and 7d time points. Our results showed that PHx-induced liver regeneration significantly increased the expression of Dnmt1 (up to fourfold) and Dnmt3b (up to ninefold) but only minimally increased Dnmt3a expression (up to 1.5-fold) (Fig. 8A1). The increase of Dnmt3b occurred shortly after PHx (1-2d) and continued for 7d, whereas the increase of Dnmt1 peaked at 2d and declined afterwards. Dnmt3a up-regulation appeared as a later and lesser event (2-7d). Compared to Dnmt1 and Dnmt3b, increased expression of Tet2 and Tet3 also occurred to a much lesser extent (~ twofold) and at later time points (4–7d) (Fig. 8A2). The level of Tet1 transcript in the liver, before and after regeneration, was too low to be reliably quantified. We next determined how aging might affect their expression in the liver. First, we compared their baseline expression levels between 2-m/o and 16-m/o livers and found that aging significantly decreases the expression of Dnmt3b and had no effect on Dnmt1, Dnmt3a, Tet2, or Tet3 (Fig. 8B). Next, we determined how aging affected the response of those enzymes to PHx-induced regeneration in 16-m/o livers. We found that aging had a noticeable effect on the PHx-induced expression of all five enzymes (Fig. 8C). Upregulation of Dnmt1 was diminished, and upregulation of Dnmt3b was completely abolished (Fig. 8C1). In 16-m/o livers, Dnmt3a, Tet2, and Tet 3 were downregulated at 1d and/or 2d after PHx and slowly returned to pre-surgical levels afterwards (Fig. 8C).
Fig. 8
Changes in DNA (hydroxy)methylation enzyme expression during liver regeneration and aging. A Expression of Dnmts (A1) and Tets (A2) in 2-m/o mouse livers before (0d) and after PHx at 1d, 2d, 4d, and 7d by qRT-PCR. B Expression of Dnmts and Tets in 2-m/o (grey bars) and 16-m/o (black bars) livers. C Expression of Dnmts (C1) and Tets (C2) in 16-m/o livers before (0d) or after PHx (1d, 2d, 4d, and 7d). Expression levels were normalized against that of Rplp0 as an internal reference and compared to their respective baseline (0d) samples set arbitrarily as 100%. Bars represent means (± s.e.m.) of six biological replicates with two technical repeats (n = 12). *p < 0.05; **p < 0.01; ***p < 0.001
留言 (0)