Protocol and registration
This protocol has been registered within the International Prospective Register of Systematic Reviews (PROSPERO; registration number: CRD42022298570) [17]. This protocol was written according to the guidelines of the Preferred Reporting Items for Systematic Reviews and Meta-Analyses Protocols (PRISMA-P) [18]. We also adhered to the recommendations of Meta-analysis of Observational Studies in Epidemiology (MOOSE) [19]. The PRISMA-P checklist is given in Additional file 1. Any amendments to this protocol will be documented and published alongside the results of the systematic review.
Eligibility criteriaInclusion criteria
Studies will be included if they (1) were observational studies evaluating mobility in apparently healthy community-dwelling older adults (≥ 60 years), (2) described an association between any of the sociodemographic variables and walking parameters identified in this study, (3) were published between 1946 and 28 February 2023, and (4) were published in the English language only. (5) There will be no restriction regarding publication country, race, and gender. To be included in the meta-analysis part of the study, a study should provide the zero-order associations or partial correlation between sociodemographic factors and walking parameters or provide sufficient information for these associations (effect sizes) to be calculated and transformed into odds ratios [20].
Exclusion criteria
Studies will be excluded if focused on older adults (1) that were non-ambulatory, (2) with cardiopulmonary, cognitive, or neuromuscular diseases such as disabling stroke, parkinsonism, Alzheimer’s disease, dementia, or chronic obstructive pulmonary disease, (3) residing in an institutionalised or continuing care facility, and (4) if the data is overlapping or a duplicate of an already included study (we will choose the article with least risk of bias and most recent publication date).
Outcome measures
The outcomes will be walking distance, time, and speed measured with performance-based tests (PBTs) such as TUG, SPPB, 6MWT, UG, HGS, 10MWT, and BW [1]. Walking distance is defined as the distance (metres) covered during a timed walking test (e.g. 6MWT); walking time is the time taken (seconds) to complete a specific distance (e.g. 10MWT); and walking speed is defined as walk distance divide by walk time (m/s, e.g. HGS test).
Information sources
Following Bramer and colleagues’ recommendation on electronic search databases combination [20], we intend to search Ovid MEDLINE, Web of Science, Ovid EMBASE, EBSCO CINAHL, EBSCO AgeLine, and EBSCO SPORTDiscus from inception to 28 February 2023. A draft MEDLINE search strategy developed by the subject librarian and the primary investigator was provided in Additional file 2.
Search strategy development
Search terms were identified through consultations between the primary investigator, content experts, and the librarian, and a review of the titles and abstracts of six seed articles gathered by the primary investigator [10,11,12,13,14,15]. Elements of search strings developed for previously published reviews also informed the search strategy development [21,22,23].
The draft MEDLINE search strategy will be peer-reviewed by another librarian who is not part of this review and comments will be addressed. Afterwards, the search strategy will be translated into different syntaxes recognised by each database. Subject headings (e.g. MeSH), Boolean operators, proximity operators, truncation, and phrase searching will be used appropriately as shown in Additional file 2.
Data management
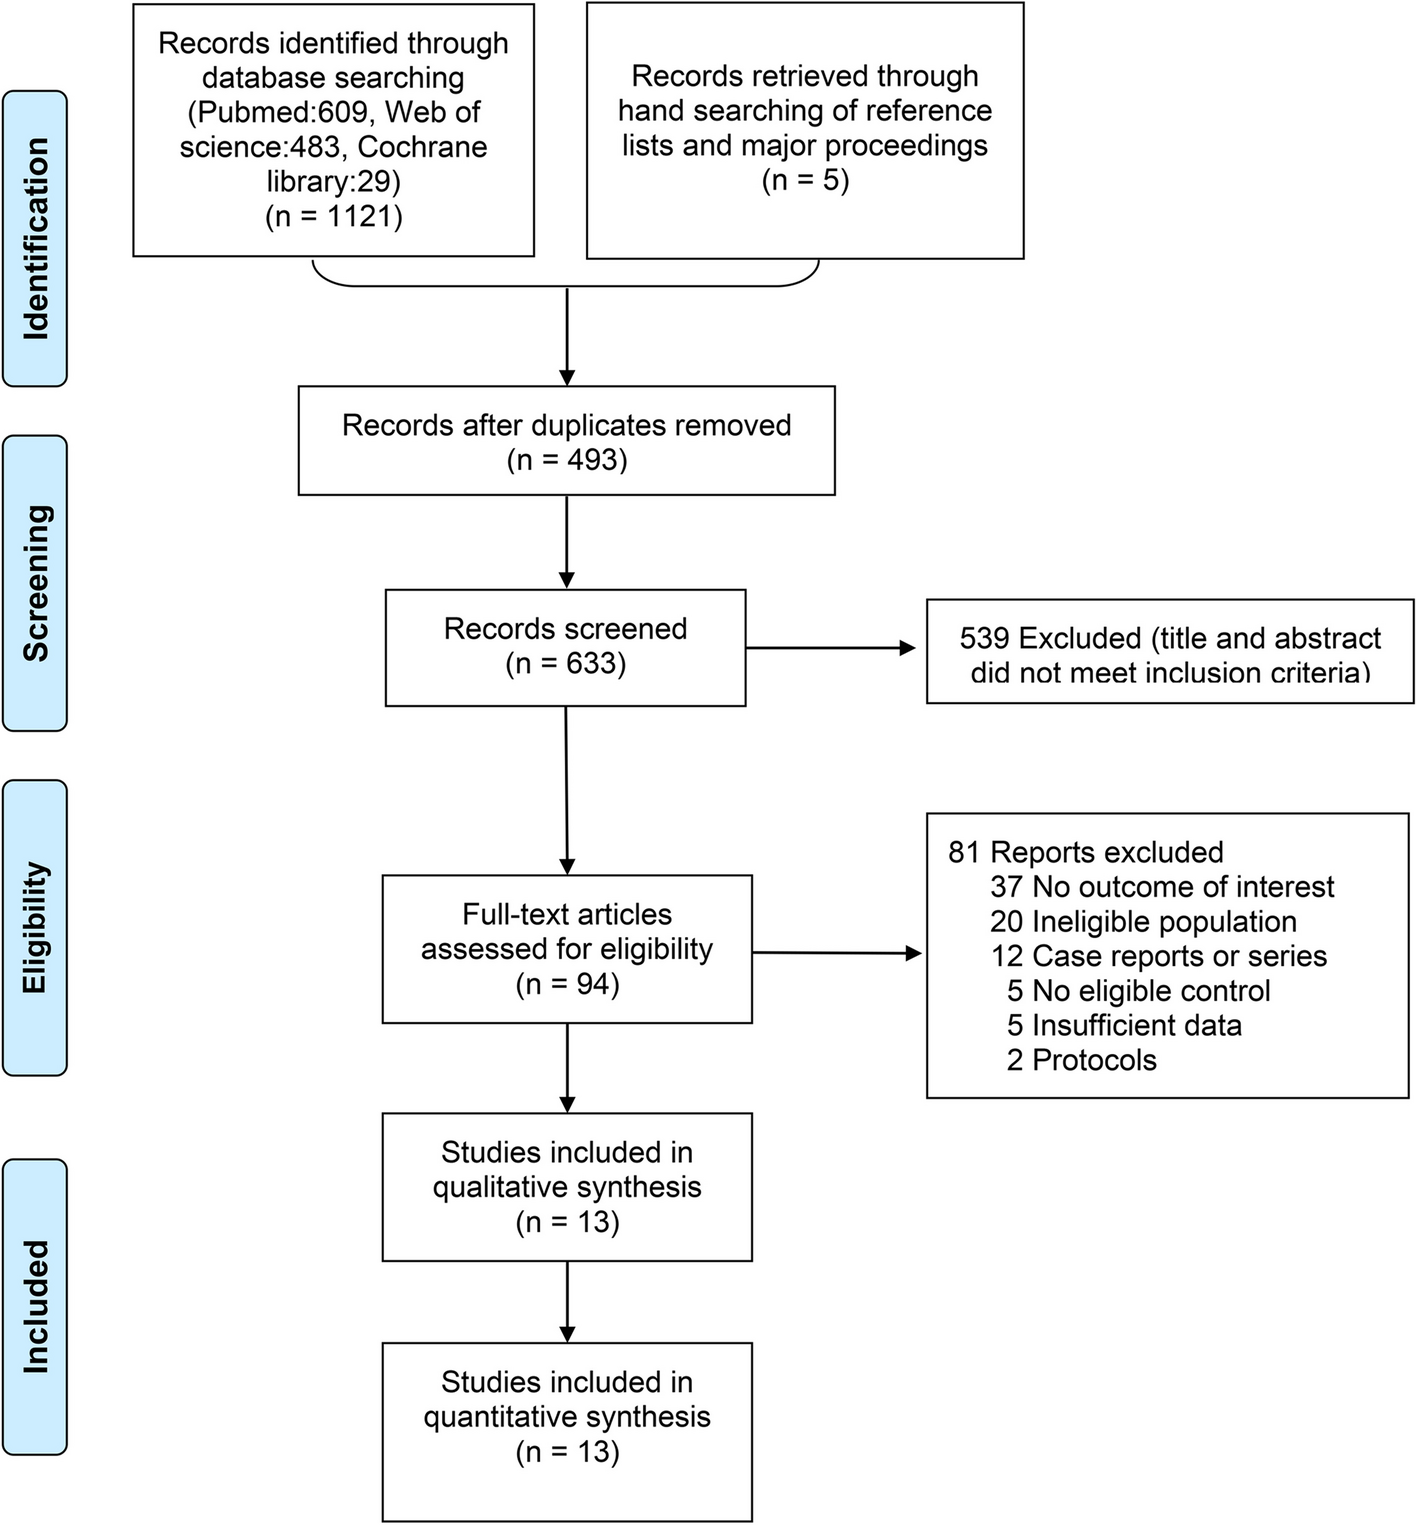
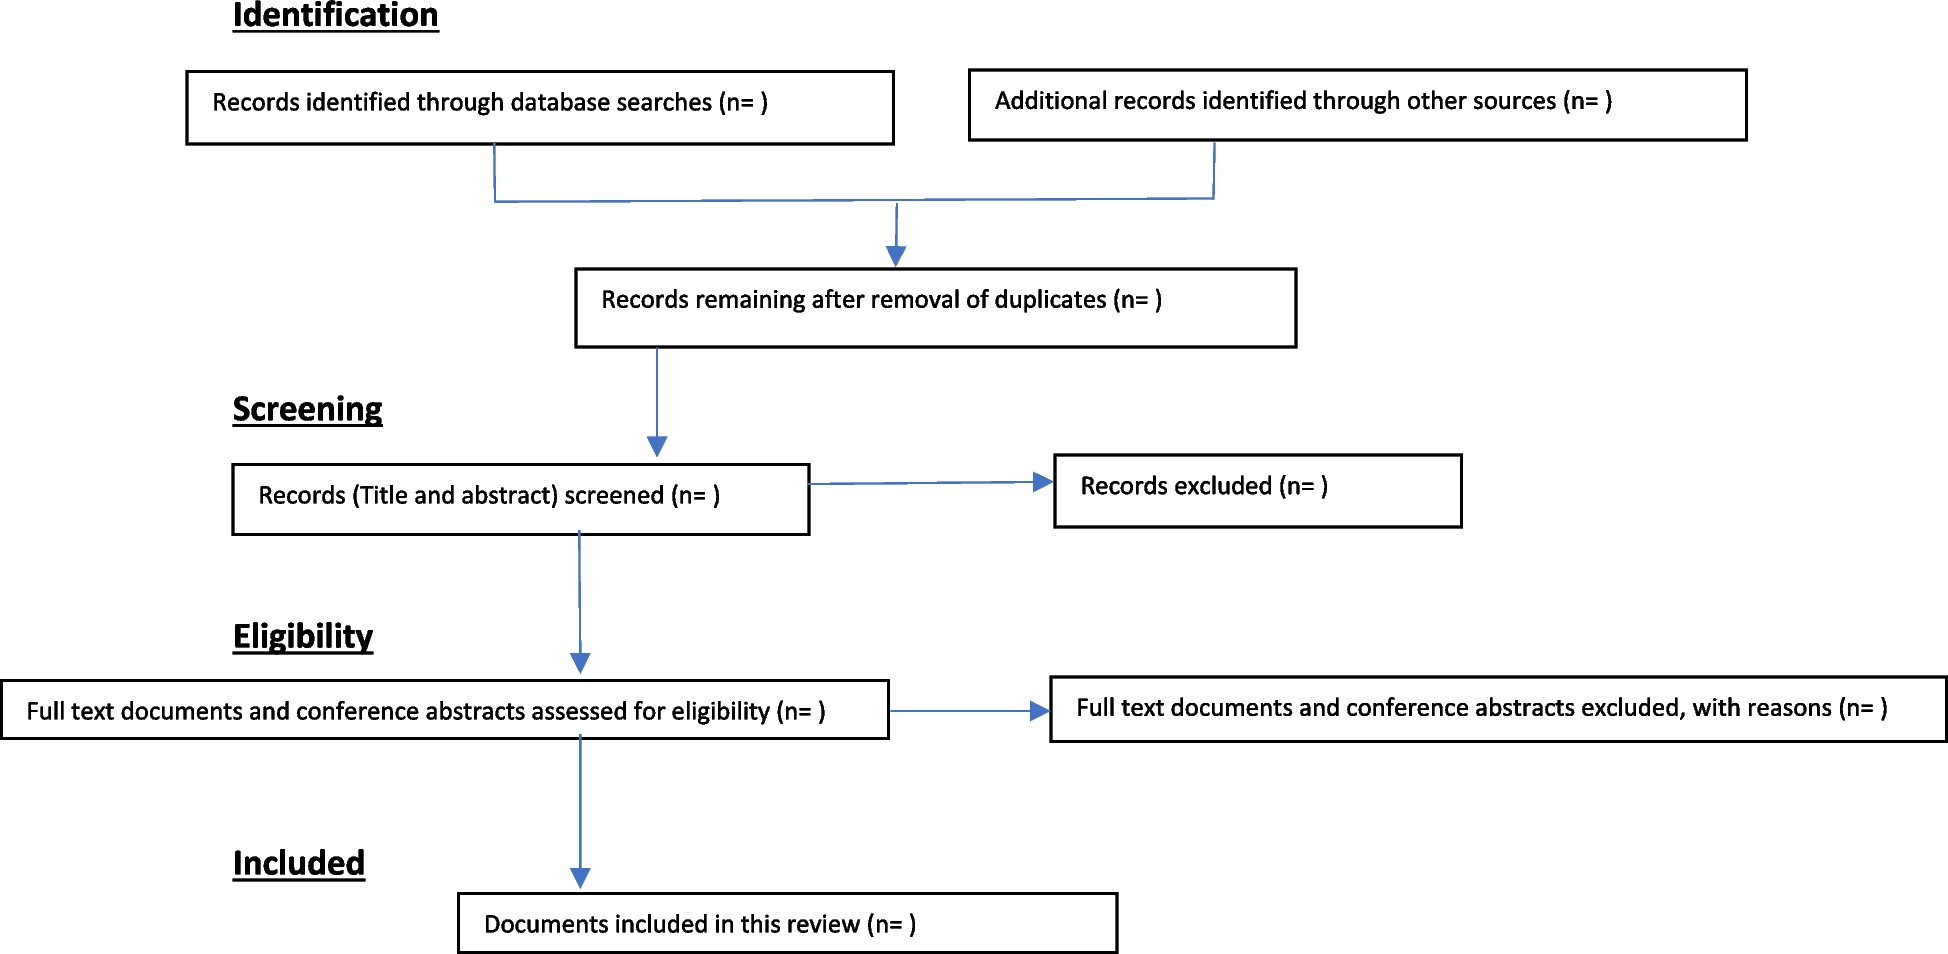
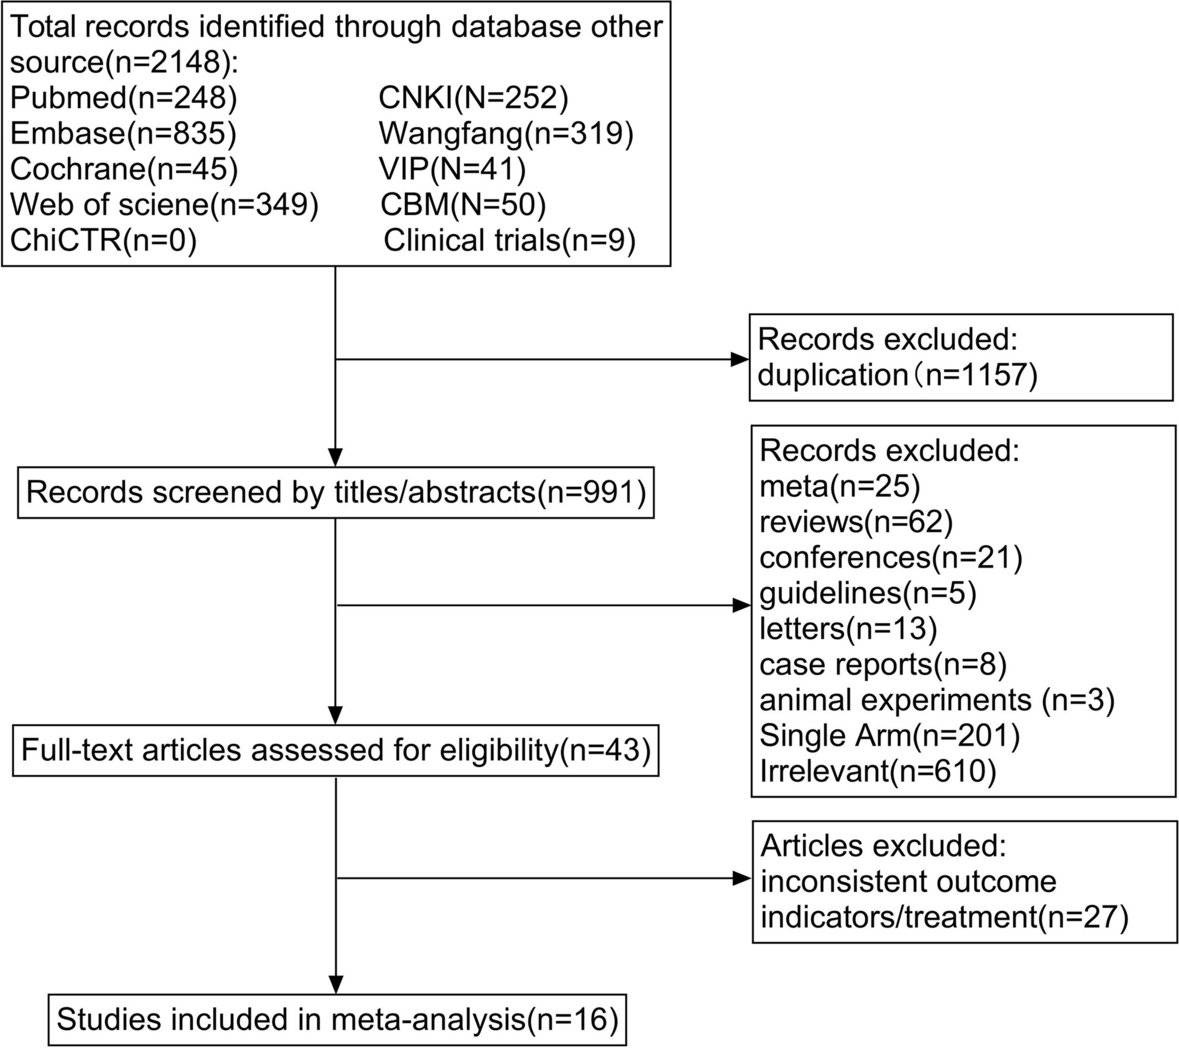
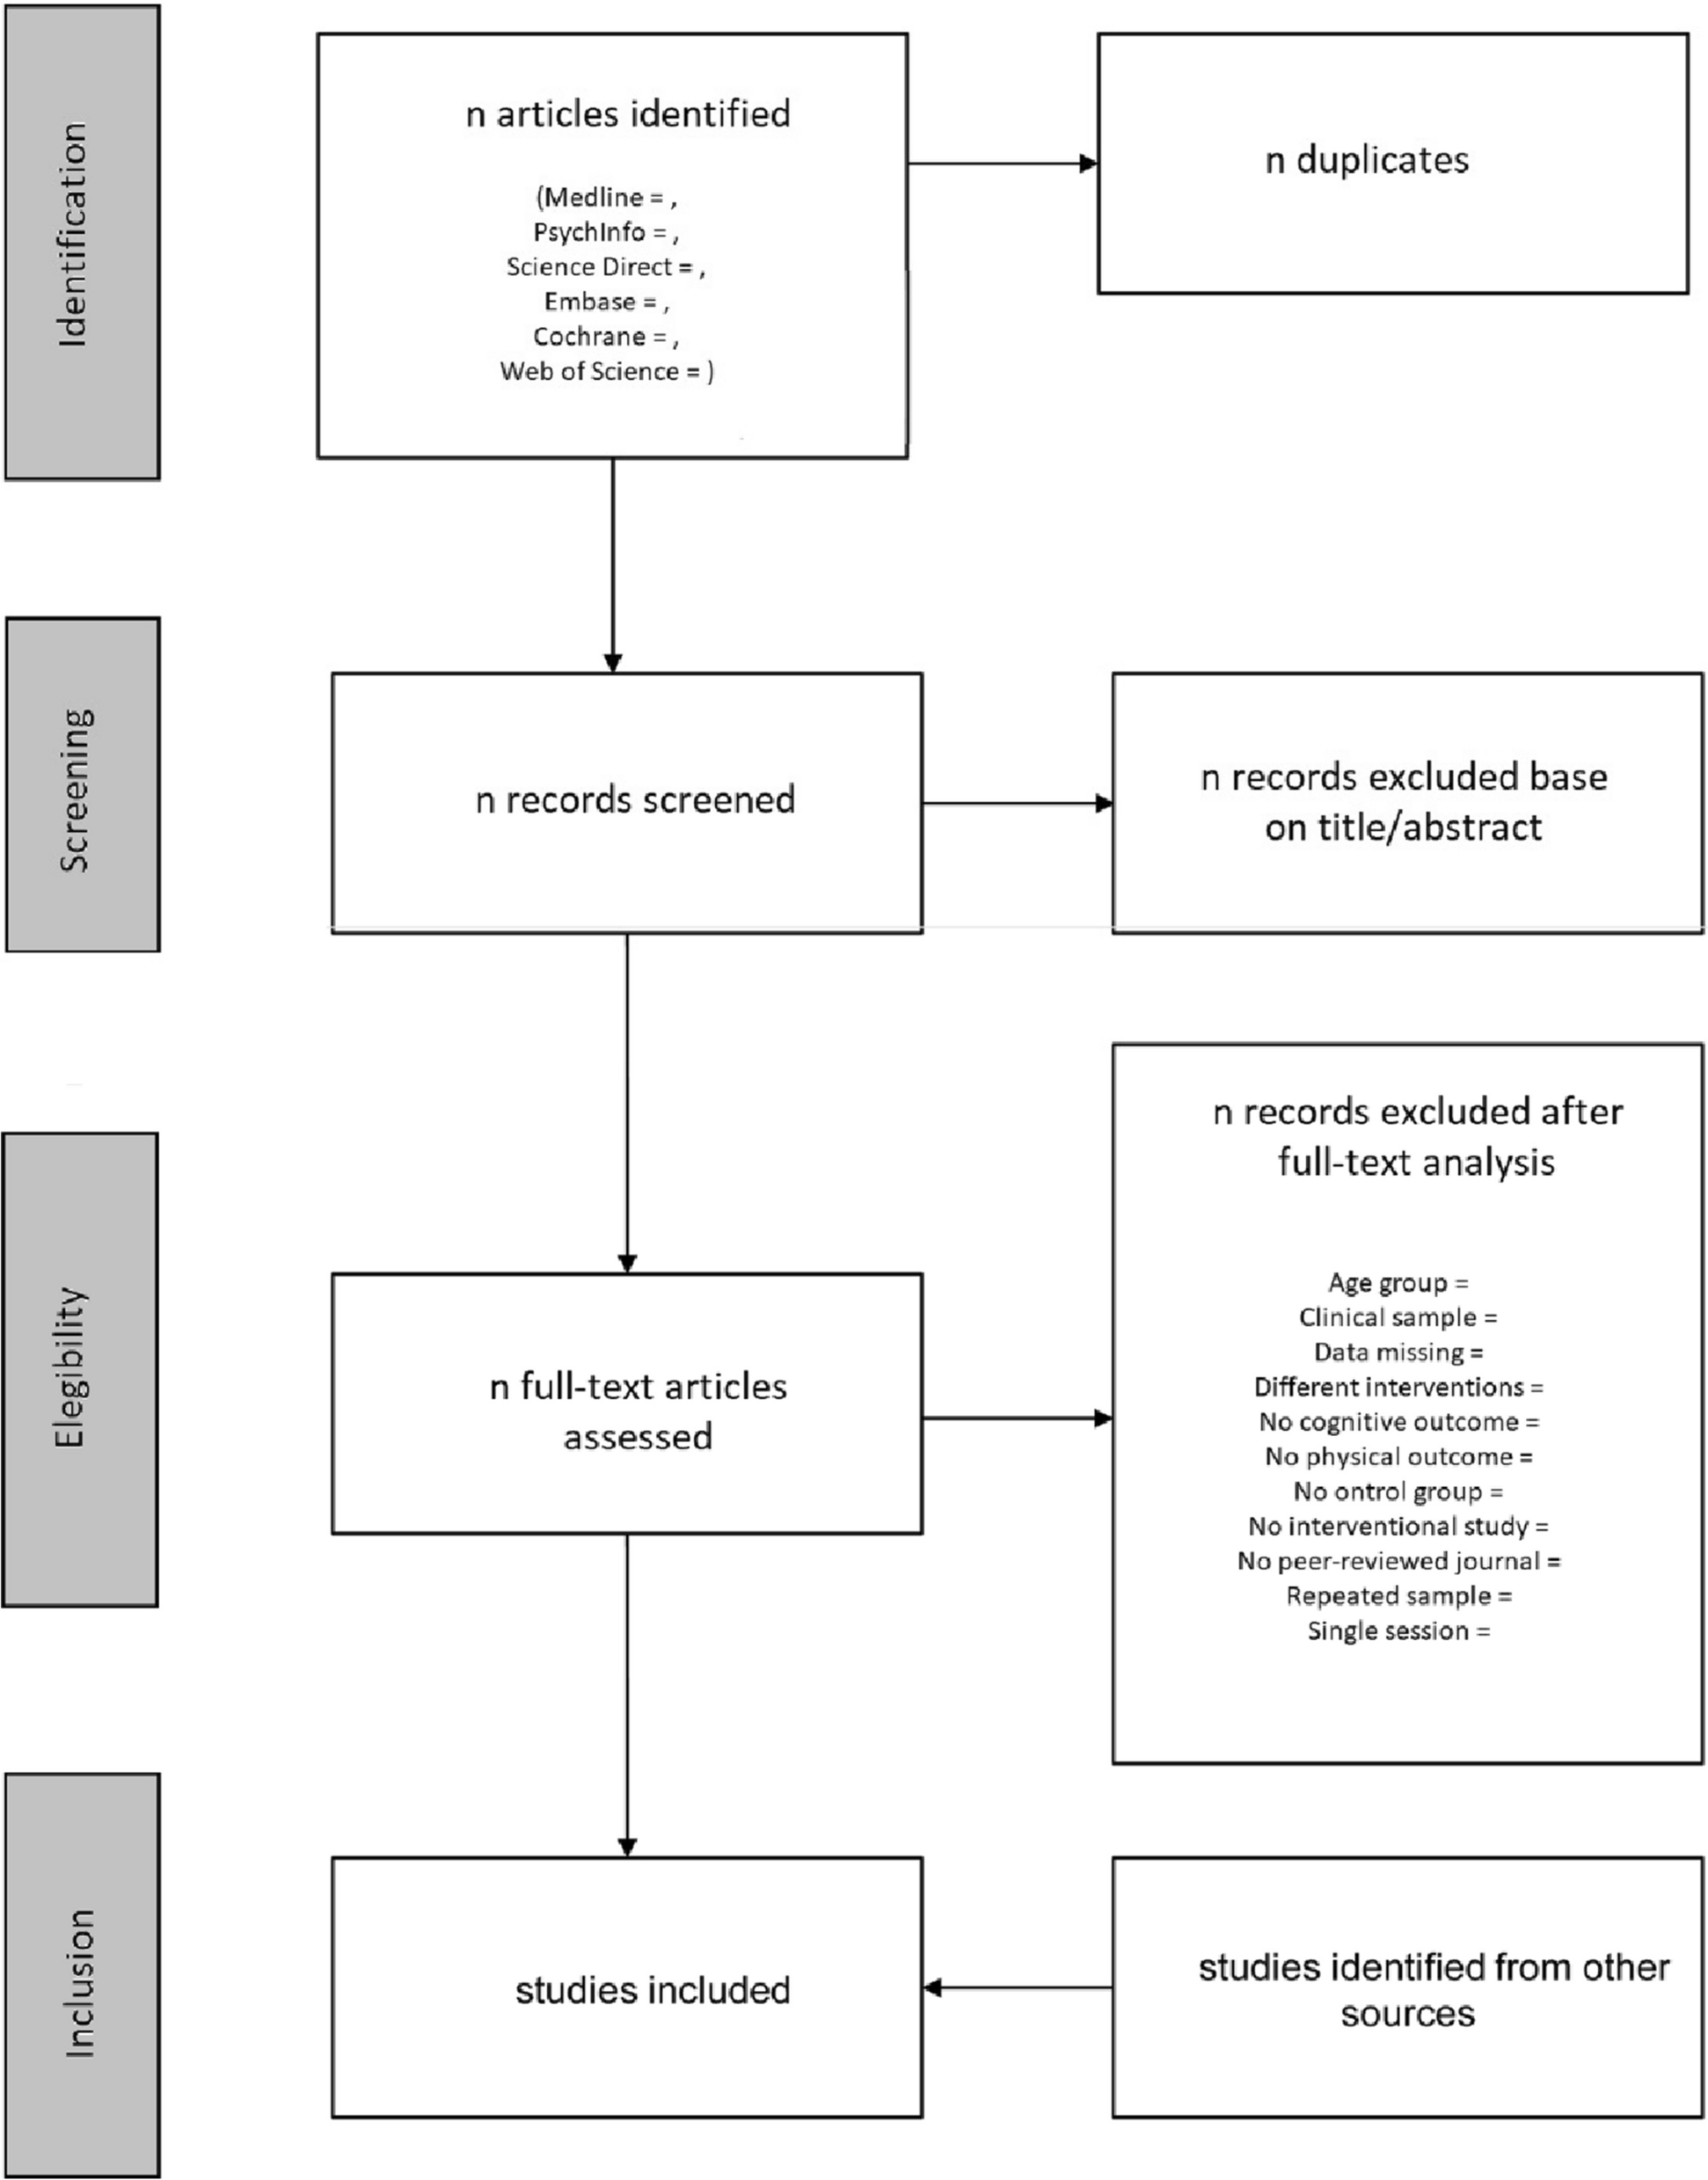
The results of the search from the different databases will be exported to EndNote 20 (a citation manager) and duplicates will be removed. After removing duplicates, the articles will be exported to Rayyan—a web-based systematic review management tool [24] that will be used for the title, abstract, and full-text screening. Included and excluded articles will be exported to and organised in EndNote 20 for the generation of the PRISMA flow chart and in-text citations.
Study selection and data extraction
We will adopt a two-stage screening (title and abstract screening, and full-text screening) to select eligible studies. At the two stages of screening, two review authors will independently screen for studies that are relevant to the objectives of this review using the selection criteria. There will be a pilot screening before the full-text screening. Two review authors (OKO and OA) will independently screen 50 studies; their results will be compared and resolved to maximise inter-reviewer agreement ahead of the full-text screening process. Similarly, data extraction will be done independently by two review authors (OKO and OA) and piloted on a small sample of selected studies using a standardised data extraction form set up on a Microsoft Excel spreadsheet (Additional file 3). Conflict arising through this process will be resolved by a third review author (OAA). Following the description by Lipsey and Wilson [25], and Khaliq and colleagues [26], we will extract the following information from each study: citation details such as first author, year and country of publication, study design (cohort, case-control, cross-sectional, or longitudinal study), sample size, participants’ demographic (age, sex/gender, race, location), socioeconomic factors studied (income, occupation, education, and social status), all the names of PBTs and other mobility assessment instruments used, the measured outcomes, and the statistical methods implemented including the descriptive summary of the outcomes and inferential results such correlation coefficients, odd ratios, relative risks, their effect sizes, and p values (see Additional file 3).
Risk of bias and quality assessment
The Prediction Model Risk of Bias Assessment Tool (PROBAST) [27] will be used to assess the internal validity of the included studies. The study participation, attrition, risk factor measurement, outcome measurement, confounding factor, statistical analysis, and report completeness can be assessed and rated as low, moderate, or high risk of bias. Two review authors (OKO and OA) will complete the assessment independently and discrepancies will be resolved by another review author (OAA). The quality of evidence for the main outcome across the studies will be assessed using the GRADE approach [28], and rated high, moderate, low, or very low based on the confidence in the effect estimate, a summary of the risk of bias assessment, imprecision, and indirectness.
Data analysisNarrative synthesis
A narrative synthesis will be used to analyse the results of all included studies, and the association between socioeconomic factors and walking parameters will be classified by direction and strength: correlation coefficients < 0.3 will be interpreted as a weak association, 0.4 to 0.6 as a moderate association, and > 0.6 as a strong association [29]. Studies will be categorised according to the PBTs that were assessed [1], and the association between each primary outcome and any of the sociodemographic factors under review will be compared between studies that used the same PBT [30].
Meta-analysis
Studies will be grouped according to their designs, such that, case-control, cohort, cross-sectional, and longitudinal studies will be analysed and reported separately [31]. Furthermore, due to anticipated sociodemographic changes over time, both aggregate (1946 to 2023) and separate analyses (20 years intervals; 1946 to 1966, 1967 to 1987, 1988 to 2008, 2009 to 2023) will be conducted for studies based on time-lagged data to determine the direction of associations over time. Comprehensive Meta-Analysis (CMA, version 3) software will be used to conduct the meta-analysis [32]. The overall synthesised measure of effect size will be reported with odd ratios (95% CI). The mean of the combined effect sizes will be calculated in studies where several effect sizes were reported from the same sample (e.g. models with different control variables) [33]. An overall estimate will be calculated for studies with overlapping samples. In studies reporting effect sizes from independent subgroups (e.g. moderators), each subgroup will be included as a unique sample in the meta-analysis. Moderation analyses will also be used to compare associations from cross-sectional and prospective data. The CMA weights studies by inverse variance [32], which is a method of aggregating multiple random variables where each random variable is weighted in inverse proportion to its variance to minimise the variance of the weighted average [33]. The inverse variance is approximately proportional to sample size, but it is a more nuanced measure and serves to minimise the variance of the combined effect [34].
As the individual studies included cannot be expected to come from the same population of studies, the pooled mean effect size will be calculated using the random-effects model [33]. Such effects models are thus recommended when accumulating data from a series of studies where the effect size is assumed to vary from one study to the next and where it is unlikely that studies are functionally equivalent [34]. Random effects models allow statistical inferences to be made to a population of studies beyond those included in the meta-analysis [35].
An I2 statistic will be computed as an indicator of heterogeneity in terms of percentages. Increasing values show increasing heterogeneity, with values of 0% indicating no heterogeneity, 50% indicating moderate heterogeneity, and 75% indicating high heterogeneity [36]. Therefore, we will not conduct a meta-analysis for any group of articles with I2 statistics greater than 75% [37]. However, we will attempt to fix the heterogeneity in groups with I2 statistics between 50% and 75% by checking and removing any outlier study. The “one-study-removed” procedure will be used as a sensitivity analysis to determine whether the overall estimates between sociodemographic factors and mobility limitations are influenced by outlier studies. Using this approach, effect sizes that fell outside the 95th confidence interval of the average effect size will be considered outliers [38]. Other ways we plan to reduce heterogeneity are by subgroup analysis based on study design and time lag, and the use of a random effect model as stated earlier [37]. Three indicators of publication bias are to be examined: funnel plot, Rosenthal’s Fail-Safe N, and Egger’s regression intercept. A Forest plot will be constructed for included studies.


留言 (0)