Study design and participants
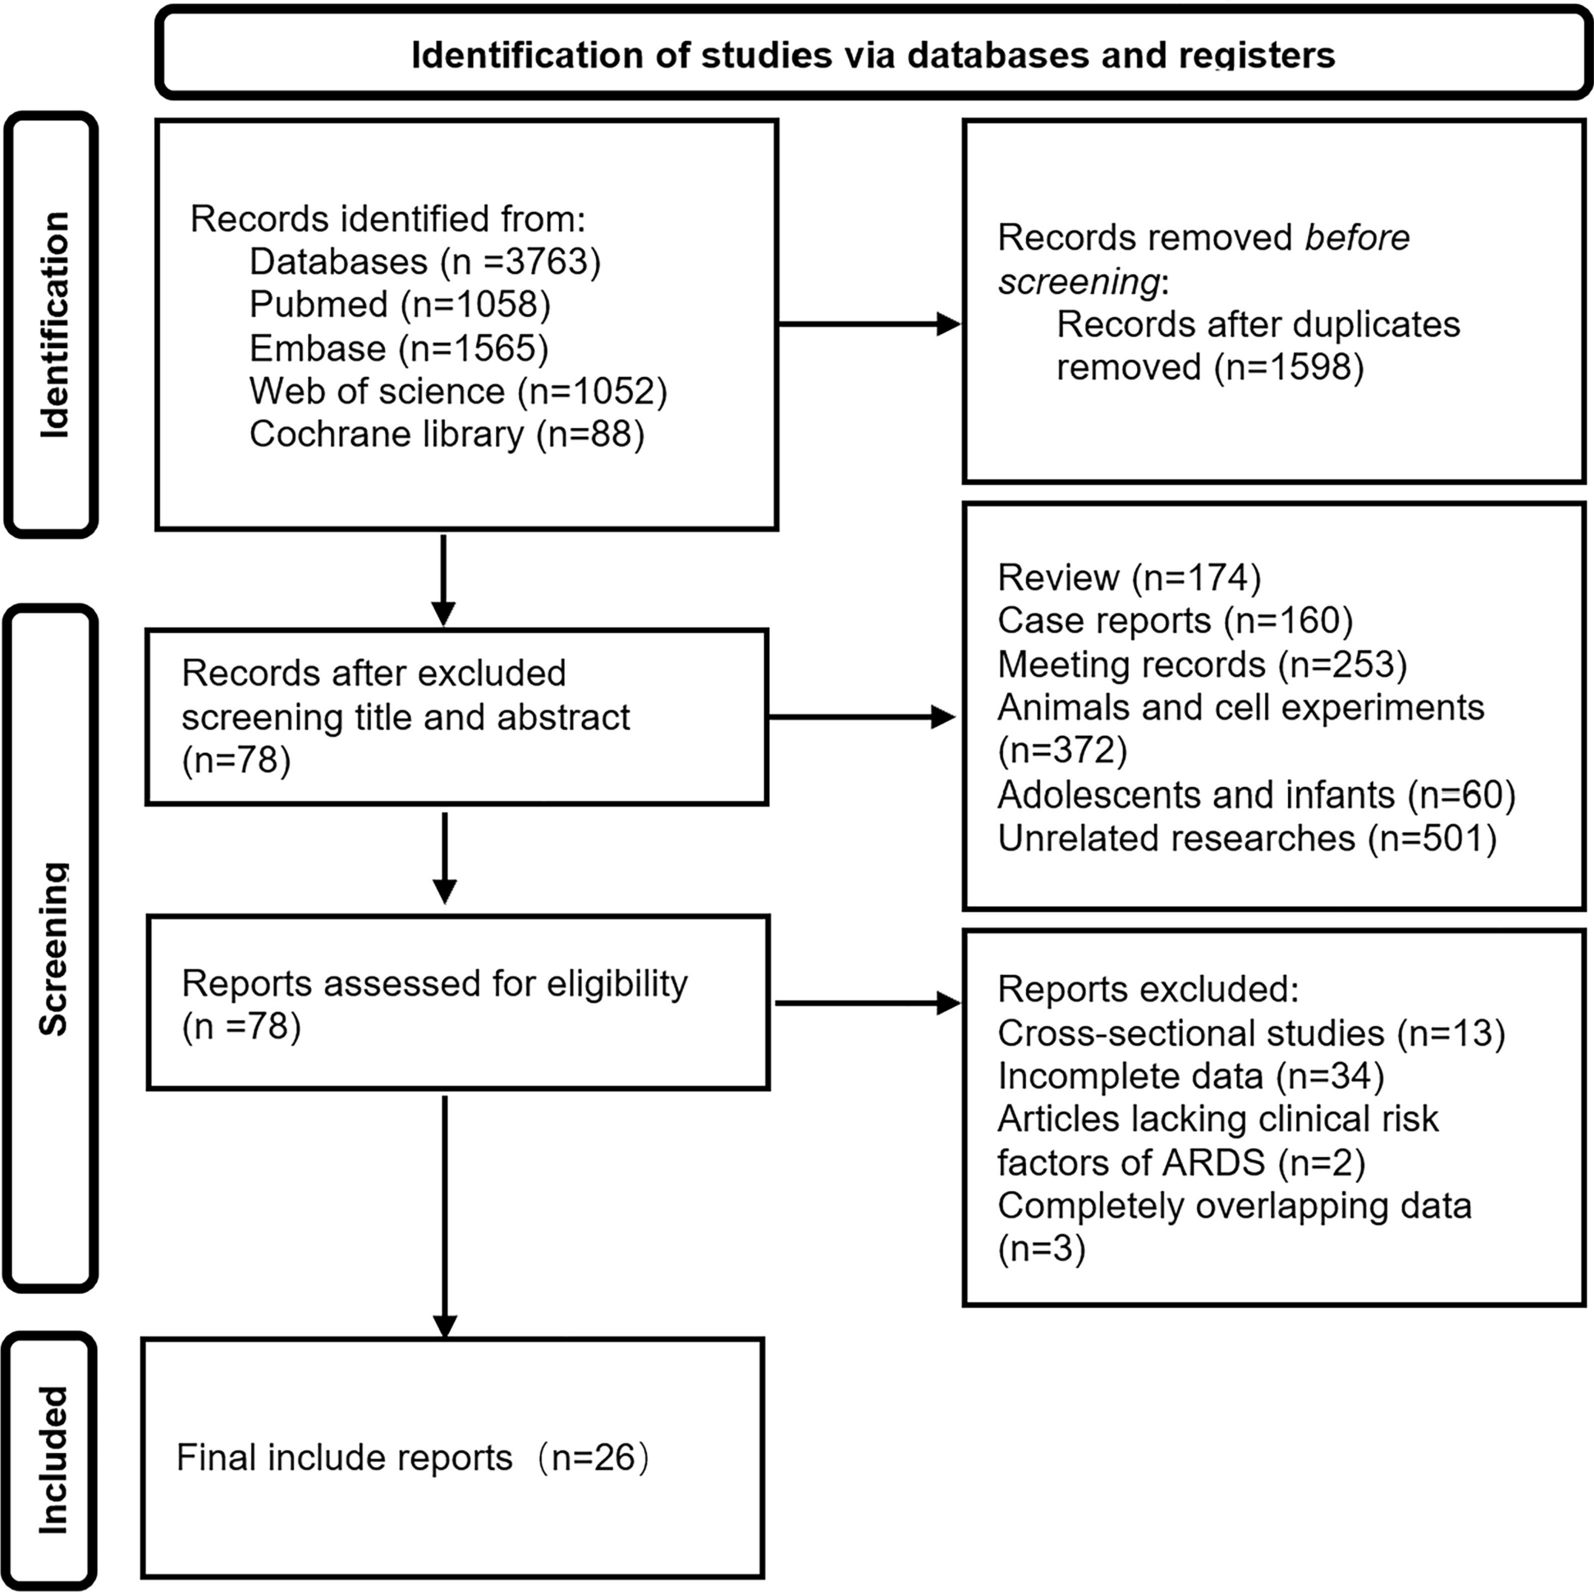
We conducted a retrospective observational study in which the data were extracted from the Chinses Database in Intensive Care (CDIC). The latest CDIC contains more than 12,000 patients admitted to the Department of Crit Care Medicine, Zhongda Hospital, Southeast University, China, from January 2014 to July 2022. ARDS patients who received mechanical ventilation for at least 24 h and underwent CT chest examinations within three days after the initiation of mechanical ventilation were eligible for inclusion. The diagnoses of ARDS were consistent with the Berlin definition [1] (detail in supplementary). We excluded patients younger than 18 years, and we only included the first intensive care unit (ICU) admission of each patient.
The present study was approved by the Research Ethics Commission of Zhongda Hospital Southeast University (2022ZDSYLL385-Y01). STROBE recommendations were followed.
Data collection
For every patient, demographic data, primary lung injury of ARDS, vital signs, laboratory results and severity of illness within the first 24 h after inclusion were collected. The disease severity was measured by Acute Physiology and Chronic Health Evaluation (APACHE) II score and Sequential Organ Failure Assessment (SOFA) score. The use of extracorporeal membrane oxygenation (ECMO), prone positioning and neuromuscular blockade agents were also collected. Longitudinal data of ventilatory variables and blood gas were collected on Days 0, 1, 2 and 3. Ventilatory variables included RR, tidal volume (VT) (scaled to predicted body weight (PBW)), minute ventilation (MV), positive end-expiratory pressure (PEEP), peak pressure (Ppeak) and plateau pressure (Pplat) were obtained. All ventilatory variables were extracted under controlled mechanical ventilation. For patients who received ventilation in a volume-controlled assist mode, DP was calculated as Pplat minus PEEP, if not specified, Ppeak was considered equal to Pplat in pressure-regulated modes other than pressure support ventilation. PBW was calculated as equal to [50 + 0.91 × (centimeters of height − 152.4)] in males and [45.5 + 0.91 × (centimeters of height − 152.4)] in females. Combined ventilator variables were calculated as follows: Mechanical power was calculated as [0.098 × VT × RR × (Ppeak − 0.5 × DP)], and entilatory ratio was calculated as [MV × PaCO2 / (PBW × 37.5 × 100)].
The data in CDIC were extracted from the ICU Patient Data Management System which is used to collect patient health information, measurements of organ function parameters, results of laboratory tests and treatment parameters from ICU admission to discharge. Ventilatory variables were extracted per each time frame of 6 h after the initiation of ventilation. For each 24 h, the time-weighted average variables were calculated as the area under the variables versus the time plot. For other clinical variables, we recorded the most abnormal value if a variable was recorded more than once. We defined DP > 35 cmH20, RR > 60 (breaths min-1) and VT > 20 ml/Kg PBW as outliners, because these physiologically improbable values were assumed to be erroneous. Outliers were transformed into missingness.
Assessment of lung morphology
The lung CT of all patients was collected within three days after the initiation of mechanical ventilation. All lung CT scans were performed in the supine position. One radiologist and two intensivists characterized patients as having focal or non-focal lung morphology [8]. The focal lung morphology was defined as the presence of consolidations localized only in the lower and back parts of the lungs (Additional file 1: Fig. S1).
Outcomes
The primary outcome in the present study was 28-day mortality. Secondary outcomes included ICU mortality, in-hospital mortality and ventilation-free days in 28 days.
Statistical analyses
Values are presented as the mean (standard deviation) or median [interquartile range (IQR)] for continuous variables as appropriate and as the total number (percentage) for categorical variables. Comparisons between groups were made using the X2 test or Fisher’s exact test for categorical variables and Student’s t test or Mann–Whitney U test for continuous variables as appropriate.
We first compared the 28-day mortality of patients with different lung morphology (focal and non-focal) using Kaplan–Meier curves. The dynamic changes of PaO2/FiO2 ratio, PaCO2, DP, RR, mechanical power and the ventilatory ratio between the two groups were also compared using a liner mixed effects model.
Second, we employed extended multivariate Cox proportional hazards regression [12] to assess the interaction effect between lung morphology and longitudinal ventilator variables on mortality. To adjust for baseline disease severity, we constructed a baseline risk model based on clinical relevance and prior knowledge [11] and included ARDS primary risk factor, PaO2/FiO2 ratio, arterial pH, PaCO2 and respiratory system compliance. All subsequent analyses were pre-adjusted for the baseline risk model. Three Cox regression models (Model A to Model C) containing different ventilator variables were performed (Additional file 1: Table S1). We treated the longitudinal ventilator variables as time-varying exposures in the model. The interaction effect was assessed by the interaction term (lung morphology x ventilator variables) in each Cox regression model.
Third, to validate whether the impact of DP on mortality was four times as large as that of RR, we used Model D (Additional file 1: Table S1) to compare the effect size of DP and RR on 28-day mortality. We also employed restricted cubic splines to visualize the above association. Model E (Additional file 1: Table S1) was constructed to validate the association between the combined ventilator variable [(4×DP) + RR] and mortality. We identified the lowest [(4×DP) + RR] that corresponded to an adjusted hazard ratio estimate of more than 1.00 from Model E. Model F (Additional file 1: Table S1) was used to compare which variable ([(4×DP) + RR] or mechanical power) had a stronger association with mortality. All the above analyses were performed in the whole population and patients with different lung morphology.
Fourth, to further explore the discriminatory performance of each variable on mortality, we calculated the C-index (equivalent to the area under the receiver operating characteristics (AUROC) curve) of each Cox regression model (except for Model D and Model F). To avoid bias induced by missing data (Additional file 1: Table S2) in all Cox regression modes, we used multiple imputations by chained equation (MICE) to account for the missing data (detail in supplementary).
Finally, considering that ECMO could influence the impact of ventilatory variables on mortality, we performed a sensitivity analysis after excluding patients receiving ECMO during the study period.
The p-value was calculated to evaluate the differences between groups, and P < 0.05 was considered statistically significant. All statistical analyses were performed using R (version 4.0.3).


留言 (0)