Patients and urine samples
Nine patients with CRC diagnostic by pathology of histology in Beijing Shijitan Hospital from January 2020 to January 2021. These patients had no history of other malignancies, and had not received adjuvant chemoradiotherapy before surgery. Based on the clinicopathological indexes, they were divided into three groups, such as local cancer without metastasis (C), locally advanced cancer with lymph nodes metastasis (CLN) and cancer with distant metastasis (CM), three subjects for each group. Three healthy people were included as controls (NC). Written informed consents were obtained from all subjects. The study was approved by the Ethics Review Committee of Beijing Shijitan Hospital.
Fifty Milliliter morning urine from all the participants were collected in sterile containers for exosome extraction. It should be stored at -20 ℃ before following processing.
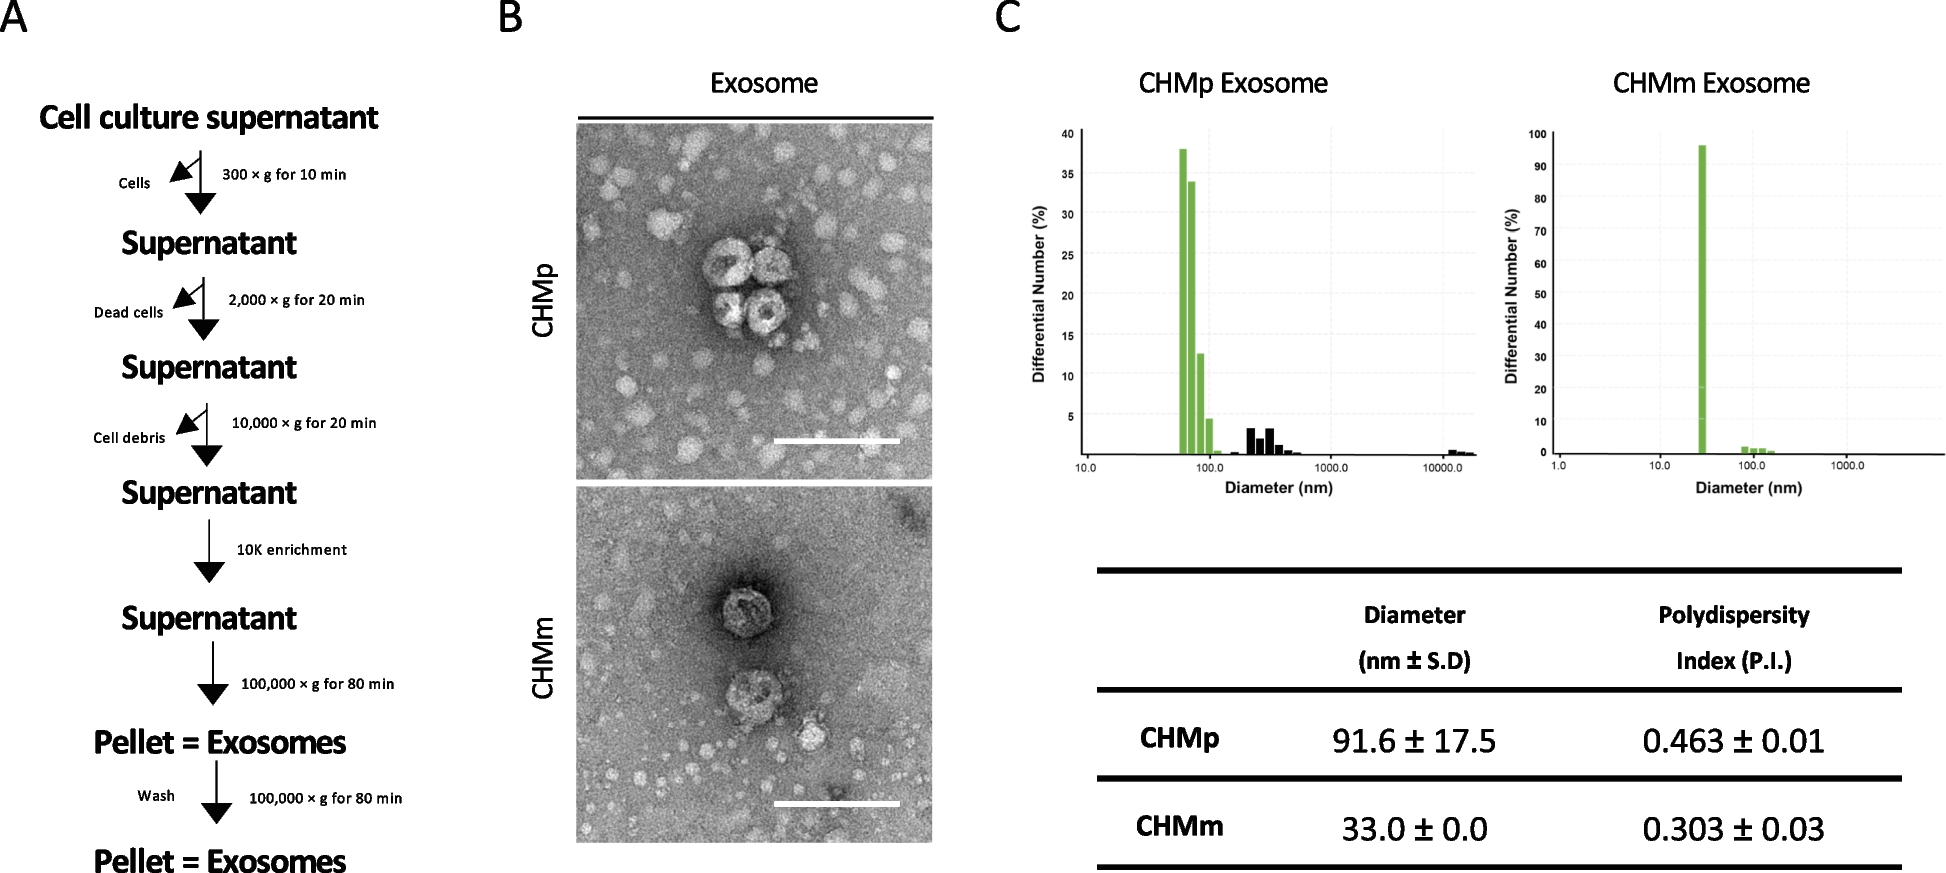
Isolation of EVs from urine
The EVs in urine were isolated by the density gradient ultracentrifugation. After rapid melting under room temperature, the urine sample was centrifuged at 2000 × g, 4 ℃ for 30 min to remove the floating cells and other impurities, then at 10,000 × g, 4 ℃ for 30 min to remove the macrovesicles. Supernatant was filtered (0.45 mm, Merck Millipore) to remove contaminating microvesicles and cell debris, and then centrifuged at 100,000 × g, 4℃ for 70 min twice. The precipitate was resuspended in the 100 μl pre-cooled Phosphate Buffered Saline (PBS) and stored at -80℃.
Transmission electron microscopy
The EVs were observed using the transmission electron microscopy (TEM) (Hitach, Japan). 10 μl suspension was plated on the TEM grid and precipitated for 1 min. Then the supernatant was removed by filter paper. 10 μl uranyl acetate was transferred to the grid and precipitated for 1 min. After the supernatant was removed by filter paper, the grid was dried under room temperature for few minutes and observed with HT-7700 transmission electron microscope at 100 kV.
Quantitative analysis of EVs
The size and concentration of microparticles were determined by Flow NanoAnalyzer (NanoFCM, Xiamen, China). 10 μl suspension was diluted into 30 μl and then measured by NanoFCM according to the manufacturer’s instruction. All the data were analyzed with relative software. Three independent experiments were performed.
Nanoparticle flow cytometry
The tetraspanins at the surface of exosomes, CD9, CD63 and CD81 were commonly used as biomarkers. NanoFCM could also provide high sensitivity flow cytometry for nanoparticle analysis. The 488-nm laser diode was selected as the laser to illuminate the sample. The detection channels were side-scattered light and Fluorescein Isothiocyanate (FITC) fluorescence channel respectively. The EVs were incubated with FITC conjugated anti-CD9, CD63, CD81 and IgG. Then the diluted sample that yielded 100–150 detection events per second was analyzed by NanoFCM.
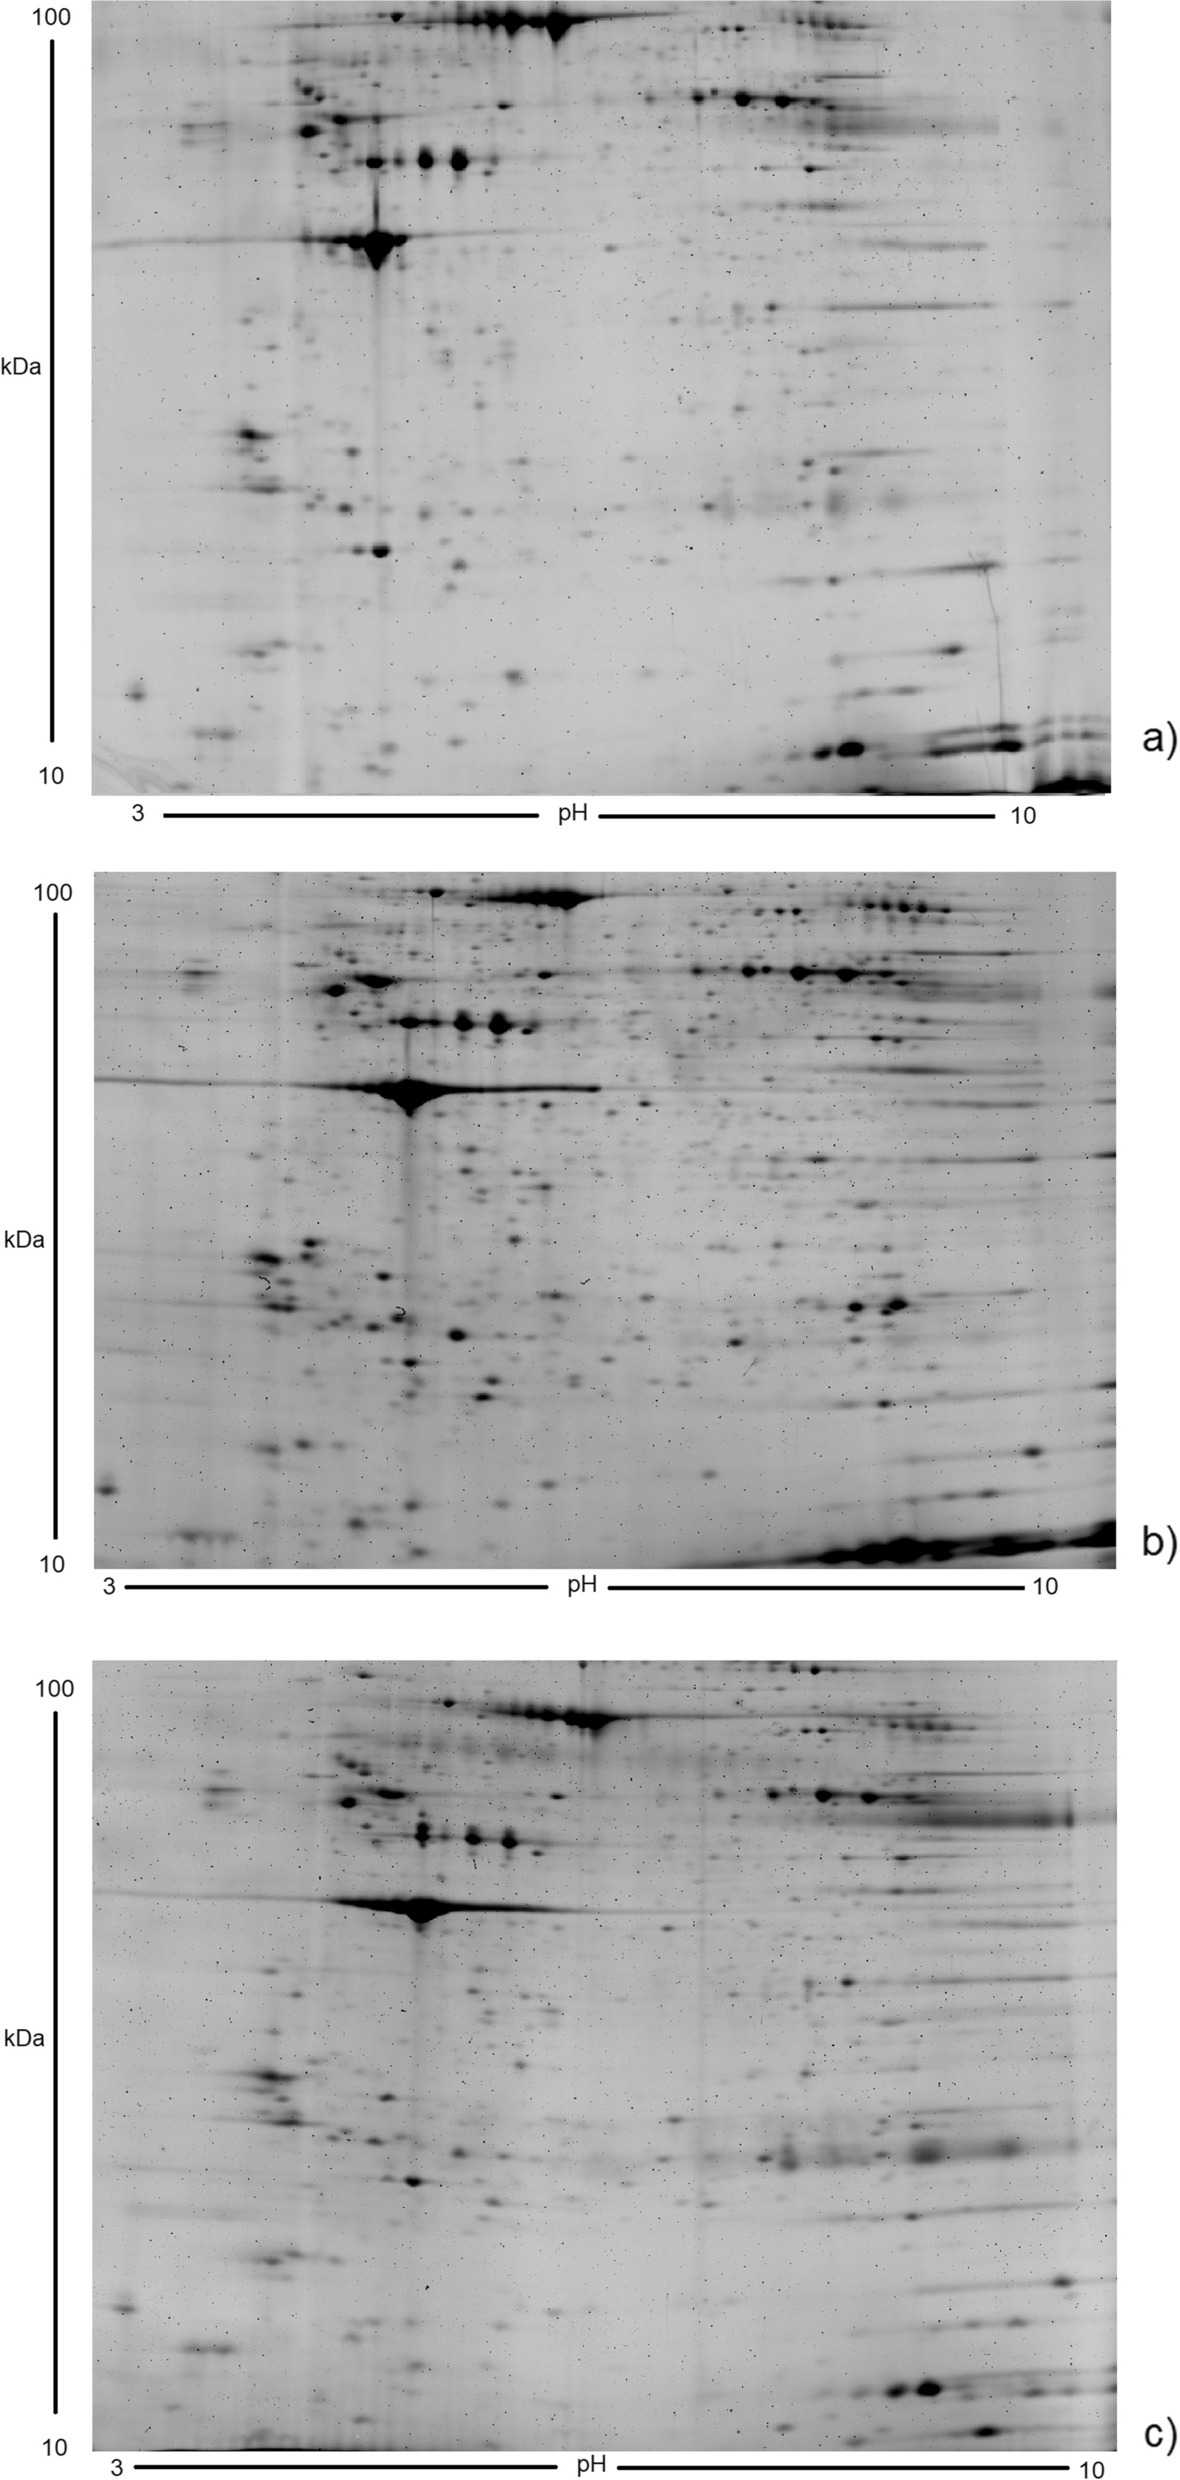
Exosomal protein extraction and filter-aided sample preparation
The remaining 80 μl supernatant mixed with 400 μl lysis solution (7 M urea, 2 M thiourea, 0.1% protease inhibitor and 65 mM DTT) was processed with ultrasonication in ice bath (70 W, 5 s, 3–5 times) and placed on ice for 40 min. After centrifugation at 5000 × g, 4 ℃ for 30 min, the supernatant was collected for filter-aided sample preparation (FASP). The protein sample was diluted with 200 μl UA (8 M urea in 0.1 M Tris, PH 8.5) and then reduced with 20 mM DTT for 4 h at 37 °C. The protein was alkylated with 50 mM iodoacetamide (IAA) for 30 min in the dark, and the alkylation reaction was quenched with 200 μl 5 Mm DTT. After centrifugation at 14,000 × g, 15 min for twice, 200 μl ABC solution (50 mM NH4HCO3 in water) was added to the sample and the centrifugation process was repeated. 100 μl ABC solution containing trypsin (trypsin: protein = 1: 50) was added to the membrane and digested overnight at 37 ℃. The next day, peptides were eluted from the membrane by centrifuging for 15 min at 14,000 × g. 100 μl of water was used for a second elution. Samples were dried using a vacuum centrifuge.
Label-free liquid chromatography-tandem mass spectrometry (LC–MS/MS)
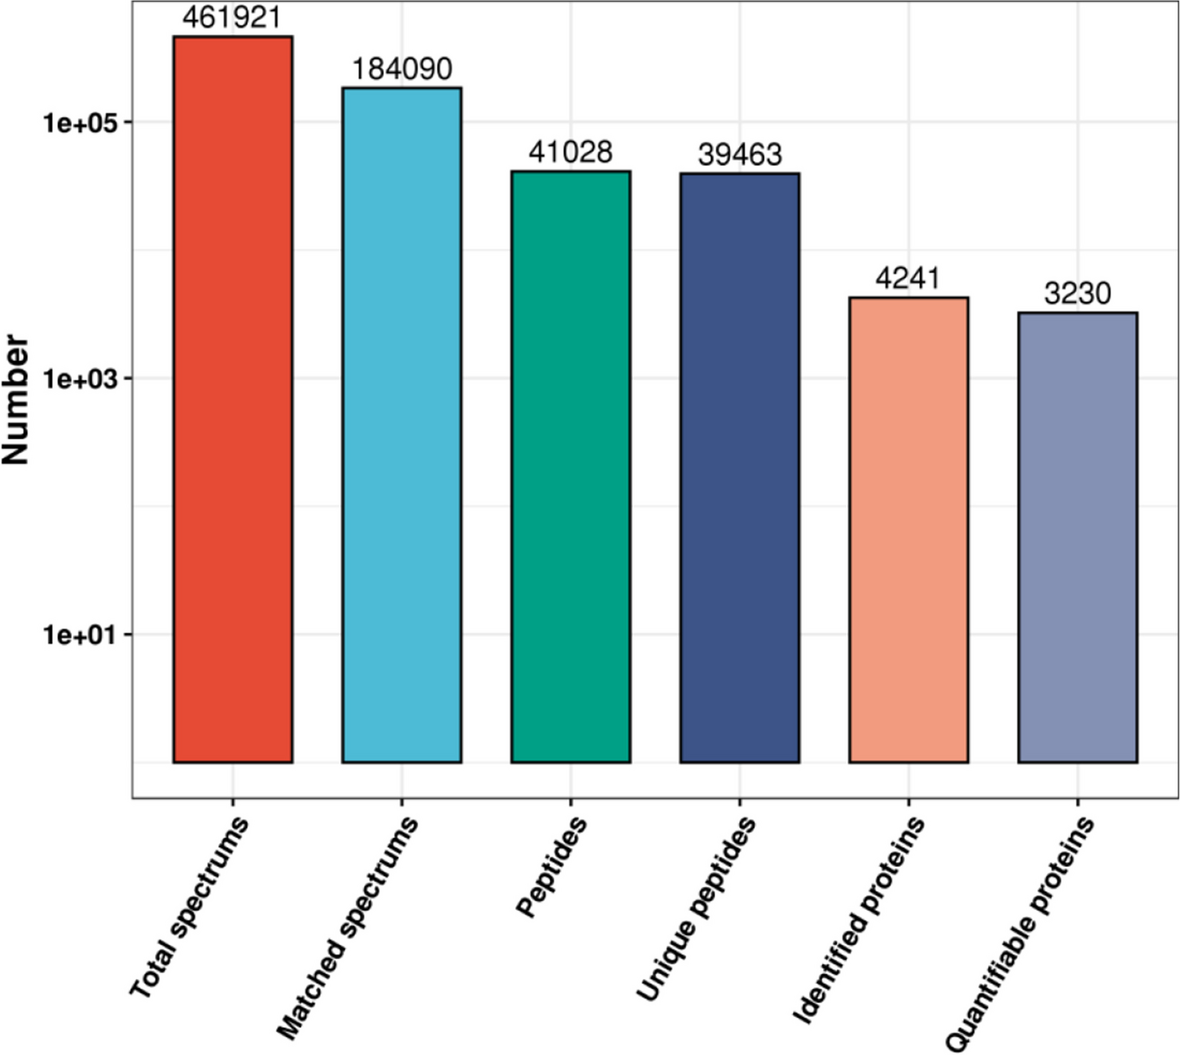
The LC–MS/MS was performed using the Easy-nLC 1200/Orbitrap Fusion Lumos Mass Spectrometer (ThermoFisher Scientific, Bremen, Germany). Peptides were dissolved in 0.1% formic acid (FA) and separated with the autosampler. Peptide mixture were loaded on a trap column (PepMap C18, 100 Å, 100 μm × 2 cm, 5 μm), and then separated on the analytical column (PepMap C18, 100 Å, 75 μm × 50 cm, 2 μm) in mobile phase A [ACN-H2O-FA (1.9; 98; 0.1, v/v/v)] and mobile phase B [ACN-H2O-FA (98;1.9; 0.1, v/v/v)]. The MS instrument was operated in a data dependent acquisition mode (DDA). The conditions of gradient elution were as follows: 6–9% buffer B for 0–8 min, 9–14% buffer B for 8–24 min, 14–30% buffer B for 24–60 min, 30–40% buffer B for 60–75 min, 40–95% buffer B for 75–78 min, 95% buffer B for 78–85 min, and then changed to 6% buffer B within 1 min and equilibrated for 4 min. Spectra were scanned over the m/z range 400–1500 Da at 35,000 resolution. 30 s exclusion time and 30% normalization collision energy were set at the dynamic exclusion window.
Data analysis
RAW files were extracted was performed using the Maxquant software (version 1.5.2.8, Germany). Label-free quantitation analysis (LFQ) was performed according to the intensity based absolute quantification (iBAQ). The parameters were set as follows: fully tryptic peptides with ≤ 2 missed cleavages were permitted; carbamidomethylation (C) was as fixed modifications, oxidization (M) and acetyl (protein N-term) were as variable modifications; the charge state of the peptides were set from 2 to 7. The cut-off of global false discovery rate (FDR) for peptide and protein identification was set to 0.01.
Functional annotation analysis of differentially expressed proteins was determined by gene ontology (GO) enrichment using the DAVID online tool (http://david.abcc.ncifcrf.gov/) and Kyoto Encyclopedia of Genes and Genomes (KEGG) using the WEB-based Gene SeT AnaLysis Toolkit (http://bioinfo.vanderbilt.edu/webgestalt/). The Search Tool for Recurring Instances of Neighbouring Genes (STRING) database (http://string-db.org/) was used for network analysis.
Statistical analysis
All data were expressed as mean ± standard deviation (s.d.). The results were statistically analyzed using GraphPad Prism 5 statistical software (San Diego, CA). Differences between groups were determined using Student’s t-test. P-value of < 0.05 was considered statistically significant.


留言 (0)