
記住我
Systematic reviews and meta-analyses traditionally have been among the highest levels of evidence synthesis.1 However, the number of systematic reviews and meta-analyses has gradually increased in recent decades to the point of becoming overwhelming in some fields.2 3 Moreover, some meta-analyses overlap but come to different conclusions.4 Umbrella reviews (sometimes called ‘overview of systematic reviews’, ‘overview’, ‘review of reviews’, etc) are a new type of meta-evidence synthesis that has emerged in recent years to provide a bird’s eye summary on a wide body of evidence on a determinate topic.5 6 To overcome inconsistencies in overlapping meta-analyses, authors of umbrella reviews commonly use different strategies. For example, to limit biases caused by the non-identification of studies, they may present the results of the meta-analysis with the largest number of studies.7–9 Alternatively, they may present the results of the meta-analysis with the highest methodological quality.10–12 Importantly, when several meta-analyses strictly overlap but report discrepant results, it is a good practice to discuss the factors that may have led to these differences in results. Overall, umbrella reviews provide a single document that synthesises an extensive body of information that could not be generated within a single publication for feasibility reasons and that direct readers to the current best evidence. For example, Radua and colleagues9 synthesised 55 meta-analytic papers that examined the effects of 170 putative risk and protective factors for psychotic disorders, based on 683 individual studies. Clinical decision-makers may use the results of this umbrella review to access the main results that are relevant to a specific question.
Umbrella reviews originated more than one decade ago and their number has grown exponentially ever since (peaking to more than 300 new umbrella reviews published in 2020).6 13–16 However, even if conducting an umbrella review typically requires recalculating meta-analyses and performing extra calculations, no R package or other software has yet been specifically developed for data analysis in umbrella reviews. Numerous R packages (such as meta, metafor, robumeta and metansue), commercial software (such as Comprehensive Meta-Analysis, SPSS or STATA) and free software (such as JAMOVI) allow performance of meta-analyses.17–21 Analysing the data generated by an umbrella review with these multiple tools is not straightforward for several reasons. First, because these tools are dedicated to the completion of a single meta-analysis, users must sequentially replicate all the meta-analyses included in their umbrella review, or must build scripts to automate the process (which requires advanced coding skills). Second, authors must sequentially harmonise the input data to replicate the meta-analyses (eg, meta-analyses can report the effect size values and their SE, or the means and SD for continuous outcomes vs the contingency table for binary outcomes, etc). Authors also have to harmonise the generated results by converting all the pooled effect sizes into the same metric to facilitate interpretation. Third, because there is no comprehensive software dedicated to the analyses required for an umbrella review, users must continuously switch across the different existing software to benefit from some of their features. Fourth, because meta-analyses often have a complex data structure (such as non-independence between effect sizes), authors must build specific models for these situations.22 Last, to stratify the evidence during an umbrella review, authors must manually extract information from the results. All these steps make conducting an umbrella review very time-consuming and, more critically, increase the risk of human errors, much especially when the number of meta-analyses included in the review is high. Researchers would thus largely benefit from a comprehensive suite for conducting umbrella reviews which can be customised to their needs.
The objective of this paper is to present an overview of the metaumbrella tools which are designed to assist in data analysis during an umbrella review. In the following sections, we present the use of the R package metaumbrella to analyse the data generated by an umbrella review that contains meta-analyses with dependent effect sizes. We also present complete tutorials for conducting the same data analysis but using two graphical user interface (GUI) platforms: a JAMOVI module and a browser-based application (https://metaumbrella.org/). These tutorials on the JAMOVI module and the browser-based app are available online at https://corentinjgosling.github.io/BMJ_MH_METAUMBRELLA/).
MethodsTo achieve automation in the calculations, the metaumbrella package (as well as its companion JAMOVI module and browser-based app) requests that users build a data set that follows fixed rules. (A detailed description of how building such a well-formatted data set is beyond the scope of this paper. A step-by-step tutorial with a concrete example is provided as a vignette of the package at https://cran.r-project.org/web/packages/metaumbrella/vignettes/format-dataset.html.) Therefore, to guide users in this formatting, the package also proposes a function that specifically checks the formatting of the data set and provides guidance on formatting the issues detected (figure 1). (Details on calculations conducted by the R package metaumbrella can be found in a dedicated vignette at https://cran.r-project.org/web/packages/metaumbrella/vignettes/calculations-details.html.)
 Figure 1
 Description of the main functions of the metaumbrella package. eG, equivalent Hedges’ g; eOR, equivalent odds ratio.
First steps with the metaumbrella packageTo use the metaumbrella package in R, it must first be installed and loaded using the following respective commands:
Once these R commands have been run, all functions of the package and several example data sets become available. In this paper, we will use one of these data sets stored under the name df.radua2019. This data set is directly inspired from an umbrella review on the putative risk factors for post-traumatic stress disorder collected from 155 studies and synthesised in seven meta-analyses.23
The following R command allows visual exploration of this data set:
Check data set formattingThe view.errors.umbrella() function has been specifically designed to guide users in the formatting of their data set. By default, this function allows users to obtain information on formatting problems of their data set by (1) adding two columns to the original data set (column_type_errors and column_errors) describing formatting issues encountered in each row of the data set and (2) generating messages listing all the formatting issues encountered.
Two types of formatting issues are identified. Formatting errors (such as negative sample sizes or SEs, too little information to run the analyses, etc) are issues that prevent running calculations. Formatting errors are associated, for each problematic row, with an ‘ERROR’ value in the column_type_errors column and a description of the problem encountered in the column_errors column. In contrast, formatting warnings (such as non-symmetric CI around the effect size, empty rows, etc) are potential inconsistencies that do not prevent running calculations but that should be carefully reviewed by users before relying on the results generated by the metaumbrella package. Formatting warnings are associated, for each suspicious row, with a ‘WARNING’ value in the column_type_errors column and with a description of the problem encountered in the column_errors column.
To use this function, it only requires applying it on a dataframe.
In the JAMOVI module and in the browser-based app, this function is automatically run.
Conduct main calculationsTo replicate the pairwise meta-analyses and to run additional calculations needed to stratify evidence in an umbrella review, the metaumbrella package relies on the umbrella() function. This function performs the following:
Fixed-effect or random-effects meta-analyses.
Assessment of inconsistency/heterogeneity (I²).
Tests for small-study effects.
Tests for excess statistical significance.
Jackknife leave-one-out analysis.
The advantage of this function over standard R packages only designed for fitting a single meta-analysis lies in the possibility of (1) automatically fitting several pairwise meta-analyses when input information differs (eg, eight different combinations of input information are possible to conduct an umbrella review with the OR as effect size measure); (2) automatically extracting the necessary information to stratify the evidence; (3) automatically converting all pooled effect sizes expressed in any of the 10 available effect measures (mean difference, standardised mean difference [SMD], Hedges’ g, standardised mean change, (log) OR, (log) risk ratio, (log) incidence rate ratio [IRR], (log) HR, correlation and Fisher’s z [R and Z]) in two common effect measures, equivalent Hedges’ g (eG) and equivalent odds ratio (eOR)24; (4) automatically conducting additional calculations such as small-study effects25 and excess for statistical significance26; and (5) automatically handling multivariate situations where the same study reports multiple effect sizes (due to the presence of multiple outcomes measured in the same participants or due to the presence of multiple independent subgroups). In these multivariate situations, the umbrella() function automatically aggregates all the effect sizes coming from the same studies using the procedures described by Borenstein and colleagues.24
To use this function, it only requires applying it on a well-formatted data set:
The ‘mult.level’ argument should be set as ‘TRUE’ if the data set contains at least one meta-analysis with a complex data structure, namely with a dependence between some effect sizes (otherwise, this argument can be discarded). Several customisations are possible (such as the choice of the estimator of the between-study variance, the test of excess statistical significance, etc). All possible customisations of the umbrella function can be obtained using the following command in R:
In the JAMOVI module and in the browser-based app, this function is automatically run and can be customised to match the needs of the users.
Stratify the evidenceThe add.evidence() function is used to algorithmically stratify evidence using the results of the calculations performed by the umbrella() function as well as information collected/generated by the users. Two pre-established criteria are proposed but users can also use some personalised criteria to adapt to the requirements of their umbrella review.
The first pre-established criteria are those proposed by Professor Ioannidis.5 These criteria propose to stratify evidence in five ordinal classes: ‘Class I’, ‘Class II’, ‘Class III’, ‘Class IV’ and ‘Class ns’, with ‘Class I’ being the highest class that can be reached.
The second pre-established criteria are inspired by the Grading of Recommendations, Assessment, Development and Evaluations (GRADE) classification.27 28 Importantly, this algorithmic approach should not be taken as an equivalent to the approach underlying the standard GRADE criteria. However, in line with the standard GRADE approach, the GRADE classification used in the metaumbrella package stratifies evidence according to four ordinal classes (‘High’, ‘Moderate’, ‘Low’ and ‘Very low’) and uses a downgrading procedure. All factors start with a ‘High’ evidence class that could then be downgraded depending on four indicators.
Last, because the criteria used to stratify evidence can vary depending on the aim of the umbrella review, the add.evidence() function offers the possibility of selecting the criteria used to stratify evidence as well as the cut-off values to reach each class. Similarly to the ‘Ioannidis’ criteria, evidence is stratified in five ordinal classes, from ‘Class I’ to ‘Class V’ (with ‘Class I’ being the highest class that can be reached). A total of 13 criteria can be used to stratify evidence: (1) the number of studies included in the meta-analysis, (2) the total number of participants included in the meta-analysis, (3) the number of cases included in the meta-analysis, (4) the p value of the pooled effect size, (5) the inconsistency/heterogeneity between individual studies (I² statistics; proportion of the variation in observed effects that is due to heterogeneity rather than sampling error (chance),29 (6) the imprecision of the pooled effect size (the statistical power of the meta-analysis to detect a given SMD value), (7) the percentage of participants included in studies at low risk of bias, (8) the methodological quality of the systematic review (such as A MeaSurement Tool to Assess systematic Reviews [AMSTAR] score), (9) the p value at the Egger’s test for small-study effects,25 (10) the p value of the test of excess statistical significance,26 (11) the highest p value obtained in the jackknife meta-analysis, (12) the inclusion of the null value in the 95% prediction interval (PI) and (13) the statistical significance of the largest study (ie, with the smallest variance) included in the meta-analysis. Users can select any of the 13 criteria (minimum 1 and maximum 13) and must set the threshold scores for each selected criteria to reach the five possible classes.
The add.evidence() function requires two core arguments, the object in which the calculations performed by the umbrella() function are stored and the name of the criteria used to stratify evidence (‘Ioannidis’, ‘GRADE’ or ‘Personalized’). Assuming that the calculations conducted by the umbrella() function have been stored in the object ‘umb’, the following R command allows stratification of the evidence according to the Ioannidis criteria:
All customisations for the personalised criteria can be obtained using the following command in R:
In the JAMOVI module and in the browser-based app, this function is automatically run and can be customised to match the needs of the users.
Generate a forest plotA graphical presentation of the results can be obtained with the forest() function, which generates either a forest plot depicting the pooled effect sizes of the meta-analysis (if applied on an object generated by the umbrella() function) or a forest plot along with information on the stratification of evidence (if applied on an object generated by the add.evidence() function). The size of the dot of each pooled effect size is depicted proportionally to the precision of the estimate. Assuming that the results of the stratification of the evidence have been stored in the object ‘strat’, the following R command allows users to produce a forest plot along with information on the stratification of evidence:
The forest() function contains many arguments to control the output of the plot (such as the titles of the plot and axis, the size of the dots and text, etc). A complete description of all arguments can be obtained using the following R command:
In the JAMOVI module and in the browser-based app, this function is automatically run and can be customised to match the needs of the users.
ResultsIn this section we will present the main results generated by the four functions presented in the previous section. Note that the functions of the metaumbrella package automatically present the results converted into two effect size measures, eG or eOR. By parsimony, we present here the results only in eG.
Checking of the data set formattingAs can be seen in figure 2, the view.errors.umbrella returns only a message explaining that the data set is correctly formatted since no errors were detected. If errors had been detected, the function would have returned a message displaying all errors encountered, as well as a data set containing only the rows of the original data set with formatting issues.
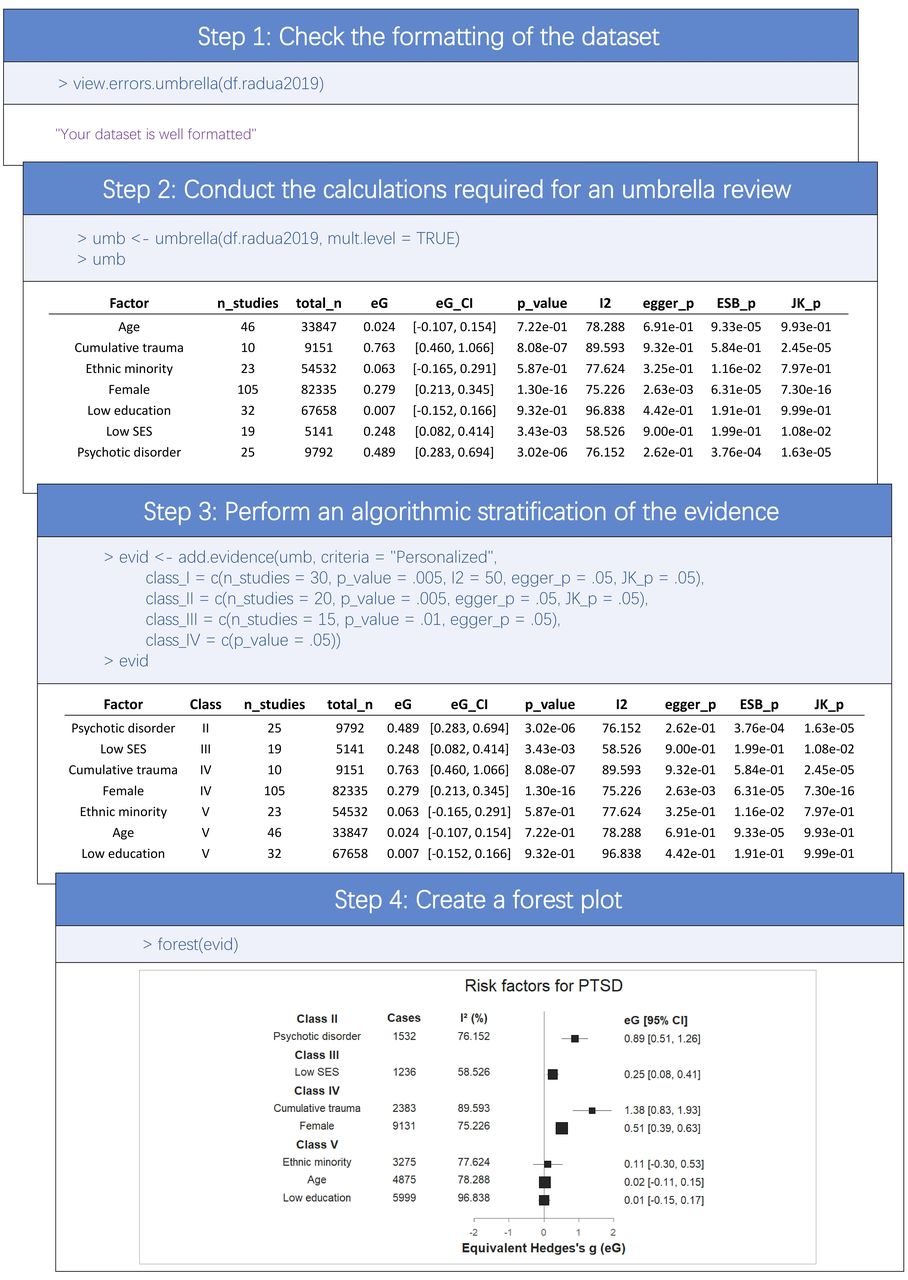 Figure 2
 R commands (in blue) and outputs generated by the functions of the metaumbrella package. PTSD, post-traumatic stress disorder.
In the JAMOVI module and in the browser-based app, the results of this function can be easily accessed (see figures 3B and 4B).
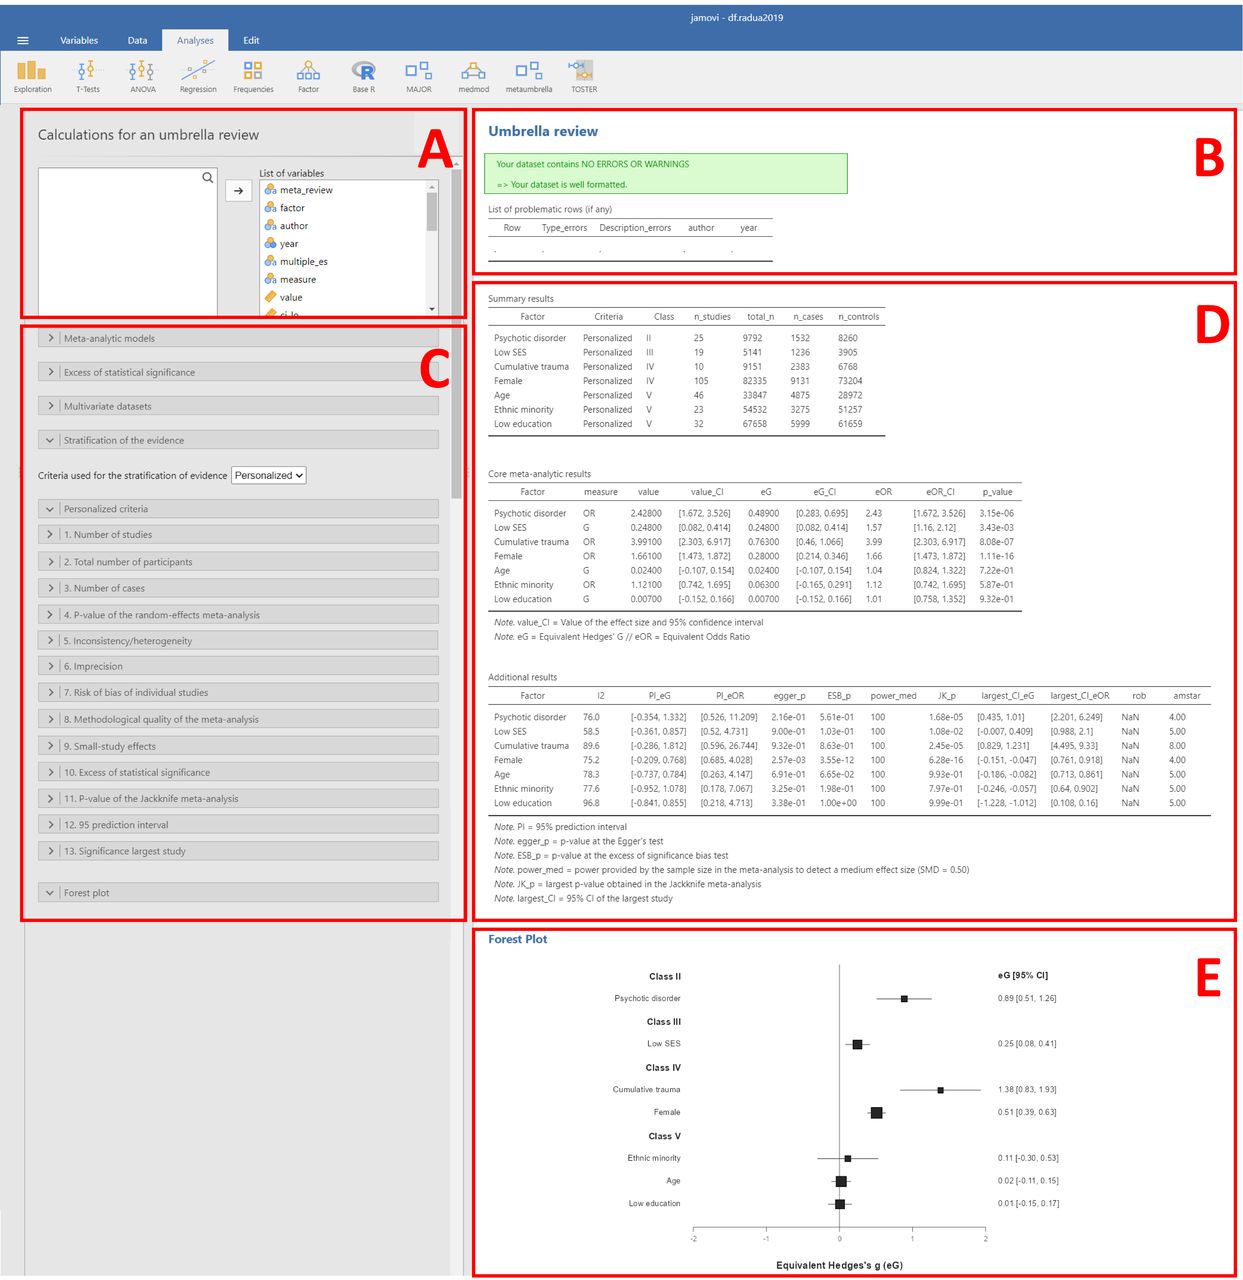 Figure 3
 Illustration of the JAMOVI module. (A) Loading of the data set. (B) Data set formatting checks. (C) Customisations for the meta-analytic models, test for excess of significance, criteria for stratification of the evidence and forest plot. (D) Results of the meta-analyses and of the stratification of the evidence. (E) Forest plot.
 Figure 4
 Illustration of the browser-based application. (A) Loading of the data set. (B) Data set formatting checks. (C) Customisations of the meta-analytic models, test for excess of significance and criteria for stratification of the evidence. (D) Results of the meta-analyses and of the stratification of the evidence. (E) Forest plot.
Main calculationsGeneral information on the meta-analysesThe umbrella() function returns a data set in which each meta-analysis (identified in the ‘Factor’ column) has its results described in its own row (therefore, each row is independent of the others). The number of studies (‘n_studies’), the total number of participants (‘total_n’), the number of cases (‘n_cases’) and the number of controls (‘n_controls’) included in the meta-analyses are presented.
Meta-analytic resultsUsers are presented with the type of effect size measure used in the calculations (‘measure’), the pooled effect sizes (‘value’), their 95% CIs (‘value_CI’) and their p values (‘p_value’). Information on the I² statistics for inconsistency/heterogeneity (‘I2’) and on the 95% PI is also available. Since different factors may use different effect size measures, the umbrella() function automatically converts the pooled effect sizes and their 95% CI as well as the 95% PI into eG and eOR (respectively, ‘eG’ and ‘eOR’, ‘eG_CI’ and ‘eOR_CI’, ‘PI_eG’ and ‘PI_eOR’).
Additional calculationsRegarding small-study effects, the function performs an Egger’s test for small-study effects (the associated p value is available in the Egger_p column) and estimates whether the 95% CI of the largest study includes the null value (‘largest_eG_CI’ and ‘largest_eOR_CI’ columns). Regarding excess of significance bias, the p value of the test is available in the ‘ESB_p’ column. Moreover, the largest p value obtained in the jackknife leave-one-out analysis is reported in the ‘JK_p’ column. Last, the umbrella() function also estimates the statistical power to detect an SMD of 0.5 at an alpha of 5% based on the total number of cases and controls included in the meta-analysis (the estimated power is available in the ‘power_med’ column). Note that for IRR, the number of cases and controls for this calculation is equal to half the number of cases included in the meta-analysis. For R and Z, the number of cases and controls for this calculation is equal to half the total sample size. This analysis gives an indication on whether the number of cases and controls included in the meta-analysis gives sufficient statistical power to a single study to detect a moderate effect size.
In the JAMOVI module and in the browser-based app, the results of this function are presented on the main page (see figures 3D and 4D).
Stratification of the evidenceIn this example, we used personalised criteria to stratify the evidence. Note that these criteria are used for illustrative purposes and are not intended to be guidelines on the criteria that should be applied in an umbrella review. As can been seen in figure 2, we requested that:
A Class I can be achieved if the total number of studies is strictly larger than 30, the p value of the meta-analysis is strictly lower than 0.005, the inconsistency/heterogeneity is strictly lower than 50%, the Egger’s test for small-study effects is not significant (p>0.05) and the maximum p value achieved in the jackknife analysis remains statistically significant (p<0.05).
A Class II can be achieved if the total number of studies is strictly larger than 20, the p value of the meta-analysis is strictly lower than 0.005, the Egger’s test for small-study effects is not significant (p>0.05) and the maximum p value achieved in the jackknife meta-analysis remains statistically significant (p<0.05).
A Class III can be achieved if the total number of studies is strictly larger than 15, the p value of the meta-analysis is strictly lower than 0.01 and the Egger’s test for small-study effects is not significant (p>0.05).
A Class IV can be achieved if the p value of the meta-analysis is strictly lower than 0.05.
A Class V is automatically assigned if the criteria for Classes I–IV are not met.
In the JAMOVI module and in the browser-based app, the results of this function are presented in the same table as the results of the umbrella() function (see figures 3D and 4D).
Graphical presentation of the resultsOnce the calculations needed for an umbrella review and the stratification of the evidence are completed, users can obtain a graphical presentation of the results using the forest() function. Users can improve the basic figure by using the arguments of the forest() function. For this example, we generate a forest plot that contains information on the stratification of evidence (according to the personalised classification), and in which two columns and a title for the plot have been added ().
In the JAMOVI module and in the browser-based app, a basic forest plot is automatically generated and can be customized (see figures 3E and 4E).
DiscussionUmbrella reviews are an emerging type of evidence synthesis that summarises and stratifies the quality or strength of the evidence from previous systematic reviews or meta-analyses conducted on a given topic. The metaumbrella suite presented in this manuscript is the first ensemble suite including specific tools dedicated to data analysis in umbrella reviews with stratification of the evidence. This comprehensive suite includes an R package, which requires mastering a programming language, and two associated open-access, GUI-based platforms: a JAMOVI module and a browser-based application (https://metaumbrella.org/). These two GUI-based platforms allow users to access the functions of the R metaumbrella package with a few mouse clicks, thus enabling them to a prompt completion of umbrella reviews. These facilities will assist end users’ experience of conducting umbrella reviews in the large community, thus supporting the next generation of evidence-based synthesis.
There are currently no universal methods or criteria to stratify the evidence that can be applied to all umbrella reviews, and the existing literature is somewhat scattered by methodological inconsistencies. Consequently, an important focus in the development of our tools has been to offer a wide range of customisations to adapt to user needs and future methodological improvements in this area. For example, users are provided with 13 personalised criteria for stratifying the evidence, some of which are based on the results of statistical analyses (eg, presence of small-study effects), while others are based on information specifically collected/generated during the systematic reviews (eg, methodological quality of primary studies).
As umbrella reviews are a relatively new approach compared with standard systematic reviews or meta-analyses, many developments are still ongoing. For example, a growing number of umbrella reviews focus on meta-analyses of prevalence or include network meta-analyses. In addition, new tools, such as Graphical Representation of Overlap for OVErviews (GROOVE)30 to identify the overlap of primary studies between reviews, are emerging. These developments, which are currently not available in metaumbrella, may constitute avenues for improvement in the future and could easily be incorporated in new versions of metaumbrella.
Ethics statementsPatient consent for publication
留言 (0)