
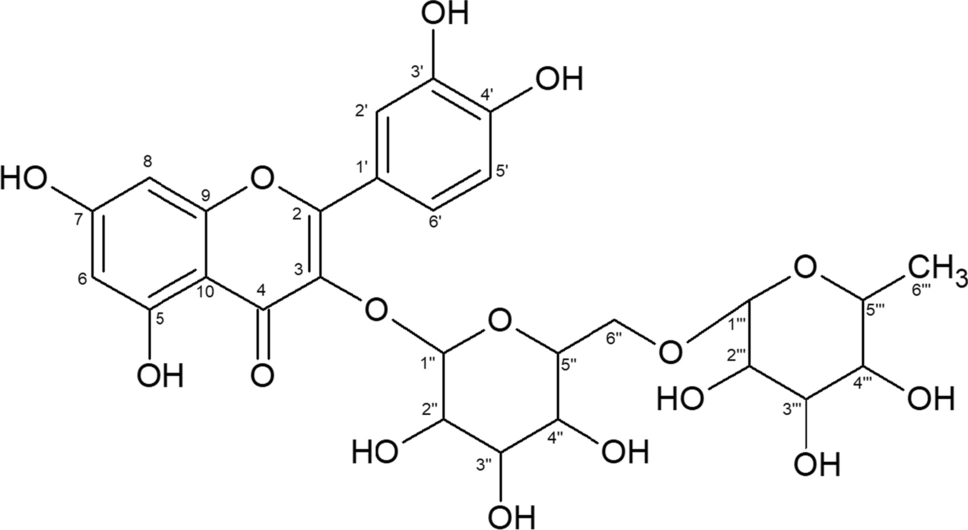
記住我

The therapeutic combination of TIN and CIP has a significant impact and is widely prescribed to treat a variety of diseases caused by bacteria or protozoa such as chronic refractory pouchitis [4]. The suggested HPTLC method proved to be successful in separating the two co-formulated medicines in pure form or in tablet pharmaceutical formulations. For separation and quantification of the two medicines examined, several reagent mixes were used as mobile phases. The separation of the examined pharmaceuticals was achieved using a mobile phase comprising of acetone, ethanol, ethyl acetate, and sodium dodecyl sulfate. Other mobile phases that have been studied have resulted in unsatisfactory separation of the analytes. As a result, we found that a mobile phase made up of acetone, ethanol, and 2% watery sodium dodecyl sulfate (3:4:2, V/V) yielded sharp, symmetric, and non-tailed analytes peaks. The separated medicines showed RF values of (0.22 ± 0.009) and (0.42 ± 0.007) for TIN and CIP, respectively, after being eluted by the selected mobile phase for 5 min (Figs. 2 and 3). For investigation, the densitometric scanner was set to 310 nm. Furthermore, it was discovered that activating the HPTLC plates at 60 °C for 10 min before spotting the sample improved both peak form and repeatability of the suggested approach.
Fig. 2
A typical 3D HPTLC calibration chromatogram of A TIN (25, 100, 250, 500, and 1000 ng/spot), B CIP (80, 100, 250, 500, and 1000 ng/spot), and C mix of TIN and CIP, using acetone–ethanol–2% watery sodium dodecyl sulfate (3:4:2, V/V)
Fig. 3
A typical 2D HPTLC calibration chromatogram of A TIN (60 ng/band), B TIN (250 ng/band), C TIN (750 ng/band), D CIP (80 ng/band), E CIP (450 ng/band), F CIP (900 ng/band); laboratory-prepared mixtures of G TIN (85 ng/band), CIP (75 ng/band), H TIN (250 ng/band), CIP (250 ng/band), I TIN (600 ng/band), CIP (500 ng/band), J TIN (250 ng/band), CIP (750 ng/band), K TIN (400 ng/band), CIP (850 ng/band), using acetone–ethanol–2% watery sodium dodecyl sulfate (3:4:2, V/V)
Furthermore, the selected mobile phase comprises a high proportion of sodium dodecyl sulfate, resulting in a micellar mobile phase, which improves the sensitivity of the proposed analytical approach by forming micellar structures with the analytes. Furthermore, because most analysts want to employ environmentally friendly methods in drug analysis, our approach differs from other typical HPTLC methods by using micellar green mobile phase.
3.2 Evaluation of greenness of the HPTLC analytical methodThere is now a variety of tools available to assess and compare the greenness of various analytical techniques. In comparison to the prior analytical eco-scale [26], the new green analytical procedure index (GAPI) [26, 27] has the distinct benefit of spanning the whole analytical method. It has five pentagrams, each defining a stage in the analytical approach, such as sample collection and preparation, reagents, and solvents, applied instruments, and the analytical technique’s purpose. GAPI has three color codes, with red indicating a high environmental hazard and yellow and green indicating a lesser hazard and improved greenness. The suggested HPTLC approach was compared to five existing processes that had previously been published. Figure 4 depicts the GAPI which compares the proposed methodology to five previously published analytical methods for the quantification of TIN and CIP. Three of these procedures [12,13,14] employed acetonitrile as an organic solvent, whereas one approach [10] used methanol. As can be seen in Fig. 4a, the suggested technique contains seven green and eight yellow pentagrams, with no red pentagrams in its GAPI. The previously disclosed approaches (b, c, d, e, and f), on the other hand, contain 4, 1, 4, 4, and 5 red pentagrams, respectively, indicating substantial environmental risks. When compared to other previously published chromatographic techniques, the suggested HPTLC method is a green eco-friendly approach, according to the GAPI pentagrams. The main differences from previous procedures was the absence of the extraction step, which is the most inconvenient stage for most analysts, the use of green micellar solvents, the use of lower energy consumption instrumentation, and lower waste production, which can be easily recycled by using it for elution multiple times with multiple TLC plates.
Fig. 4
GAPI pictograms for a the proposed method and previously reported methods, b for Ref. [10], c for Ref. [11], d for Ref. [12], e for Ref. [13], and f for Ref. [14]. The red zones represent high ecological impact, yellow zones represents lower impact, and green zones represent safe effect to environment
AGREE [28] is another assessment tool that has been recently introduced on the color code based in GAPI. The main difference from GAPI is that it was based on the twelve green analytical chemistry (GAC) principles. AGREE shows a clock-shaped pictogram, the perimeter of which is divided into twelve sections, each corresponding to a GAC principle. The center of the pictogram shows a numerical value estimating the ecological impact, where the closer to 1, the better is the impact. As shown in Fig. 5, AGREE shows low ecological impact as expressed by the numerical 0.82 value. The perimeter is almost greener, except for the third GAC principle concerned with off-line sampling which is unavoidable as clarified in GAPI pictogram discussion. In the case of using the proposed method for pharmaceutical dosage form analysis, the method would be totally green due to the absence of any required organic solvents. The use of low energy HPTLC equipment, its higher throughput, and simple sample preparation procedures without the need for derivatizing agents account for the better environmentally friendly behavior of the proposed methodology.
Fig. 5
AGREE pictograms for a the proposed method and previously reported methods, b for Ref. [10], c for Ref. [11], d for Ref. [12], e for Ref. [13], and f for Ref. [14]
3.3 Validation of the proposed HPTLC methodThe HPTLC technique was fully verified for accuracy, precision, linearity, limit of quantification (LOQ), limit of detection (LOD), robustness, and selectivity in accordance with the International Council for Harmonisation (ICH) [29].
3.3.1 Linearity and rangeThe linearity of the proposed HPTLC technique was tested using six concentration points (25, 100, 250, 500, 700, and 1000 ng/spot for TIN and 80, 100, 250, 500, 750, and 1000 ng/spot for CIP), with each concentration being repeated three times and the mean of the three values being determined. The calibration graphs for the substances under investigation were created by graphing the area under the peak vs the relevant drug concentration.
The statistical treatment of the data using regression analysis established the analytical parameters (Table 1).
$$ A_}}} = .C - .\qquad r = \, 0.\qquad \left( \text\ \text\ \text\ \text \right) $$
$$ A_}}} = .C - .\qquad r = \, 0.\qquad \left( } \right) $$
where A represents the peak area, C represents the drug concentration in ng/band, and r represents the correlation coefficients.
Table 1 Analytical parameters for the analysis of TIN and CIP by the proposed HPTLC methodThe two formulas, LOD = 3.3σ/S and LOQ = 10σ/S according to ICH guidelines [29, 30], where σ is the standard deviation of the intercept and S is the slope of the calibration graph, are used to determine both LOD and LOQ. LOD values for TIN and CIP were 6.7 and 25.03 ng/band, respectively, while LOQ values for TIN and CIP were 20.3 and 75.34 ng/band, respectively.
3.3.2 Accuracy and precisionWithin the analytical range of each of the investigated pharmaceuticals, the accuracy of the developed HPTLC technique was assessed at five concentration levels (150, 250, 400, 500, and 800 ng/band) (triple measurements of each concentration). The percentage of recovery and standard deviation of the measurements are displayed in Table 2. The findings show that the proposed approach is quite accurate.
Table 2 Evaluation of the accuracy of the proposed HPTLC procedure for the determination of TIN and CIP at five concentration levels within the specified rangeThe precision of the analytical procedure, on the other hand, was assessed by calculating both intra-day and inter-day precision. Three concentration levels of each medication were used to determine intra-day accuracy, and each concentration was reproduced three times on the same day (repeatability). Following development, the inter-day precision of each medication was assessed using three concentration levels; each concentration was repeated three times over three days, and each sample injection volume was repeated three times (intermediate precision). The findings (Table 3) show that the suggested analytical approach has good accuracy at both the inter-day and intra-day levels.
Table 3 Evaluation of the intra-day and inter-day precision of the proposed HPTLC method for the determination of TIN and CIP in pure form3.3.3 Method selectivityFor approval of the suggested analytical technique’s selectivity, several laboratory-prepared mixtures of the studied pharmaceuticals were analyzed using the proposed analytical technique. The obtained data, given in Table 4, show that the examined medicines had a high percent recovery rate, indicating their selectivity [18, 31, 32]
Table 4 Determination of TIN and CIP in laboratory-prepared mixtures using the proposed HPTLC method3.3.4 Method robustnessTo test the robustness of the suggested approach, it was utilized to analyses of the researched medicines using the proposed analytical methods but with a modest variation in the mobile phase composition. Any modification in the mobile phase composition results in a modest change in the RF value of the investigated but no change in the area under peak, according to the findings (Table 5).
Table 5 Robustness study of the proposed HPTLC method for the determination of TIN and CIP (100, 250 ng/spot) in pure form3.3.5 Application to pharmaceutical formulationThe suggested analytical approach was shown to be effective in analyzing the medicines investigated in their pharmaceutical dosage formulation. The method’s selectivity was tested by looking for any effects from tablet excipients. The results show that tablet excipients did not cause any interference, confirming the accuracy of the suggested approach. The resulting findings were compared to those obtained using the previously described method [10]. In terms of precision and accuracy, Student’s t test and F test are used. Table 6 shows that there was no significant difference in the results produced from both approaches, as demonstrated by Student’s t test and F test, because the calculated values did not exceed the theoretical values at the 95% confidence level. This demonstrates the suggested method’s great precision and accuracy.
Table 6 Application of the proposed HPTLC method for the determination of TIN and CIP in tablet dosage form (A) and spiked human plasma (B)3.3.6 Spiked human plasmaWith excellent success, the proposed technique was employed to analyze the investigated medicines in spiking human plasma. The regression equation for each drug was used to determine its concentration. The standard solutions of the studied drugs were spiked into human plasma at concentrations of 100, 250, and 500 ng. The results are shown in Table 6. The mean percent of recoveries of the tested drugs concentration in plasma ranged from 98.5 to 99.4, with standard deviations ranging from 0.27 to 0.82, demonstrating that the pharmaceuticals studied may be identified properly and precisely in spiked human plasma without interference.
留言 (0)