
記住我


Low socioeconomic status (SES) has been associated with a higher risk of cardiovascular disease (CVD),1 cardiovascular mortality, all-cause mortality2 and recurrence of cardiovascular events.3 This association was proved to be consistent between countries of different income levels,4 and states and regions of different developmental paces.5 6 It would be natural to presume that improvement in SES could lower the risk of adverse cardiovascular outcomes. However, among the few research that discussed SES shift and cardiovascular outcomes, inconsistent conclusions were drawn.7–9 Most studies concerning effects of SES shift adopted a life-course approach that observed intergenerational change, which might not fully reflected patterns of SES shift in the fast-changing modern world.10–12 Some discussed certain aspects of SES, like income shift13–15 or occupational shift,16 17 which might not reflect SES shift on the full scale.
Until now, most of the studies that focused on association between SES shift and cardiovascular outcome were from high-income, developed countries. Few studies were from middle-income or low-income, developing countries, and none had investigated the association between SES shift and cardiovascular outcomes in China. Carried by its wave of fast development, China’s population had also gone through rapid SES changes. We; therefore, present findings on association between short-term SES shift and long-term cardiovascular outcomes, using baseline and resurvey data from China Kadoorie Biobank (CKB).
MethodsStudy populationDetails of CKB study design and characteristics of the study participants have been described elsewhere.18 19 In brief, 512 891 participants aged 30–79 years were recruited between 2004 and 2008 from five urban and five rural regions in China. During August and October 2008, a resurvey was undertaken in these regions by randomly chosen 5% (n=19 788) of the surviving participants. In this study, we included participants who had completed the resurvey. After excluding those who had a history of heart disease or stroke at baseline, and those who had a cardiovascular event before the resurvey, a total of 18 672 participants were included in the final analysis.
Assessment of SESUsual indicators of SES included education, income, and occupation. In China, Urban Employee Basic Medical Insurance and New Rural Cooperative Medical Scheme were introduced in 1998 and 2003 nationwidely. Therefore, we included healthcare cover as a fourth indicator of SES apart from self-reported highest level of education, current occupation, and household income. For better model fit and more intelligible results, level of education and household income were each divided into three categories. Occupation was also divided into three categories according to standard international socio-economic index of occupational status by Ganzeboom et al.20 Using SAS V.9.4 PROC LCA procedure,21 22 repeated-measures latent class analysis was performed to generate SES classes at baseline and resurvey, for measurement invariance did not hold when latent transition analysis was applied. SES shift was determined by subtracting an individual’s baseline SES class from his/her resurvey SES class. For individuals with upshift or downshift of three SES classes were rare, they were merged with individuals with upshift or downshift of two SES classes. Therefore, five SES shifting patterns were identified: sharp downshift (SES downshift of two or more classes from baseline to resurvey), moderate downshift (SES downshift of one class from baseline to resurvey), sharp upshift (SES upshift of two or more classes from baseline to resurvey), moderate upshift (SES upshift of one class from baseline to resurvey), and stable, which referred to no SES shift. Detailed description of recategorising of SES indicators and latent class analysis is presented in online supplemental methods.
Assessment of cardiovascular outcomesVital status of all participants was regularly monitored through national Disease Surveillance Points system and regional Centers for Disease Control and Prevention. All deaths were coded using the 10th International Classification of Disease (ICD-10) by trained staff blinded to baseline information. Information on disease incidence for stroke and ischaemic heart disease was collected through linkage with established disease registries or national health insurance claim databases. Medical records of cases were retrieved and reviewed for confirmation and supplementary purpose. For this study, three main outcome measures were examined, including cardiovascular death (ICD-10 code I01–I25, I27–I88 and I95–I99), incidence of major coronary events (MCEs) (code I20 to I25, plus nonfatal myocardial infarction (code I21), and strokes, including haemorrhagic stroke (code I61) and ischaemic stroke (code I63).23 For all participants, follow-up lasted until 31 December 2015 unless censored.
Statistical analysisBaseline characteristics were described as means and SD or percentages, for the total population and across different patterns of SES shift.
Proportional hazards assumption was examined using Shoenfeld residuals, and significant deviation from the assumption was found in several covariates for different cardiovascular outcomes. For the convenience of model fitting and result interpreting, we adopted accelerated failure time (AFT) models to estimate the survival time ratios and their 95% CIs for different groups of SES shift,24 using the group with no SES shift as reference. Nevertheless, Cox regression analysis was performed by introducing covariates that violated the proportional hazards assumption as time-varying covariates into the model, with intention to validate the results from AFT analysis. Person-years were calculated from baseline until the date of death or incidence, or end of follow-up, whichever occurred first. Incidence rate per 1000 person-years were calculated by dividing number of events by person-years then multiplied by 1000. For each indicator of SES, the association of their own shifting status and cardiovascular outcomes was also examined. Subgroup analysis was performed according to different baseline characteristics, by comparing the most upshift group to the most downshift group in SES classes. Tests for interaction between covariates and SES shift were performed using likelihood ratio tests, which compared models with and without cross-product terms.
All analyses were performed using R V.4.0.2. We considered two-sided p<0.05 to be significant.
Patient and public involvementPublic data of individuals with no traceable private information were used in this research. No patient was involved in the design, conduct or dissemination of this research.
ResultsPopulation characteristicsA total of 18 846 participants without CVD completed the first resurvey. Among them, 174 had an incidence before the resurvey, and were therefore excluded from the final analysis. Table 1 shows the baseline characteristics of these participants according to their shift in SES from baseline to the resurvey. Among all participants, 10 273 (55%) did not shift from their baseline SES, 7763 (41.6%) shifted towards higher SES and 636 (3.4%) shifted towards lower SES. Population with SES downshift were more likely to be older and overweight at baseline. Notably, population with sharp downshift and moderate downshift in SES were distinct from each other in several characteristics, including gender, family history, hypertension and diabetes morbidity rate, marital status, and drinking and smoking status, with population with sharp downshift more likely to be female, without family history of CVDs, diagnosed with hypertension or diabetes, unmarried and not drinking and smoking at baseline. Baseline characteristics of SES indicators were presented in online supplemental table 1.
Table 1Baseline characteristics of participants according to SES shift patterns
Latent classes characteristicsWe chose a four-latent-class model for both baseline and resurvey latent class analyses (see online supplemental methods), with latent class one indicating the lowest SES and latent class four the highest. At both times, latent class three was the most prevalent (40% at baseline and 70% at resurvey). The least prevalent class changed from latent class four (11%) at baseline to latent class two (6%) at resurvey. The prevalence of latent class one and latent class two both dropped while that of latent class three and latent class four rose, indicating an overall upward shift of SES of the study population. The overall patterns of item-response probabilities of each latent class were largely similar between baseline and resurvey (online supplemental table 2).
Association of SES shift with cardiovascular outcomesThe mean time gap between baseline and resurvey was 2.6 years. During a mean follow-up of 9.8 years, 517 deaths from cardiovascular causes, 221 MCEs and 1316 stroke events (1160 ischaemic stroke and 156 haemorrhagic stroke) were recorded. Kaplan-Meier survival curves of cardiovascular deaths and MCEs showed that survival probability between groups of different baseline SES and SES shift decreased non-proportionally. The overall survival probability of the population was high. There was a gradient association between baseline SES and survival probability, with individuals of the lowest baseline SES having the lowest survival probability (figure 1). Survival probability of individuals with sharp downshift of SES decreased the fastest and ended up the lowest, followed by that of individuals with sharp upshift of SES (figure 2). Survival probability of individuals whose SES shifted moderately downward or upward decreased the slowest and ended up the highest two. We also compared survival probabilities between population groups that were stably high in SES (latent class three and four) and groups that shifted from low SES to high SES, and between groups that were stably low in SES (latent class one and two) and groups that shifted from high SES to low SES (figure 3). Results showed that no significant difference in survival probability between groups were found.
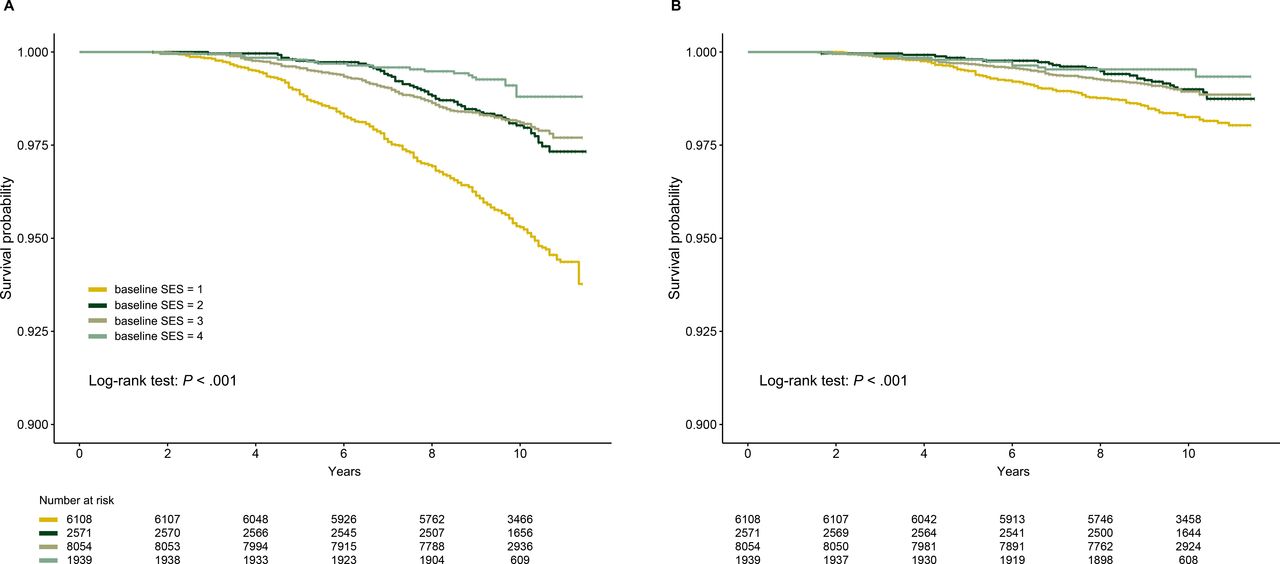 Figure 1
 Kaplan-Meier survival curves of different baseline SES for (A) cardiovascular deaths and (B) major coronary events. SES, socioeconomic status.
 Figure 2
 Kaplan-Meier survival curves of different patterns of SES shift for (A) cardiovascular deaths and (B) major coronary events. SES, socioeconomic status.
 Figure 3
 (A, B) Kaplan-Meier survival curves of participants who were stable in high SES and who had shifted up to high SES for (A) cardiovascular deaths and (B) major coronary events; (C, D) Kaplan-Meier survival curves of participants who were stable in low SES and who had shifted down to low SES for (C) cardiovascular deaths, and (D) major coronary events. SES, socioeconomic status.
In AFT analysis, the association of SES shift and cardiovascular outcomes was measured by survival time ratio, which compared time-to-event variables between groups on the log scale. A survival time ratio less than one indicated shorter survival time while one greater than one indicated longer survival time. In this study, individuals with no SES shift were used as the reference group. After adjusting for baseline age, gender, BMI group, marital status, region of residence, smoking status, alcohol consumption status, self-rated health status, family history of CVDs, diagnosis of hypertension, diagnosis of diabetes mellitus, total daily physical activity, and baseline SES, results showed that the event-free survival time of individuals with sharp SES downshift comparing to individuals with no SES shift was significantly shorter before cardiovascular deaths (0.73 (95% CI 0.57 to 0.95), p=0.02) and MCEs (0.52 (95% CI 0.35 to 0.76,p<0.001)). For individuals with moderate and sharp SES upshift, event-free survival time before cardiovascular deaths and MCEs was significantly longer than those with no SES shift (1.48 times and 1.24 times for cardiovascular death, p=0.0027 and p<0.001; 1.73 times and 1.31 times for MCEs, p=0.0079 and p=0.009). No significant effect on event-free survival time before a cardiovascular outcome occurred was seen for moderate SES downshift pattern (table 2). Results from Cox regression analysis that accounted for time-varying covariates were consistent (online supplemental table 3). Subgroup analysis showed that association between SES upshift and cardiovascular death or MCE differed between population of different alcohol consumption behaviours, self-rated health status, marital status and BMI groups (online supplemental figure).
Table 2Incidence rates and adjusted survival time ratios for different cardiovascular outcomes according to SES shift
For each SES indicator, we also ran AFT analyses. Moderate downshift of household income was associated with 27% shorter event-free survival time before MCEs. Moderate upshift in occupation and getting covered by health insurance were associated with 21% and 10% longer event-free survival time before stroke (online supplemental table 4).
DiscussionWe found that in this Chinese cohort, short-term upshift of SES was associated with prolonged event-free survival time before cardiovascular deaths and MCEs, and this association was stronger in participants with better alcohol consumption behaviour, lower BMI, higher self-rated health status and participants who were married. Short-term sharp downshift of SES was associated with shortened event-free survival time before cardiovascular deaths and MCEs occurred, while moderate downshift did not have the same effect.
The association of low SES and worse cardiovascular outcomes has been well-established. Analyses based on two large cohort, US National Health and Nutrition Examination Survey (US NHANES) and UK Biobank showed that low SES increased the risk of all-cause mortality and cardiovascular death for 1.69–2.36 folds.25 A meta-analysis focusing on Asian population showed that socioeconomic disadvantages, characterised by low education and low income, were associated with higher risk of all-cause and cardiovascular mortality.26
Our study confirmed this inverse association between baseline SES and cardiovascular outcomes, and above that, pointed out that upward SES shift could to some extent modify the unfavourable cardiovascular outcome associated with low baseline SES. As could be seen from the baseline characteristics, participants with upshift SES were mainly in low or low to medium SES at baseline, and had more cardiovascular risk factors and behaviours comparing to participant with sharp SES downshift.27 However, through upward SES shift, these participants survived 1.24–1.73 times longer before an event occurred, despite their SES disadvantages at baseline. Nevertheless, the effect of baseline SES also counted. Participants with moderate SES downshift, comparing to participants with sharp SES downshift, had some more unfavourable cardiovascular risk factors and behaviours including family history, drinking and smoking, but were overall higher in baseline SES. These participants did not suffer from shortened event-free survival time, although they had gone through SES downshift. It seemed that the hazard from moderate SES downshift was buffered out by their overall high baseline SES.
Previous studies have shown through combined or single socioeconomic indicators that SES shift could affect health-related outcomes. A longitudinal study based on Italian population, using educational and material achievements as measurement of SES, found that population with stably low SES experienced 56% and 58% increased risk of all-cause and CVD death, while the risk-lowering effect of upshift SES was not significant for CVD death in population with low baseline SES.8 Same findings were reported in a study based on older people in England, combining occupation, education and wealth into an SES index,10 and another Finland study using life-course approach.28 Other studies had used occupational trajectory or income change as surrogates for SES shift. A longitudinal study based on over 0.6 million French individuals found that an increase in time spent in the clerk class increased the risk of cardiovascular mortality compared with that in the upper class.16 Another study, also based on French cohort, found that intergenerational upshift of occupational grade was associated with a more than 50% lowered risk of premature death.12 A study from Korea showed that upshift income was associated with lower risk of cardiovascular mortality, while downward shift did not exert significant effect.13 Another study from the USA reported that income volatility and income drops were independently associated with a nearly twofold risk of CVD and all-cause mortality.14
Our study was consistent with previous studies in that downshift SES, reflected by combined socioeconomic indicators, increased the risk of cardiovascular events, and that an upshift in SES, even a moderate one, could lead to longer event-free survival time. When it came to each single indicator of SES and cardiovascular outcomes, not much significant association was found comparing to previous studies. One of the reasons for this weak association might be that different indicators of SES acted as a whole in their short-term effect on cardiovascular outcomes,27 and that it requires longer time for shift of each SES indicator to have substantial effect on health outcomes, especially for items like education.29 Some have also suggested that class differences could sustain and outlive short-term changes in income or occupation, therefore, preventing rapid changes of socioeconomic class for individuals.30 The effect of higher SES on health outcomes were often not exerted directly, but through other health-related factors, including lifestyle and health behaviours,25 power and affordability to secure health resources and better living environment, capability against risks and support from members in the same socioeconomic class, etc.31 This delay effect from single SES indicator on overall SES, and from SES on health outcomes may be better revealed given longer span of observation.
Some other studies had pointed out that when comparing socioeconomically mobile and stable individuals, those who had shifted upwardly in SES bore higher risk of mortality than those who were stable in relatively high SES; and those who had shifted downwardly in SES bore higher risk of mortality than those who were stable in relatively low SES.9 In our study, we did not find such difference in risk of cardiovascular deaths or MCEs, probably due to short follow-up time and smaller sample of population.
For our study only concerned short-term SES shift, it was distinct from studies using life-course approaches, which investigated the influence of cross-decade or cross-generation SES. However, it was suggested that adult socioeconomic indicators were more important than childhood socioeconomic circumstances.11 28 Therefore, short-term SES shift in adulthood could also have substantial impact on one’s health condition.
Strengths and limitationsTo our knowledge, this is the first study to assess SES shift and cardiovascular outcomes in low-income and middle-income countries, represented by Chinese population. This cohort comprised Chinese individuals from several regions of different socioeconomic levels, was therefore highly representative of the population. We used latent class analysis to obtain a relatively objective distinction of SES, based on different dimensions of socioeconomic characteristics.
Nevertheless, we acknowledge several limitations. First, information on the measurement items of SES was self-reported, thus measurement errors were inevitable. Second, the time gap between baseline and resurvey was relatively short, more cases and patterns of SES shift might be observed had there been more waves of resurvey in a longer time span. Third, we did not account for the effect of individual’s neighbourhood environmental factors, which are also among markers for SES.32 Further research is needed to investigate the association between SES shift, represented by a fuller range of potential markers,33 and cardiovascular outcomes. Fourth, for this study only included individuals who both participated in baseline survey and resurvey, it cannot be ruled out that some individuals with worse SES shifting patterns might have died before the resurvey, therefore, leading to survivorship bias. Fifth, the number of events for some SES shifting groups in this study was relatively insufficient, which might impair the power to obtain more significant findings. Sixth, the sample size of sharp downshift SES group was small, which might impair the reliability of its significant association with worse cardiovascular outcomes. When combined and analysed as one group, downshift SES was no longer significantly associated with shorter event-free survival time while the trend still existed (cardiovascular deaths: 0.92, (95% CI 0.72 to 1.17); MCEs: 0.72, (95% CI 0.50 to 1.05)). Due to distinct characteristics between participants with sharp downshift SES and moderate downshift SES, we presented and analysed their data as separate groups, nevertheless, the result should be interpreted with caution. Further investigation of downshift SES in larger population groups is needed.
留言 (0)