
記住我


The study included 90 Chinese patients with primary AM who underwent surgery at our hospital. The clinicopathological features of the cohort were summarized in Table 1. The median age of diagnosis was 62 years (38–86 years), and 55 (61.1%) patients were females. The majority of patients presented with stage II (41/90, 45.6%) and stage III (35/90, 38.9%) disease. A high proportion of patients presented Breslow thickness > 4.0 mm (41.1%). Of the patients with known histology, ALM was the most common histological subtype, which accounted for 44.4% (40/90) of the entire cohort. Other subtypes included nodular melanoma (NM) (30, 33.3%), superficial spreading melanoma (10, 11.1%) and one case of lentigo maligna melanoma. Most lesions were located in the feet (79, 87.8%) and a few in the hands (11, 12.2%). The incidence of ulcers at the primary sites was 62.2%. None of the patients had received any anti-tumor treatment prior to surgery. Following surgical resection, sixty-six (73.3%) patients received treatments, including interferon, interferon combined with other drugs, chemotherapy, and anti-PD-1 therapy. The median follow-up time was 34 months (range: 5–114 months). The median disease-free survival (mDFS) was 21.3 months and estimated median overall survival (mOS) was 60 months. At the last follow-up, 36 patients had died.
Table 1 Clinical characteristics of all patients (N = 90)Through multivariate analysis, we found several clinical features independently associated with clinical outcome (Table 2). As expected, patients with more advanced stage diseases (stages III and IV) had worse survival compared with those with earlier stages (stages I and II)(HR = 2.57, 95% CI 1.25–5.29, p = 0.01). Also, most patients had derived clinical benefit from post-surgical treatments compared with those who only underwent surgery (HR = 0.36, 95% CI 0.17–0.76, p = 0.01). In addition, we also found that patients with Breslow thickness > 4.0 mm had worse survival than those with Breslow thickness ≤ 4.0 mm (HR = 3.43, 95% CI 1.51–7.82, p < 0.01). Patients with older ages also had poorer survival compared with younger patients (HR = 2.77, 95% CI 1.22–6.28, p = 0.02).
Table 2 Univariate and multivariate analyses of factors associated with overall survivalMutational landscape of AM patientsThe top frequently altered genes in the 83 patients who had evaluable NGS results were illustrated in Fig. 1. Overall, a low TMB was observed, with a median TMB of 2.4 muts/Mb (range 0.0–15.90 muts/Mb). BRAF, NRAS, and KIT were most commonly altered, with respective alteration frequencies of 14.5%, 12.0%, and 16.9%. In particular, BRAF p.V600E and NRAS p.Q61K/R were the most common driver mutations, found in eight and seven patients, respectively. Missense mutations accounted for 77% of these driver mutations, and 9 (17%) copy number variations (CNV) were found in KIT (n = 7), BRAF (n = 1) and NRAS (n = 1). Other variant types found in these driver genes included three indel mutations (two KIT p.P573_D579dup, and one BRAF p.T599_V600delinsRE) and one fusion gene (TRB-BRAF). In addition, mutations were also commonly found in NF1 (10.8%), APC (7.2%), and ARID2 (6%). While TMB was low, the genomic landscape of AM was characterized by a high level of CNV, which was commonly found in CCND1 (19.3%), CDK4 (19.3%), MDM2 (14.5%) and FGF19 (12%). Comparing the different histological subtypes, we found that NRAS mutations were more commonly found in the ALM subgroup (p = 0.04) while CCND1 CNVs were more enriched in the NM subgroup (p = 0.04) (Additional file 4: Table S1). No significant difference in TMB was observed between the ALM and NM subgroups.
Fig. 1
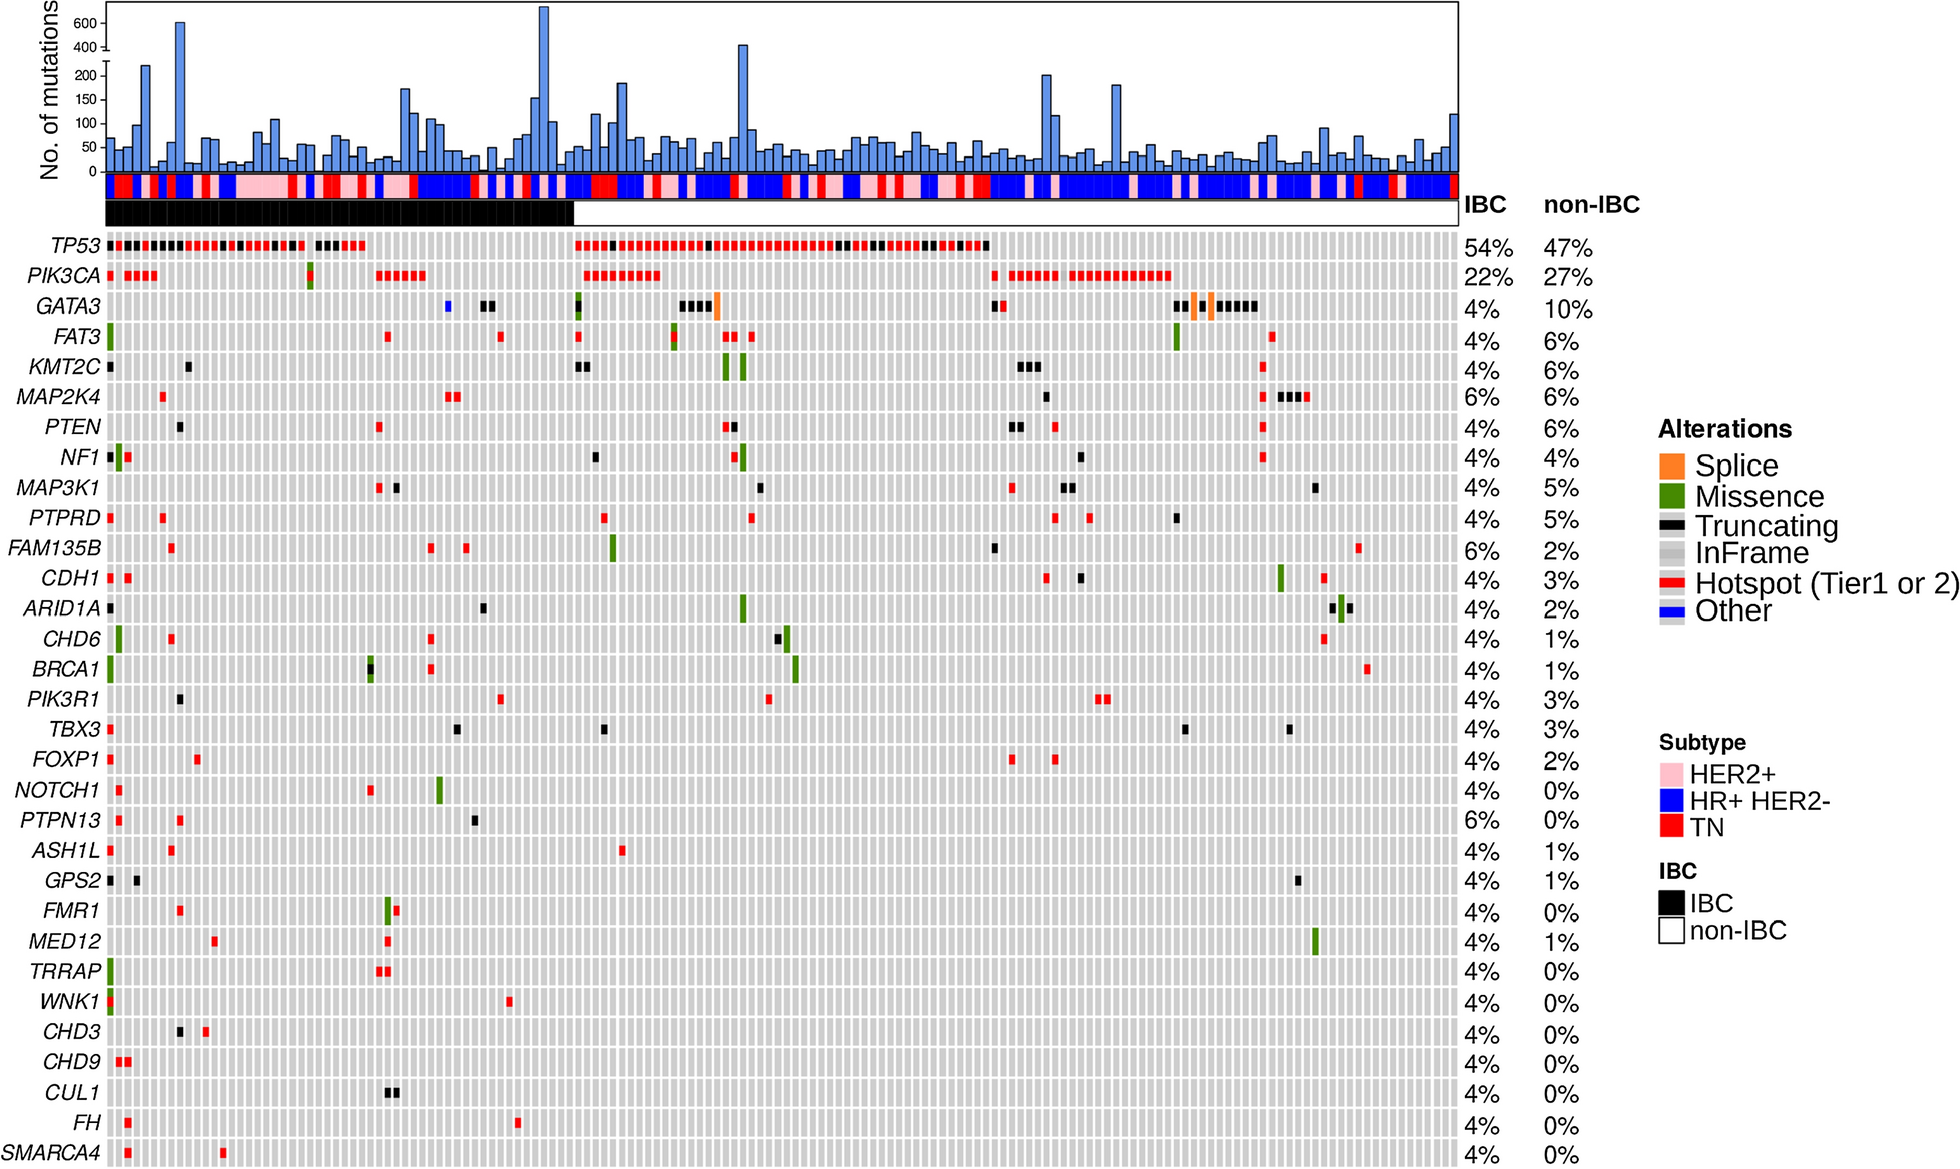
Genomic landscape of AM patients in the study (N = 83). Distributions of individual gene mutations and copy number variations in the study cohort as assessed by next-generation sequencing. Each column represents one patient. Genetic alterations were indicated in different colors according to type and clinical characteristics of each patient were shown at the top. ALM, acral lentiginous melanoma; AM, acral melanoma; NM, nodular melanoma
Associations of overall survival with genetic aberrationsTo identify putative prognostic genetic biomarkers, we performed univariate analysis of OS on genes with alteration frequencies of ≥ 3% in the study cohort. Alterations in six genes (NSD1, KDM5A, MAP3K1, ERBB3, CDK4, TERT) were significantly associated with OS (p ≤ 0.05) (Additional file 5: Table S2). Among these, TERT CNV was not suitable for subsequent multivariate analysis as all patients harboring TERT CNV were still alive at last follow-up. Multivariate analysis adjusting for clinicopathological factors on the remaining five genes revealed strong negative associations of survival with CDK4 CNV (HR = 3.61, 95% CI 1.38–9.46, p = 0.01) (Additional file 6: Table S3). Patients with CDK4 CNV exhibited markedly shorted OS compared with those without CDK4 CNV (mOS = 28.6 m vs. not reached, p = 0.0044) (Fig. 2). By contrast, patients carrying mutations in the common AM driver genes, including BRAF, NRAS, and KIT, displayed comparable survival outcomes to the wild-type patients. In addition, there was no significant survival difference comparing TMB-high and TMB-low patients (Additional file 1: Fig. S1).
Fig. 2
Kaplan Meier estimates of overall survival in AM patients. Survival plot comparing patients with and without CDK4 copy number variations (CDK4 CNV) (mOS: 28.6 m vs. not reached)
Quantitative analysis of tumor microenvironmentTo further explore potential markers of prognosis, we analyzed 69 primary AMs for the compositions of various immune cells, including CD8+ T cells, M1 macrophages, M2 macrophages, CD56 bright NK cells, and CD56 dim NK cells both in the tumor center (TC) and the invasive margin (IM) by using mIHC. Overall, AM demonstrated low levels of immune infiltration (Fig. 3A). In particular, very low levels of CD56 bright cells were detected in both the TC and IM (Fig. 3B). Comparing the immune compositions in the TC and IM, we found that CD8+ T cells (p < 0.001) and M1 macrophages (p = 0.05) were more highly enriched in the IM. No significant difference between TC and IM was found in the spatial distributions of other immune cell types, including M2 macrophages, CD56 bright NK, and CD56 dim NK cells (Fig. 3B). Significant lower levels of CD56 dim NK cells in the IM were seen in patients with primary lesions located in the hands (p = 0.05) compared with those with primary lesions located in the feet. Patients with driver mutations displayed higher levels of M2 macrophages both in the TC (p < 0.01) and IM (p < 0.01). Compared with other pathological types, M2 macrophages (p < 0.01) and CD56 bright NK cells (p < 0.05) were highly enriched in the patients with NM and ALM pathological type (Additional file 2: Fig. S2).
Fig. 3
Distribution and compositions of immune cells in melanoma environment (N = 69). A Heatmap_Distribution of immune cell compositions in the tumor center (TC) and invasive margin (IM) in AM patients. B Positive rate of immune cells in TC and IM of acral melanoma patients. Wilcoxon test was used to compare the immune compositions between TC and IM
Associations of overall survival with immune infiltrationUsing median positive rate of each immune cell type as the cutoff, we performed univariate analysis examining their associations with patient survival. We found that consistent with their roles on the immune system, higher levels of M2 macrophages in the TC was associated with poor prognosis (HR = 2.19, 95% CI 0.95–5.05, p = 0.06) (Additional file 7: Table S4), while an enrichment of M1 macrophages in the IM was correlated with favorable outcome (mOS = not reached vs. 40.1 m, HR = 0.43, 95% CI 0.20–0.95, p = 0.03) (Fig. 4 and Additional file 7: Table S4). Following adjusting for clinicopathological factors in multivariate analysis, high M1 macrophage infiltration in the IM remained significantly correlated with prolonged survival (HR = 0.42, 95% CI 0.81–1.01, p = 0.05) (Additional file 8: Table S5).
Fig. 4
Survival analysis of M1 macrophage infiltration in the IM. Kaplan Meier estimates of overall survival in acral melanoma patients with high and low positive rate of M1 macrophages in the invasive margin (IM). mOS: not reached vs. 40.1 m
Genetic aberrations and immune infiltrationFinally, we sought to determine whether there was a correlation between genetic aberrations and immune cell infiltrations in AM. Association analysis of immune cell compositions with genes (with ≥ 5% alteration frequencies), as well as TMB, revealed significant positive correlations between TMB and M1 macrophage infiltration in the TC, and CD56 dim NK cell infiltration in the IM (p < 0.05, p < 0.05) (Additional file 3: Fig. S3). We further examined the correlation of the prognosis-related genes (p < 0.1) with the infiltration of M1 macrophages in the IM. Interestingly, we found that AM patients with CDK4 amplification tended to be less infiltrated with M1 macrophages in the IM (p = 0.06) (Fig. 5).
Fig. 5
Correlation of prognosis-related genes with infiltration of M1 macrophages in the IM. A Influence of nine putative prognostic genetic markers on the positive rate of M1 macrophages in the invasive margin (IM). The degree of co-occurrence (green) or mutual exclusivity (pink) among factors were indicated by the color gradient. p value was calculated by log-rank test. B The correlation of CDK4 copy number variations (CDK4 CNV) and the positive rate (PR) of M1 macrophages in the IM. The number and proportion of patients were indicated on the top of the bar chart. p value was calculated by Chi-square test
留言 (0)