
記住我


Myelin oligodendrocyte glycoprotein (MOG) is a glycoprotein expressed on oligodendrocytes and is a minor component forming the myelin sheath in the central nervous system (1). The immune attack in MOG antibody disease (MOGAD) is associated with myelin and oligodendrocyte damage, resulting in heterogeneous clinical manifestations such as optic neuritis (ON), reduced/loss of vision, myelitis, seizures, brainstem syndromes, and encephalitis (2–4). To date, it is suggested that clinical manifestations in MOGAD differ from multiple sclerosis (MS) (5) but overlap with aquaporin-4 antibody seropositive neuromyelitis optica spectrum disorder (NMOSD AQP4+) (6, 7); optic neuritis and acute myelitis in MOGAD have similarities with clinical manifestations of NMOSD and can only be distinguished by detecting MOG antibodies. Even though testing for MOG antibodies can help differentiate these disorders, MOG testing is time-consuming and not available in most countries; moreover, albeit testing of MOG antibodies is very precise (8), false positives can still arise due to its low prevalence worldwide even in individuals with demyelinating disorders with ON (9, 10). MOGAD and NMOSD have different pathological mechanisms and different target cell damage. Given the different clinical outcomes and treatment strategies between NMOSD and MOGAD, accurate monitoring and evaluation would facilitate optimal treatment decisions and prognosis prediction. Thus, it would be supportive to have other modalities that may help in the quick and early identification of patients with MOGAD and help differentiate it from NMOSD.
Accumulating reports (10, 11) suggested that MOGAD with ON has recurrent and wide-range optic disc edema at the beginning of the disease cascade when compared with NMOSD; these optic nerve head changes cause severe neuroaxonal and microvascular impairment in the retina. Optical coherence tomography (OCT)/OCT angiography (OCTA) can quantify the retinal structural thickness and microvascular density changes and may serve as a reliable tool to differentiate MOGAD from NMOSD.
In this observational cross-sectional study, we utilized the swept-source OCT (SS-OCT) and SS-OCTA to characterize the retinal structural and microvascular changes in NMOSD and MOGAD patients when compared with controls; we also explored the association between OCT/OCTA parameters in MOGAD and NMOSD with their disease duration, disability, and visual acuity.
MethodsThis exploratory cross-sectional observational study was approved by the Institutional Review Board of West China Hospital, Sichuan, China, and all participants provided written informed consent before enrolling in our study.
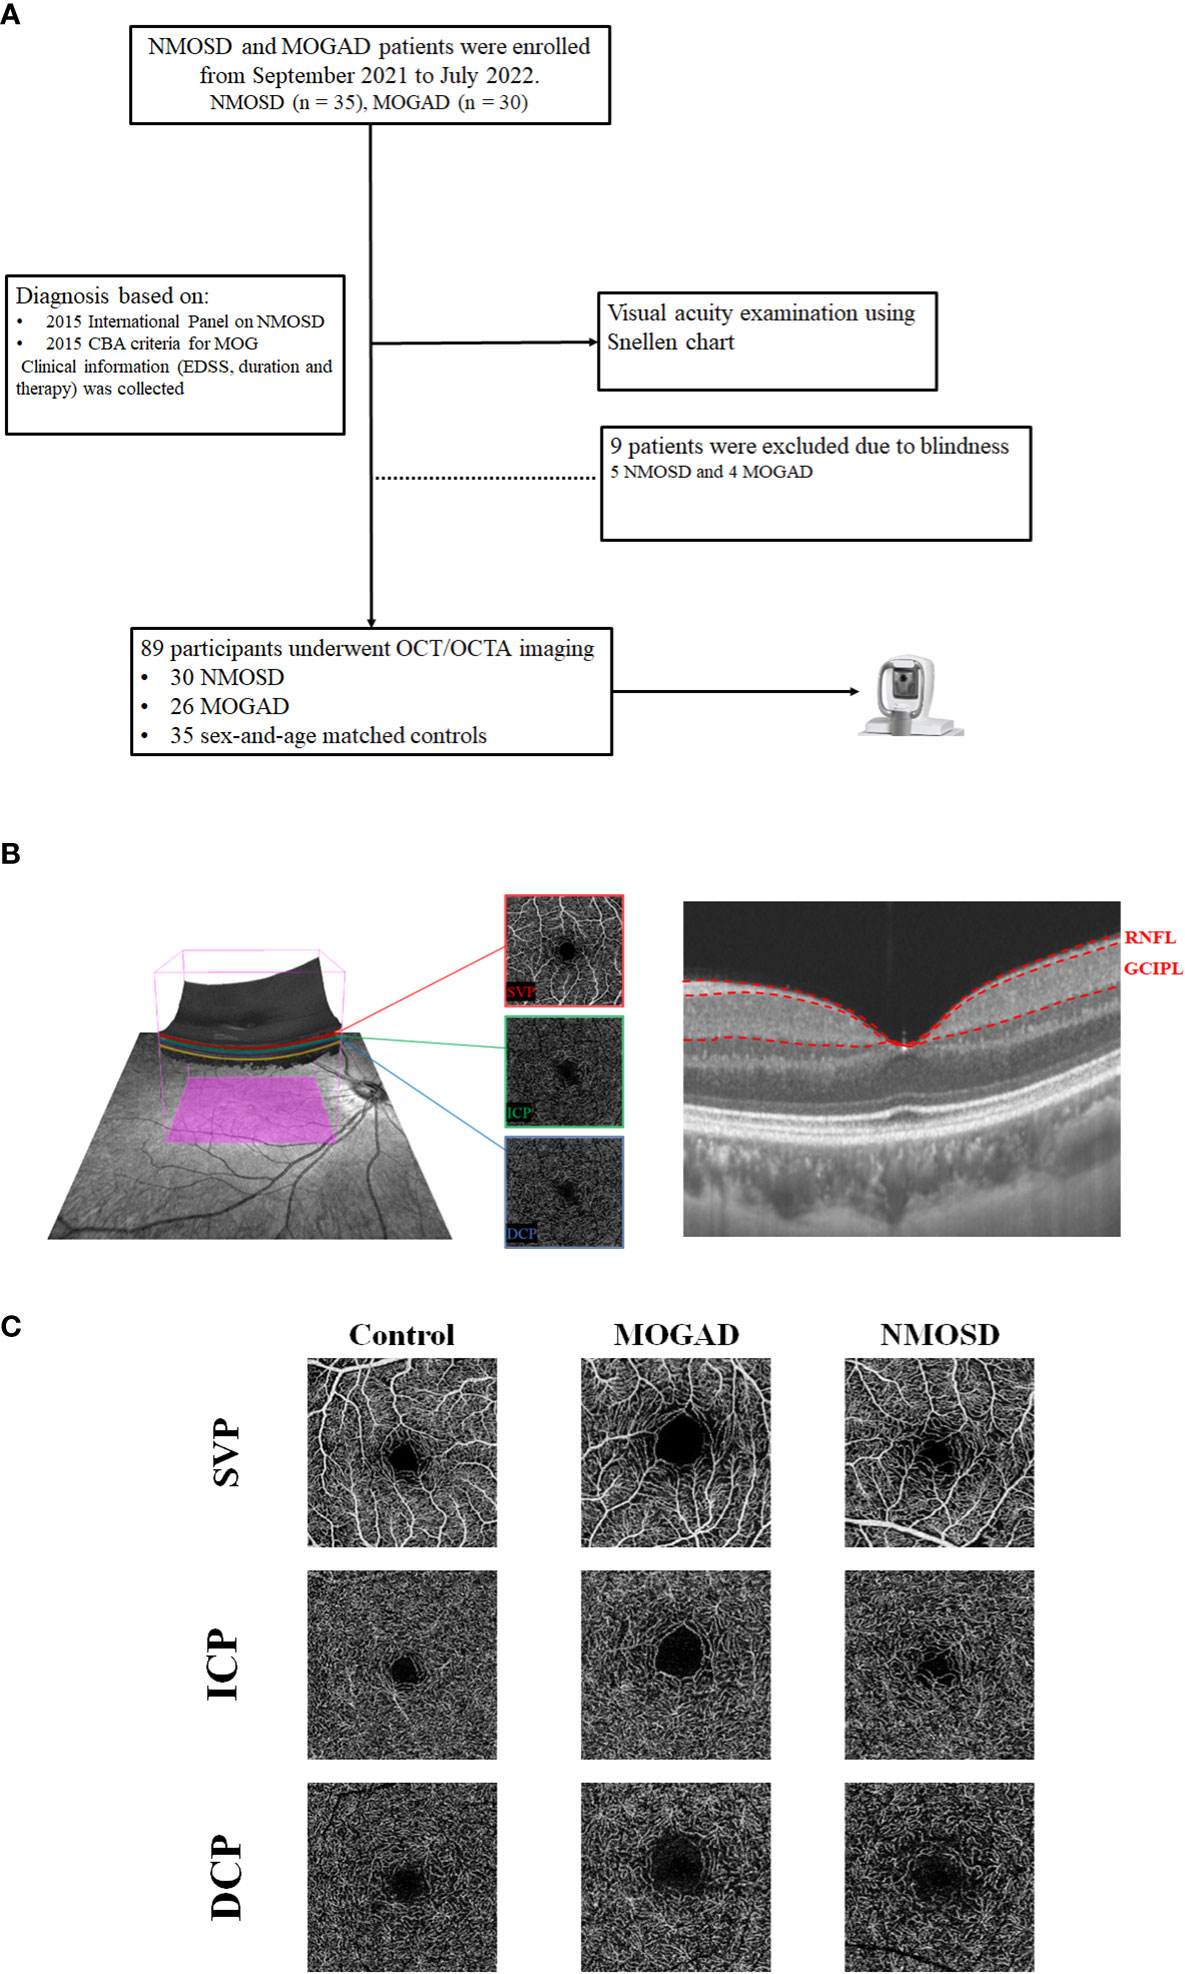
Twenty-two MOGAD and 23 NMOSD patients were recruited from the Neurology Department of West China Hospital. NMOSD patients tested seropositive by cell-based assay (EUROIMMUN AG, Luebeck, Germany) as previously reported (12), and the diagnosis was based on the 2015 International Panel on NMOSD (13), while MOGAD patients tested seropositive by the cell-based assay as previously reported (14) (Figure 1A). Patients with ON less than 6 months before evaluation were excluded from our study. The inclusion criteria for MOGAD and NMOSD patients were as follows: 1) no sudden vision loss or eyeball pain occurred in the past 6 months, 2) long-term follow-up in our hospital with complete data and without a history of seizures, and 3) patients who could cooperate with our study and signed informed consent. The exclusion criteria were as follows: 1) possibly confounding neurological or ophthalmological disorders, 2) eyes with prior ocular surgery or trauma or acute optic neuritis within the preceding 6 months, 3) refractive error of ±6 D (diopters), and 4) inability to cooperate with our study. Clinical variables such as frequency of optic neuritis, visual acuity under illumination, and Expanded Disability Status Scale (EDSS) were assessed and recorded.
Figure 1 The flowchart of our participants and segmentation of OCT/OCTA images. (A) The flowchart of the participants in our study. (B) The segmentation of three macular microvascular plexuses and the retinal thickness of RNFL and GCIPL in an area of 3 × 3 mm around the fovea. SVP was defined as the microvasculature between the base of the retinal nerve fiber layer (RNFL) to the junction between the inner plexiform layer (IPL) and inner nuclear layer (INL); ICP was the microvessels between the IPL/INL junction to the INL/outer plexiform layer (OPL) junction, while DCP was the microvessels between the INL/OPL junction to 25 µm below the OPL. (C) The en face angiograms of our participants.
For comparison, 22 healthy controls with no history of neurological or neuropsychological diseases were included in our study. Participants with uncontrolled hypertension or diabetes, a history of ocular surgery, glaucoma, and other ophthalmologic diseases were also excluded from our study for all groups.
All participants underwent comprehensive visual acuity using the Snellen chart. Each participant’s visual acuity for both eyes was obtained under light and later converted to a logarithm of the minimum angle of resolution (LogMAR).
SS-OCT/SS-OCTA imaging and examinationThe SS-OCT/SS-OCTA tool (VG200S; SVision Imaging, Henan, China; version 2.1.016) was used to image the retinal structure and microvasculature for all participants. The specification of this OCT/OCTA tool is well documented in previous reports (15–17). Imaging of the retinal structure was performed with 18 radial B-scans positioned on the fovea. Automatic segmentation of the retinal thickness was done by the OCT tool. Our current study assessed the macular retinal nerve fiber layer (mRNFL) and ganglion cell–inner plexiform layer (GCIPL) in a 3 × 3-mm2 area around the fovea as shown in Figure 1B. The average thicknesses (measured in µm) of the retinal structure were obtained from the OCT tool.
The OCTA images covered an area of 3 × 3 mm2 around the fovea. The en-face angiograms of the superficial vascular complex (SVC) and deep vascular complex (DVC) were generated by the OCTA tool. The partition of the SVC and DVC slabs was set in the inner two-thirds and outer one-third border of GCIPL as shown in Figure 1B. The average percentages (%) of the microvasculature in the SVC and DVC were obtained from the OCTA tool.
The OCT/OCTA data displayed in our study followed the OSCAR-IB quality criteria (18) and APOSTEL recommendation (19).
Statistical analysesThe Shapiro–Wilk test was used to test for the normality of our data. Continuous variables with normal distribution were expressed as mean ± standard deviation (SD), while skewed distribution was expressed as medians and interquartile ranges. Categorical variables were presented as frequencies and percentages. SS-OCT/SS-OCTA parameters among the groups were assessed using generalized estimating equations (GEEs) while adjusting for age and gender. The association between SS-OCT/SS-OCTA parameters and the clinical features was performed with GEE while adjusting for risk factors. A comparison between SS-OCTA parameters stratified by history of ON between MOGAD and NMOSD was performed using a linear mixed model while adjusting for risk factors and intereye dependencies. All analyses were performed with SPSS (version 26, SPSS Inc., Chicago, IL, USA). P-values less than 0.05 were considered statistically significant. This was an exploratory study, so no adjustment for multiple comparisons was made.
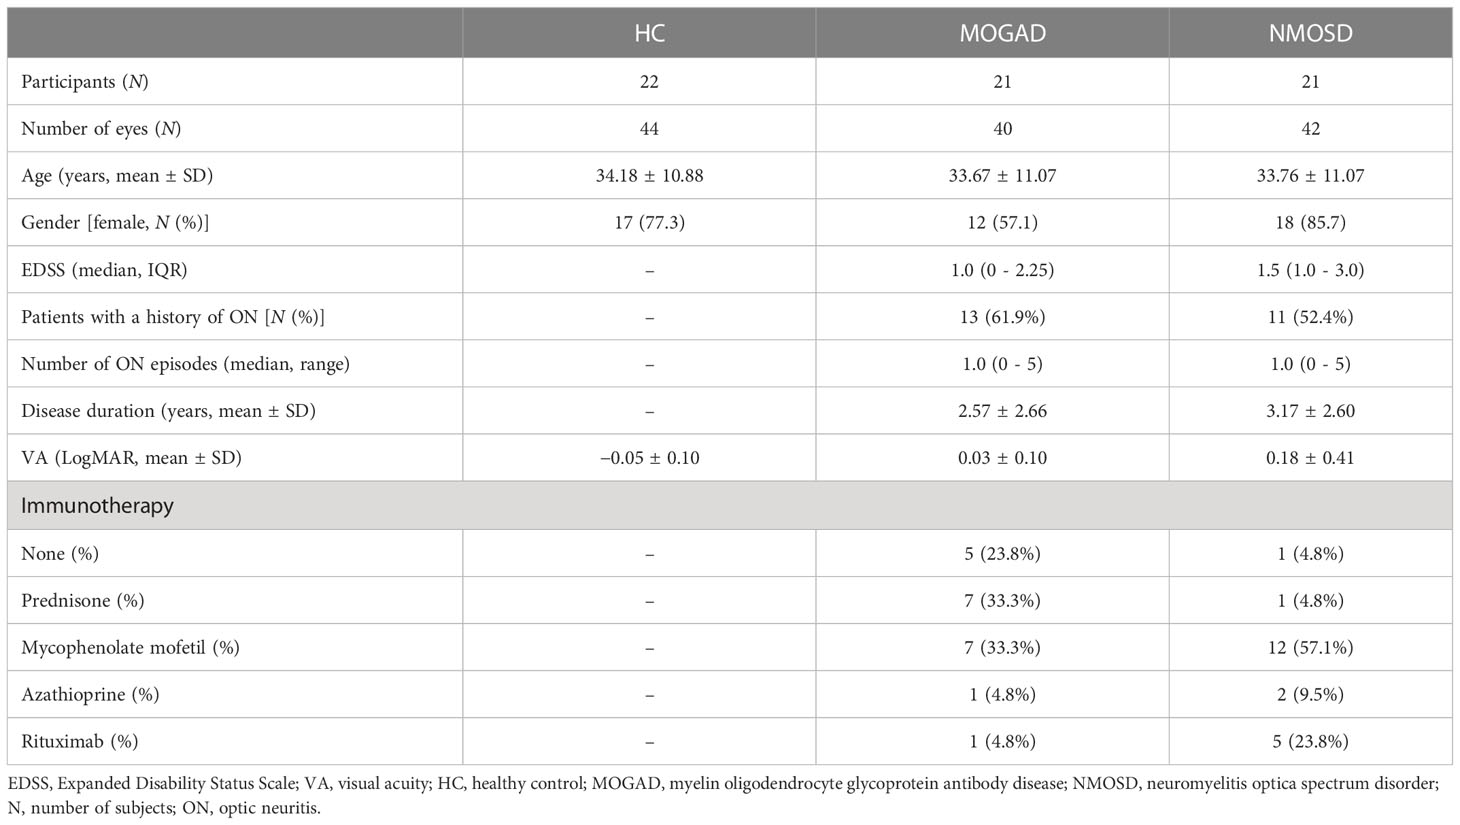
ResultsOur final data analyses included 40 eyes from 21 MOGAD patients (mean age = 33.67 ± 11.07 years), 42 eyes from 21 NMOSD patients (mean age = 33.76 ± 11.07 years), and 44 eyes from 22 healthy controls (mean age = 34.18 ± 10.88 years). Age and sex did not differ among the three groups (P > 0.05, Table 1). Thirteen MOGAD (61.9%; mean = 1 ON episode) and 11 NMOSD (52.4%; mean = 1 ON episode) patients had a history of ON. Table 1 displays the demographics and clinical information of our participants.
Table 1 Demographic overview.
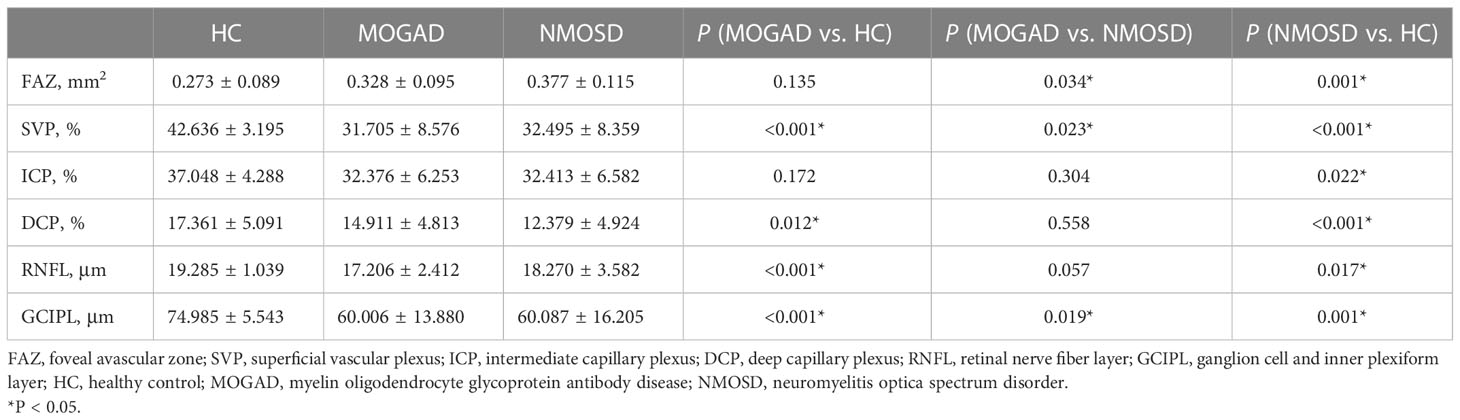
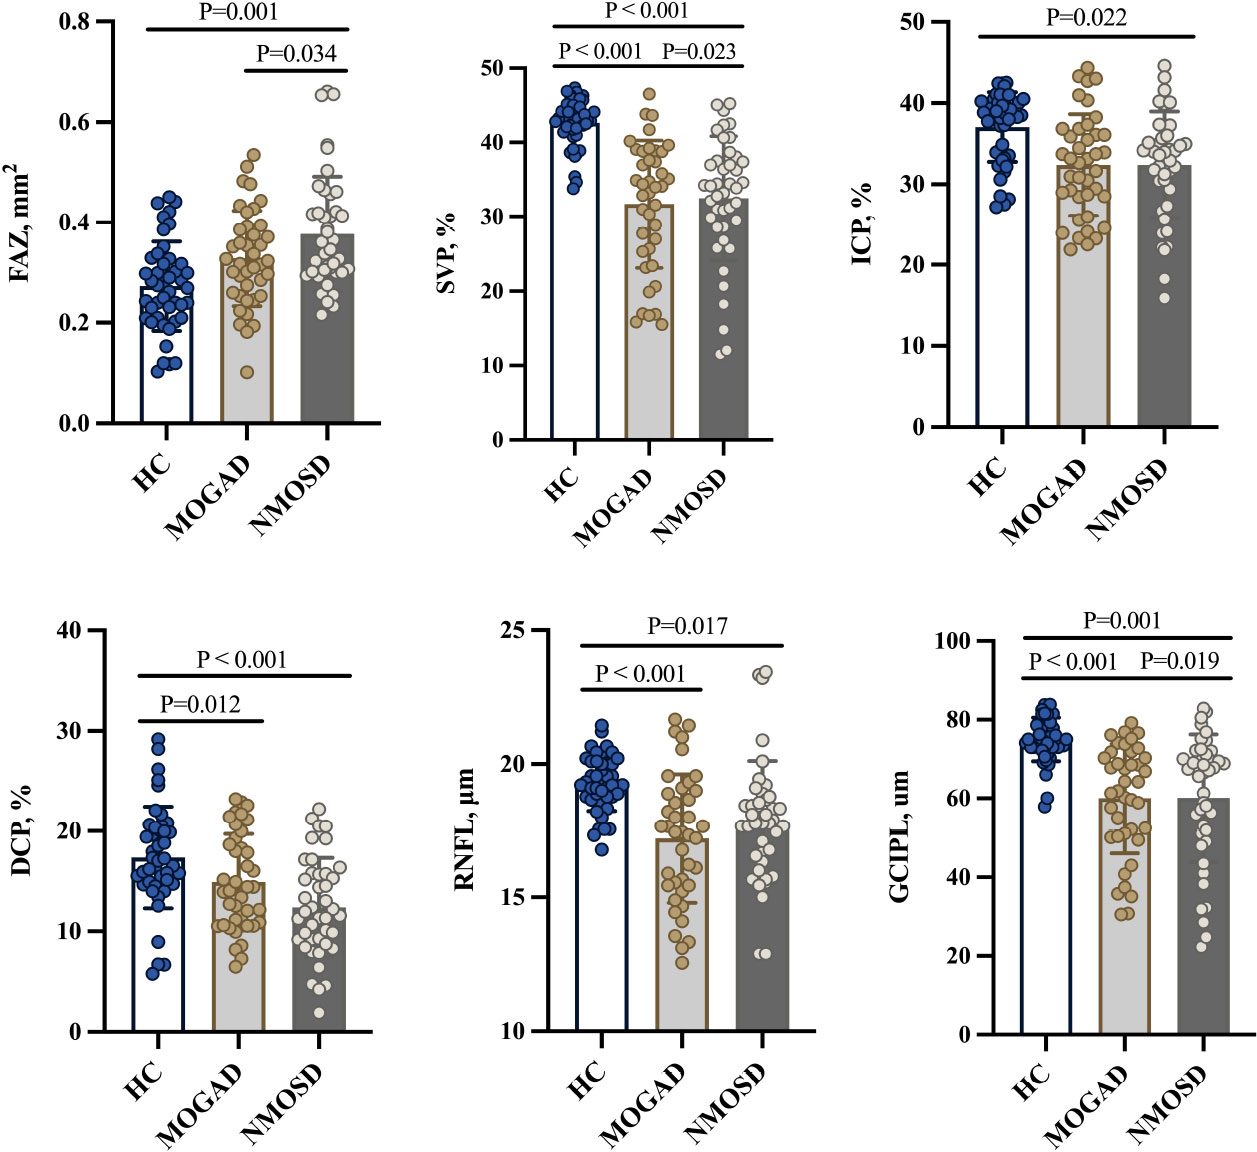
Comparison of SS-OCT/SS-OCTA measures among the groupsMOGAD and NMOSD patients showed thinner RNFL and GCIPL thicknesses (P < 0.05, Table 2 and Figure 2) when compared with controls; compared with NMOSD patients, MOGAD patients had thinner GCIPL thickness (P = 0.019, Table 2 and Figure 2).
Table 2 Comparison of OCT/OCTA parameters.
Figure 2 Comparison of OCT/OCTA parameters. FAZ, foveal avascular zone; SVP, superficial vascular plexus; ICP, intermediate capillary plexus; DCP, deep capillary plexus; RNFL, retinal nerve fiber layer; GCIPL, ganglion cell and inner plexiform layer; HC, healthy control; MOGAD, myelin oligodendrocyte glycoprotein antibody disease; NMOSD, neuromyelitis optica spectrum disorder.
Figure 1C shows the angiograms of our participants. Compared with controls, MOGAD patients showed reduced SVP (P < 0.001, Table 2 and Figure 2) and DCP (P = 0.012, Table 2 and Figure 2) densities. Similarly, NMOSD patients showed reduced SVP (P < 0.001, Table 2 and Figure 2), ICP (P = 0.022, Table 2 and Figure 2), and DCP (P < 0.001, Table 2 and Figure 2) densities and enlarged FAZ area (P = 0.001, Table 2 and Figure 2) when compared with controls.
MOGAD patients showed reduced SVP density (P = 0.023, Table 2) and thinner GCIPL thickness (P = 0.019, Table 2) when compared with NMOSD patients; the FAZ area was larger (P = 0.034) in NMOSD patients than in MOGAD patients.
Supplementary Figure 1 shows the correlation between OCT and OCTA measures in both MOGAD and NMOSD patients. Supplementary Figure 1A shows the correlation in MOGAD patients, while Supplementary Figure 1B shows the correlation in NMOSD patients.
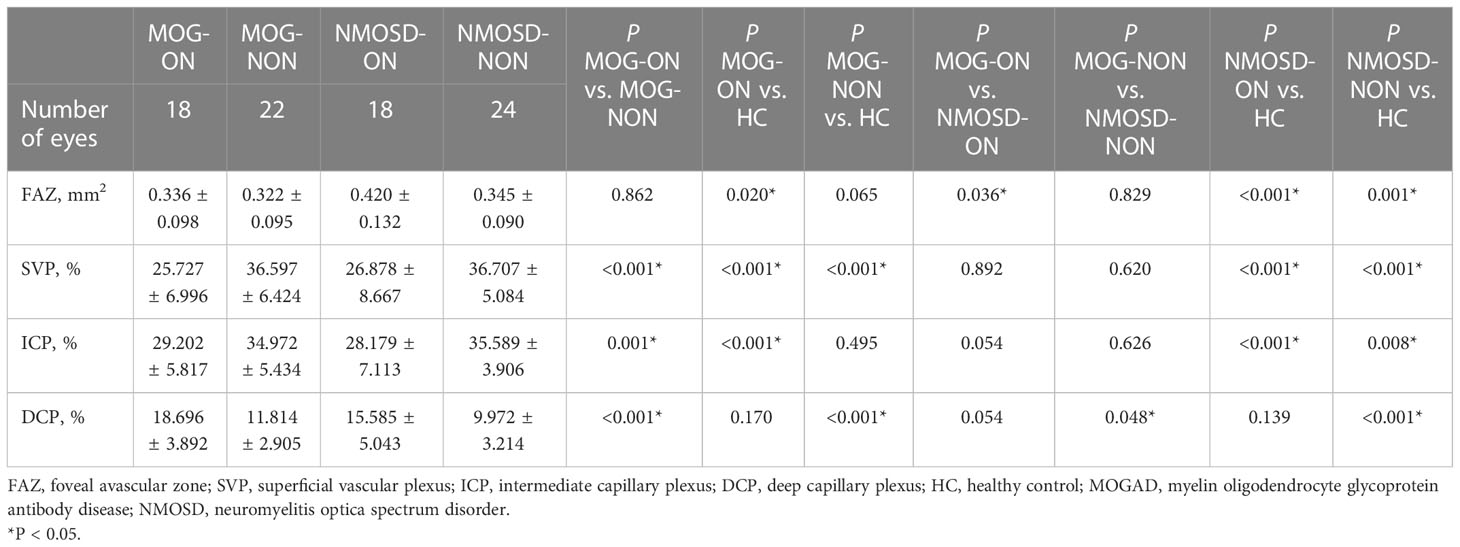
Table 3 shows the SS-OCTA measures among the groups stratified by history of ON. Compared with controls, MOG-ON eyes showed reduced SVP (P < 0.001, Table 3) and ICP (P < 0.001, Table 3) densities and enlarged FAZ area (P = 0.02, Table 3), while MOG-NON eyes showed reduced SVP (P < 0.001, Table 3) and DCP (P < 0.001, Table 3) densities. MOG-ON eyes showed significantly reduced (P < 0.05, Table 3) SVP, ICP, and DCP densities when compared with MOG-NON eyes. NMOSD-ON eyes and NMOSD-NON eyes showed reduced microvascular densities and thinner retinal thicknesses when compared with controls. Importantly, NMOSD-ON eyes showed an enlarged FAZ area (P = 0.036, Table 3) when compared with MOG-ON eyes; NMOSD-NON eyes showed significantly reduced DCP density (P = 0.048, Table 3) when compared with MOG-NON eyes.
Table 3 OCTA results in MOGAD and NMOSD patients stratified by history of ON.
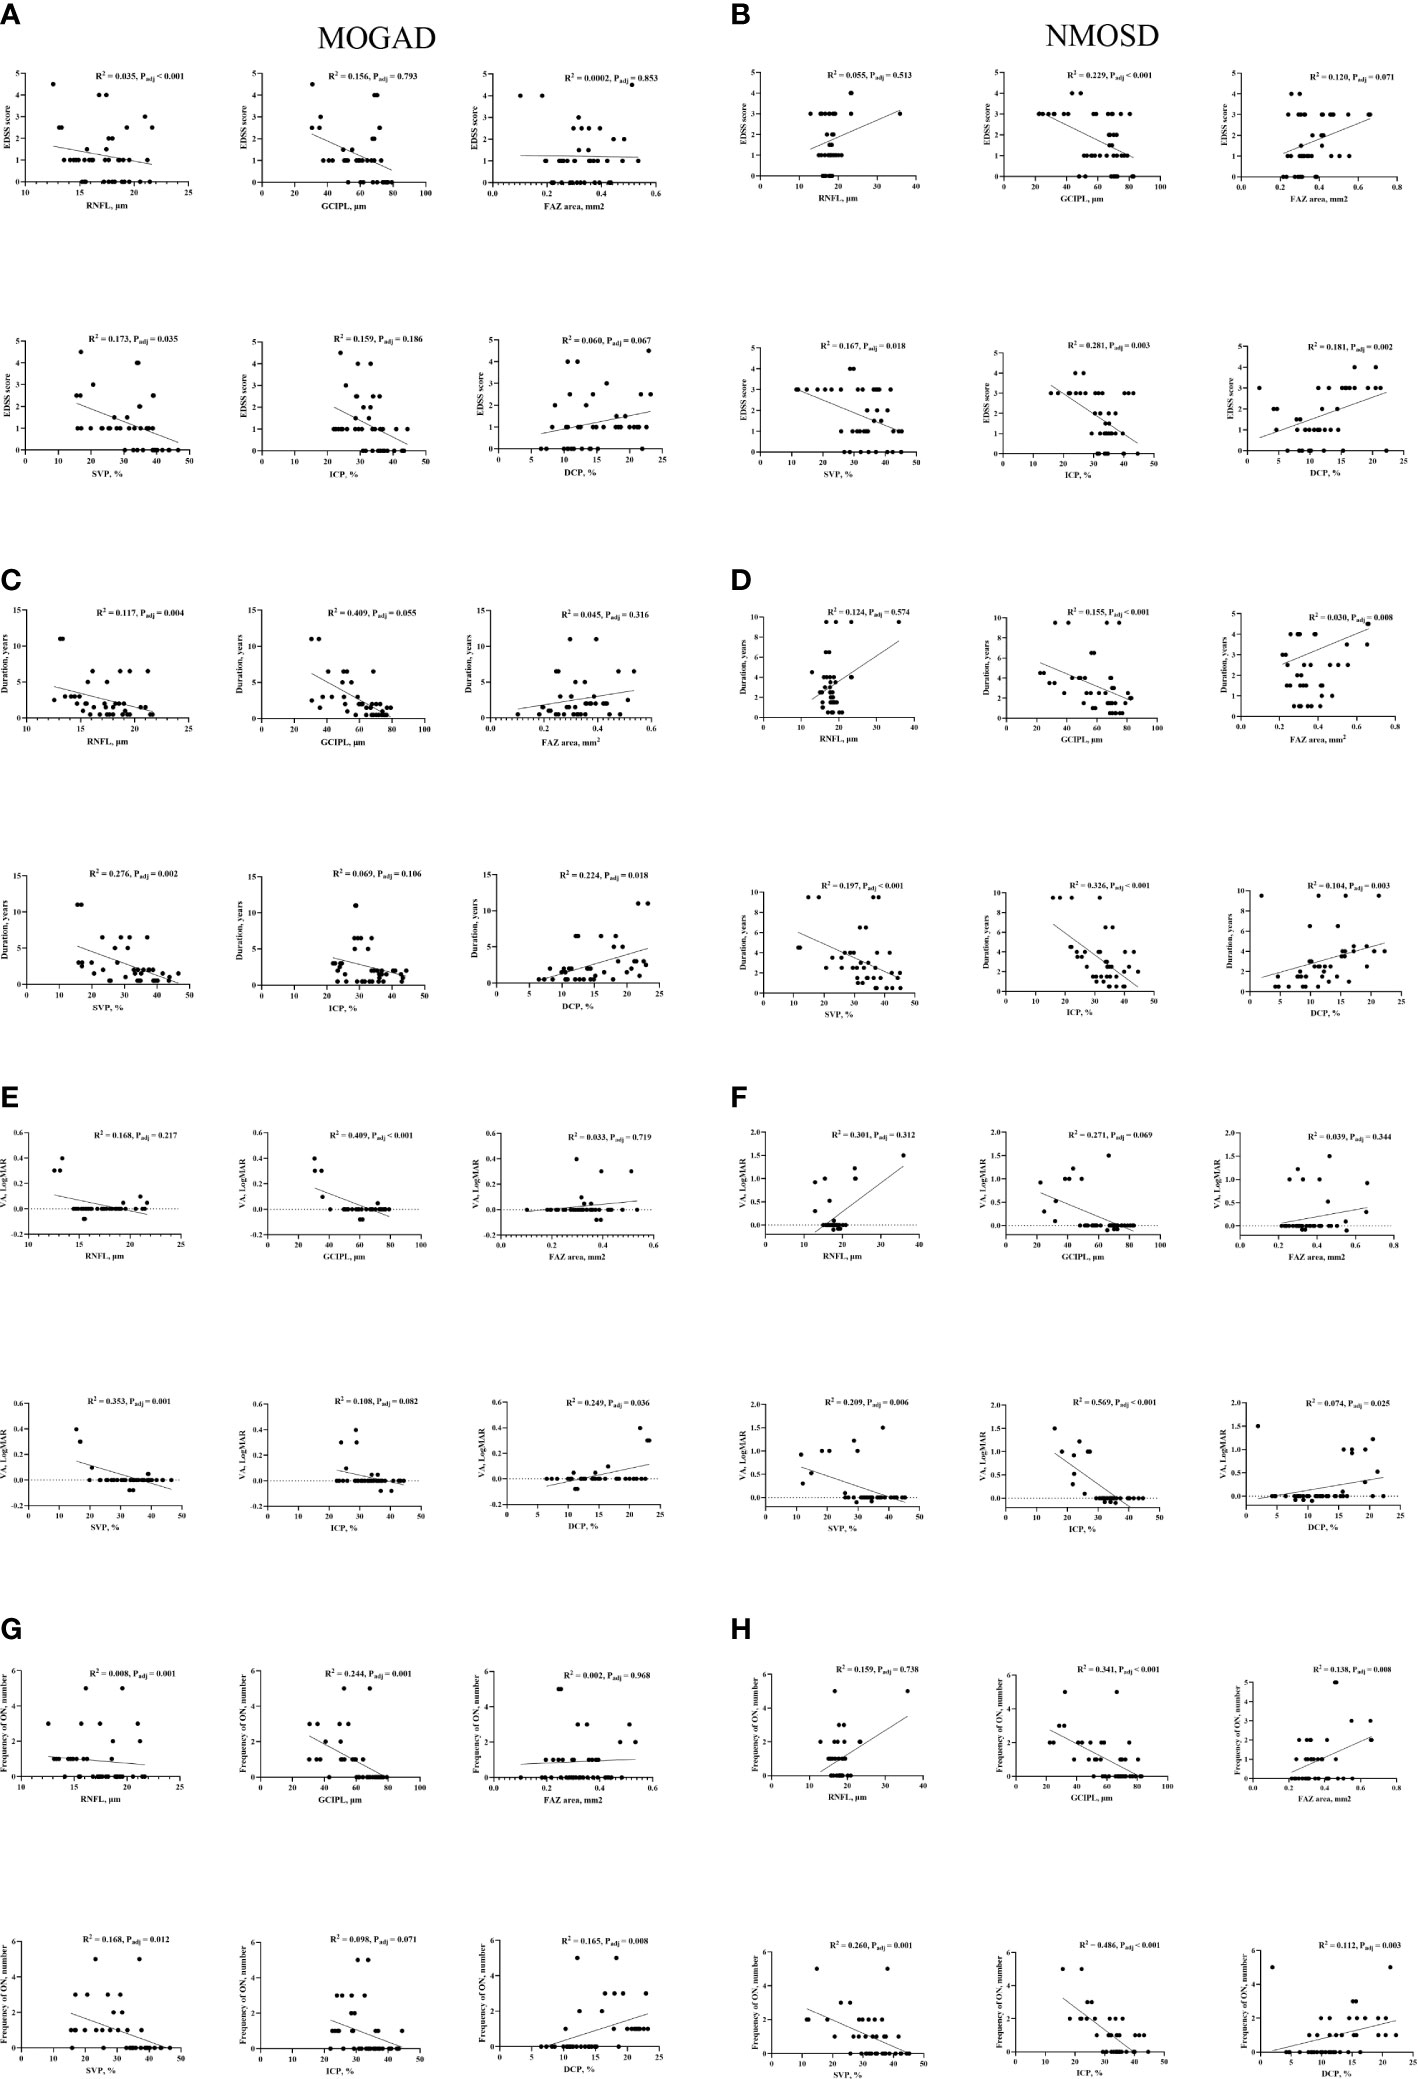
Figure 3 shows the association between SS-OCT/SS-OCTA measures in MOGAD and NMOSD patients and their clinical features. RNFL thickness was significantly correlated with EDSS (P < 0.001) (Figure 3A), disease duration (P = 0.004) (Figure 3C), and frequency of ON (P = 0.001) (Figure 3G), while GCIPL correlated with reduced visual acuity (P < 0.001) (Figure 3E) and frequency of ON (P = 0.001) (Figure 3G) in MOGAD patients. GCIPL thickness in NMOSD patients significantly correlated with EDSS (P < 0.001) (Figure 3B), disease duration (P < 0.001) (Figure 3D), and frequency of ON (P < 0.001) (Figure 3H).
Figure 3 Correlation between clinical features and OCT/OCTA parameters in MOGAD and NMOSD patients. EDSS, Expanded Disability Status Scale; VA, visual acuity; FAZ, foveal avascular zone; SVP, superficial vascular plexus; ICP, intermediate capillary plexus; DCP, deep capillary plexus; RNFL, retinal nerve fiber layer; GCIPL, ganglion cell, and inner plexiform layer; HC, healthy control; MOGAD, myelin oligodendrocyte glycoprotein antibody disease; NMOSD, neuromyelitis optica spectrum disorder. Association of retinal parameters and EDSS (A), Duration (C), VA (E) and Frequency of ON (G) in MOGAD patients. Association of retinal parameters and EDSS (B), Duration (D), VA (F) and Frequency of ON (H) in NMOSD patients.
Supplementary Figure 2 shows the correlation between OCT/OCTA measures and clinical features in the eyes of patients with MOGAD-ON and the eyes of patients with NMOSD-ON. Supplementary Figures 2A, B show the correlation between OCT/OCTA measures with visual acuity (measured in LogMAR) and frequency of ON in MOGAD-ON, while Supplementary Figures 2C, D show the correlation between OCT/OCTA measures with visual acuity (measured in LogMAR) and frequency of ON in NMOSD-ON.
In MOGAD patients, EDSS correlated (P = 0.035) with SVP, disease duration correlated with SVP (P = 0.002) and DCP (P = 0.018), and reduced visual acuity and frequency of ON significantly correlated (P < 0.05) with SVP and DCP, respectively, as shown in Figure 3. In NMOSD patients, EDSS, disease duration, reduced visual acuity, and frequency of ON correlated (P < 0.05, Figure 3) with retinal microvascular changes in the three plexuses.
DiscussionOur current report showed retinal thinning and reduced microvascular densities in NMOSD and MOGAD patients compared with controls which are congruent with previous OCT/OCTA reports (20–23) indicating that neurodegeneration and microvascular impairment occur during the disease cascade. Our study showed thinner GCIPL thickness and reduced SVP density in MOGAD patients compared with NMOSD patients. In MOGAD patients, SVP density correlated with EDSS, disease duration, frequency of ON, and visual acuity, while DCP correlated with disease duration, visual acuity, and frequency of ON; RNFL thickness in MOGAD patients correlated with EDSS, disease duration, and frequency of ON. In NMOSD patients, SVP and ICP densities correlated with EDSS, disease duration, visual acuity, and frequency of ON, while GCIPL thickness correlated with EDSS, disease duration, and frequency of ON.
The novel findings in our study were significantly thinner GCIPL thickness and reduced SVP density in MOGAD compared with NMOSD. The SVP, located in the GCIPL, is responsible for the metabolic supply of neurons in these layers (24), where reduced thicknesses have been reported in both MOGAD and NMOSD (11, 22, 23). With regard to retinal neurodegeneration, it is suggested that retinal thinning in NMOSD is as severe as in MOGAD (25); similarly, a recent report showed that microvascular impairment in MOGAD and NMOSD was similar (23). However, a recent study showed that retinal thinning was more severe in MOGAD than in NMOSD which is congruent with our structural report (26). Our findings of thinner GCIPL thickness and reduced SVP density in MOGAD compared with NMOSD patients included patients with a history of optic neuritis. ON in MOGAD is often bilateral and characterized by retinal edema (27). During retinal edema, it suggested that GCIPL experiences severe neurodegeneration during the ensuing months (22, 27, 28). This structural thinning amasses with each added ON episode which occurs recurrently in MOGAD (25, 29). Although a single episode of ON does not lead to a devastating impairment (26), the highly frequent ON attacks accrue with GCIPL thinning. This is analogous to NMOSD, which is characterized by less frequent ON episodes. Due to the highly recurrent ON attacks in MOGAD, GCIPL thinning and reduced SVP density compared with NMOSD may reflect severe neurodegeneration and microvascular impairment.
In line with previous reports (30, 31), we found enlarged FAZ area as a unique characteristic in NMOSD patients but not in MOGAD patients irrespective of ON. We also showed that NMOSD eyes without ON showed reduced microvascular densities compared with controls. This development may be linked with the pathology of AQP4 antibodies since the parafoveal areas of the retina comprise the highest density of astrocytic Muller cells, which express AQP4 and have shown to be the targets of anti-AQP4 antibodies in NMOSD (32, 33). Enlarged FAZ area and reduced microvascular densities in NMOSD eyes without ON suggest that some activities occur during the subclinical phase in NMOSD and may initiate relapse-independent disease progression.
Concerning microvascular changes after ON, our current study did not find any significant difference between NMOSD-ON and MOG-ON patients which is in line with a previous report (23). It is suggested that ON in MOGAD is acute and severe which is similar to ON in NMOSD; however, the long-term prognosis is better in MOGAD compared with NMOSD. Thus, it is plausible to suggest that microvascular impairment after ON in MOGAD patients may be as severe as in NMOSD patients.
Although NMOSD and MOGAD patients presented with similar clinical features, dissimilar clinical associations were shown in MOGAD and NMOSD which may suggest different pathological processes and underlying macular structural and microvascular impairment. In NMOSD, reduced macula microvascular densities and GCIPL thinning significantly correlated with clinical disability, implying that the potential force of underlying neurodegeneration and microvascular impairment may lead to clinical disability measured by EDSS (34). Moreover, reduced macula microvascular densities and GCIPL thinning significantly correlated with disease duration and frequency of ON, while reduced microvascular densities significantly correlated with reduced visual acuity, which is consistent with OCT/OCTA reports (34–36). These findings were different from those in MOGAD, where clinical correlations were most identified with the SVP and DCP of the macula suggesting the pathological mechanisms are different in NMOSD and MOGAD. The differential association pattern demonstrated indicates that retinal imaging markers might have the potential to be used as a clinical tool to evaluate the clinical features associated with NMOSD and MOGAD.
We would like to acknowledge some limitations in our study. The exploratory and cross-sectional study design of the study limits the understanding of the results concerning the cause and effect. Secondly, our study focused on quantitative retinal microvasculature, while other central nervous system tissues such as the brain, spinal cord, and optic nerve were not evaluated; further studies with a comprehensive assessment of the central nervous system in both NMOSD and especially MOGAD are needed. Thirdly, the clinical relevance of macula microvasculature was assessed with clinical disability (EDSS), visual acuity, disease duration, and frequency of optic neuritis; further study is warranted to assess its value to cognition and treatment response. The data from our study were obtained from our hospital cohort which limits the generalizability of the data to the general population. There was a possibility of a selection bias caused by the exclusion of individuals with retinal abnormalities (high myopia) and unmatched gender among groups. This may have led to an underestimation of the observed correlations.
In conclusion, we showed that GCIPL thinning and reduced SVP density are severe in MOGAD than in NMOSD. We also showed that microvascular changes after ON in NMOSD may be as severe as in MOGAD. Importantly, we showed that enlarged FAZ area and reduced microvascular densities occur as unique features during the subclinical phase of NMOSD but not during MOGAD. Taken together, our study suggests that the OCT/OCTA tool can help facilitate the differentiation of MOGAD from NMOSD in settings with overlapping clinical features.
Data availability statementThe original contributions presented in the study are included in the article/Supplementary Material. Further inquiries can be directed to the corresponding authors.
Ethics statementThe studies involving human participants were reviewed and approved by the Institutional Review Board of West China Hospital, Sichuan, China. The patients/participants provided their written informed consent to participate in this study.
Author contributionsYL: methodology, data curation, formal analysis, writing—original draft, and writing—review and editing. WK: methodology, data curation, formal analysis, writing—original draft, and writing—review and editing. LK: investigation and data curation. ZS: investigation and formal analysis. XW: investigation and formal analysis. QD: investigation and data curation. BW: conceptualization, methodology, validation, writing—review and editing, and supervision. HZ: conceptualization, methodology, validation, funding acquisition, writing—review and editing, and supervision. All authors contributed to the article and approved the submitted version.
FundingThis work was funded by the Department of Science and Technology of Sichuan Province (2020YFS0219 and 2021YFS0173) and the 1·3·5 Projects for Disciplines of Excellence–Clinical Research Incubation Project, West China Hospital, Sichuan University (Grant No. 21HXFH041).
Conflict of interestThe authors declare that the research was conducted in the absence of any commercial or financial relationships that could be construed as a potential conflict of interest.
Publisher’s noteAll claims expressed in this article are solely those of the authors and do not necessarily represent those of their affiliated organizations, or those of the publisher, the editors and the reviewers. Any product that may be evaluated in this article, or claim that may be made by its manufacturer, is not guaranteed or endorsed by the publisher.
Supplementary materialThe Supplementary Material for this article can be found online at: https://www.frontiersin.org/articles/10.3389/fimmu.2023.1029124/full#supplementary-material
References3. Spadaro M, Winklmeier S, Beltran E, Macrini C, Hoftberger R, Schuh E, et al. Pathogenicity of human antibodies against myelin oligodendrocyte glycoprotein. Ann Neurol (2018) 84(2):315–28. doi: 10.1002/ana.25291
PubMed Abstract | CrossRef Full Text | Google Scholar
4. Dos Passos GR, Oliveira LM, da Costa BK, Apostolos-Pereira SL, Callegaro D, Fujihara K, et al. MOG-IgG-Associated optic neuritis, encephalitis, and myelitis: Lessons learned from neuromyelitis optica spectrum disorder. Front Neurol (2018) 9:217. doi: 10.3389/fneur.2018.00217
PubMed Abstract | CrossRef Full Text | Google Scholar
5. Chen JJ, Sotirchos ES, Henderson AD, Vasileiou ES, Flanagan EP, Bhatti MT, et al. OCT retinal nerve fiber layer thickness differentiates acute optic neuritis from MOG antibody-associated disease and multiple sclerosis: RNFL thickening in acute optic neuritis from MOGAD vs MS. Mult Scler Relat Disord (2022) 58:103525. doi: 10.1016/j.msard.2022.103525
PubMed Abstract | CrossRef Full Text | Google Scholar
6. Chang VTW, Chang HM. Review: Recent advances in the understanding of the pathophysiology of neuromyelitis optica spectrum disorder. Neuropathol Appl Neurobiol (2020) 46(3):199–218. doi: 10.1111/nan.12574
PubMed Abstract | CrossRef Full Text | Google Scholar
7. Zamvil SS, Slavin AJ. Does MOG ig-positive AQP4-seronegative opticospinal inflammatory disease justify a diagnosis of NMO spectrum disorder? Neurol Neuroimmunol Neuroinflamm. (2015) 2(1):e62. doi: 10.1212/NXI.0000000000000062
PubMed Abstract | CrossRef Full Text | Google Scholar
8. Reindl M, Schanda K, Woodhall M, Tea F, Ramanathan S, Sagen J, et al. International multicenter examination of MOG antibody assays. Neurol Neuroimmunol Neuroinflamm. (2020) 7(2):e674. doi: 10.1212/NXI.0000000000000674
PubMed Abstract | CrossRef Full Text | Google Scholar
9. Hassan MB, Stern C, Flanagan EP, Pittock SJ, Kunchok A, Foster RC, et al. Population-based incidence of optic neuritis in the era of aquaporin-4 and myelin oligodendrocyte glycoprotein antibodies. Am J Ophthalmol (2020) 220:110–4. doi: 10.1016/j.ajo.2020.07.014
PubMed Abstract | CrossRef Full Text | Google Scholar
10. Filippatou AG, Mukharesh L, Saidha S, Calabresi PA, Sotirchos ES. AQP4-IgG and MOG-IgG related optic neuritis-prevalence, optical coherence tomography findings, and visual outcomes: A systematic review and meta-analysis. Front Neurol (2020) 11:540156. doi: 10.3389/fneur.2020.540156
PubMed Abstract | CrossRef Full Text | Google Scholar
11. Barnes S, You Y, Shen T, Hardy TA, Fraser C, Reddel SW, et al. Structural and functional markers of optic nerve damage in myelin oligodendrocyte glycoprotein antibody-associated optic neuritis. Mult Scler J Exp Transl Clin (2021) 7(4):20552173211063126. doi: 10.1177/20552173211063126
PubMed Abstract | CrossRef Full Text | Google Scholar
12. Shi Z, Du Q, Chen H, Zhang Y, Qiu Y, Zhao Z, et al. Effects of immunotherapies and prognostic predictors in neuromyelitis optica spectrum disorder: A prospective cohort study. J Neurol (2020) 267(4):913–24. doi: 10.1007/s00415-019-09649-7
PubMed Abstract | CrossRef Full Text | Google Scholar
13. Wingerchuk DM, Banwell B, Bennett JL, Cabre P, Carroll W, Chitnis T, et al. International consensus diagnostic criteria for neuromyelitis optica spectrum disorders. Neurology. (2015) 85(2):177–89. doi: 10.1212/WNL.0000000000001729
PubMed Abstract | CrossRef Full Text | Google Scholar
14. Jarius S, Paul F, Aktas O, Asgari N, Dale RC, de Seze J, et al. MOG encephalomyelitis: International recommendations on diagnosis and antibody testing. J Neuroinflammation. (2018) 15(1):134. doi: 10.1186/s12974-018-1144-2
PubMed Abstract | CrossRef Full Text | Google Scholar
15. Kwapong WR, Jiang S, Yan Y, Wan J, Wu B. Macular microvasculature is associated with total cerebral small vessel disease burden in recent single subcortical infarction. Front Aging Neurosci (2021) 13:787775. doi: 10.3389/fnagi.2021.787775
PubMed Abstract | CrossRef Full Text | Google Scholar
16. Ye C, Kwapong WR, Tao W, Lu K, Pan R, Wang A, et al. Characterization of macular structural and microvascular changes in thalamic infarction patients: A swept-source optical coherence tomography-angiography study. Brain Sci (2022) 12(5):518. doi: 10.3390/brainsci12050518
PubMed Abstract | CrossRef Full Text | Google Scholar
17. Tao W, Kwapong WR, Xie J, Wang Z, Guo X, Liu J, et al. Retinal microvasculature and imaging markers of brain frailty in normal aging adults. Front Aging Neurosci (2022) 14:945964. doi: 10.3389/fnagi.2022.945964
PubMed Abstract | CrossRef Full Text | Google Scholar
18. Tewarie P, Balk L, Costello F, Green A, Martin R, Schippling S, et al. The OSCAR-IB consensus criteria for retinal OCT quality assessment. PloS One (2012) 7(4):e34823. doi: 10.1371/journal.pone.0034823
PubMed Abstract | CrossRef Full Text | Google Scholar
19. Aytulun A, Cruz-Herranz A, Aktas O, Balcer LJ, Balk L, Barboni P, et al. APOSTEL 2.0 recommendations for reporting quantitative optical coherence tomography studies. Neurology. (2021) 97(2):68–79. doi: 10.1212/WNL.0000000000012125
PubMed Abstract | CrossRef Full Text | Google Scholar
20. Roca-Fernandez A, Camera V, Loncarevic-Whitaker G, Messina S, Mariano R, Vincent A, et al. The use of OCT in good visual acuity MOGAD and AQP4-NMOSD patients; with and without optic neuritis. Mult Scler J Exp Transl Clin (2021) 7(4):20552173211066446. doi: 10.1177/20552173211066446
PubMed Abstract | CrossRef Full Text | Google Scholar
21. Graves JS, Oertel FC, van der Walt A, Collorone S, Sotirchos ES, Pihl-Jensen G, et al. Leveraging visual outcome measures to advance therapy development in neuroimmunologic disorders. Neurol Neuroimmunol Neuroinflamm. (2022) 9(2):e1126. doi: 10.1212/NXI.0000000000001126
PubMed Abstract | CrossRef Full Text | Google Scholar
22. Sotirchos ES, Filippatou A, Fitzgerald KC, Salama S, Pardo S, Wang J, et al. Aquaporin-4 IgG seropositivity is associated with worse visual outcomes after optic neuritis than MOG-IgG seropositivity and multiple sclerosis, independent of macular ganglion cell layer thinning. Mult Scler. (2020) 26(11):1360–71. doi: 10.1177/1352458519864928
PubMed Abstract | CrossRef Full Text | Google Scholar
23. Yu J, Huang Y, Zhou L, ZhangBao J, Zong Y, Quan C, et al. Comparison of the retinal vascular network and structure in patients with optic neuritis associated with myelin oligodendrocyte glycoprotein or aquaporin-4 antibodies: An optical coherence tomography angiography study. J Neurol (2021) 268(12):4874–81. doi: 10.1007/s00415-021-10609-3
PubMed Abstract | CrossRef Full Text | Google Scholar
24. Campbell JP, Zhang M, Hwang TS, Bailey ST, Wilson DJ, Jia Y, et al. Detailed vascular anatomy of the human retina by projection-resolved optical coherence tomography angiography. Sci Rep (2017) 7:42201. doi: 10.1038/srep42201
PubMed Abstract | CrossRef Full Text | Google Scholar
25. Pache F, Zimmermann H, Mikolajczak J, Schumacher S, Lacheta A, Oertel FC, et al. MOG-IgG in NMO and related disorders: A multicenter study of 50 patients. part 4: Afferent visual system damage after optic neuritis in MOG-IgG-seropositive versus AQP4-IgG-seropositive patients. J Neuroinflammation. (2016) 13(1):282. doi: 10.1186/s12974-016-0720-6
PubMed Abstract | CrossRef Full Text | Google Scholar
26. Akaishi T, Sato DK, Nakashima I, Takeshita T, Takahashi T, Doi H, et al. MRI And retinal abnormalities in isolated optic neuritis with myelin oligodendrocyte glycoprotein and aquaporin-4 antibodies: A comparative study. J Neurol Neurosurg Psychiatry (2016) 87(4):446–8. doi: 10.1136/jnnp-2014-310206
PubMed Abstract | CrossRef Full Text | Google Scholar
27. Vicini R, Brugger D, Abegg M, Salmen A, Grabe HM. Differences in morphology and visual function of myelin oligodendrocyte glycoprotein antibody and multiple sclerosis associated optic neuritis. J Neurol (2021) 268(1):276–84. doi: 10.1007/s00415-020-10097-x
PubMed Abstract | CrossRef Full Text | Google Scholar
28. Havla J, Kumpfel T, Schinner R, Spadaro M, Schuh E, Meinl E, et al. Myelin-oligodendrocyte-glycoprotein (MOG) autoantibodies as potential markers of severe optic neuritis and subclinical retinal axonal degeneration. J Neurol (2017) 264(1):139–51. doi: 10.1007/s00415-016-8333-7
PubMed Abstract | CrossRef Full Text | Google Scholar
29. Zhao G, Chen Q, Huang Y, Li Z, Sun X, Lu P, et al. Clinical characteristics of myelin oligodendrocyte glycoprotein seropositive optic neuritis: A cohort study in shanghai, China. J Neurol (2018) 265(1):33–40. doi: 10.1007/s00415-017-8651-4
PubMed Abstract | CrossRef Full Text | Google Scholar
30. Oertel FC, Kuchling J, Zimmermann H, Chien C, Schmidt F, Knier B, et al. Microstructural visual system changes in AQP4-antibody-seropositive NMOSD. Neurol Neuroimmunol Neuroinflamm. (2017) 4(3):e334. doi: 10.1212/NXI.0000000000000334
PubMed Abstract | CrossRef Full Text | Google Scholar
31. Roca-Fernandez A, Oertel FC, Yeo T, Motamedi S, Probert F, Craner MJ, et al. Foveal changes in aquaporin-4 antibody seropositive neuromyelitis optica spectrum disorder are independent of optic neuritis and not overtly progressive. Eur J Neurol (2021) 28(7):2280–93. doi: 10.1111/ene.14766
PubMed Abstract | CrossRef Full Text | Google Scholar
32. Pannicke T, Wurm A, Iandiev I, Hollborn M, Linnertz R, Binder DK, et al. Deletion of aquaporin-4 renders retinal glial cells more susceptible to osmotic stress. J Neurosci Res (2010) 88(13):2877–88. doi: 10.1002/jnr.22437
PubMed Abstract | CrossRef Full Text | Google Scholar
33. Hillebrand S, Schanda K, Nigritinou M, Tsymala I, Bohm D, Peschl P, et al. Circulating AQP4-specific auto-antibodies alone can induce neuromyelitis optica spectrum disorder in the rat. Acta Neuropathol. (2019) 137(3):467–85. doi: 10.1007/s00401-018-1950-8
PubMed Abstract | CrossRef Full Text | Google Scholar
34. Wei R, Xie J, Wu H, He F, Meng F, Liu J, et al. Superficial macula capillary complexity changes are associated with disability in neuromyelitis optica spectrum disorders. Front Neurol (2021) 12:724946. doi: 10.3389/fneur.2021.724946
PubMed Abstract | CrossRef Full Text | Google Scholar
35. Lang Y, Kwapong WR, Kong L, Shi Z, Zhao Z, Du Q, et al. Sparser macula microvasculature in neuromyelitis optica spectrum disorder occurs independently of optic neuritis. Mult Scler Relat Disord (2022) 58:103470. doi: 10.1016/j.msard.2021.103470
PubMed Abstract | CrossRef Full Text | Google Scholar
36. Kwapong WR, Peng C, He Z, Zhuang X, Shen M, Lu F. Altered macular microvasculature in neuromyelitis optica spectrum disorders. Am J Ophthalmol (2018) 192:47–55. doi: 10.1016/j.ajo.2018.04.026
留言 (0)