
記住我
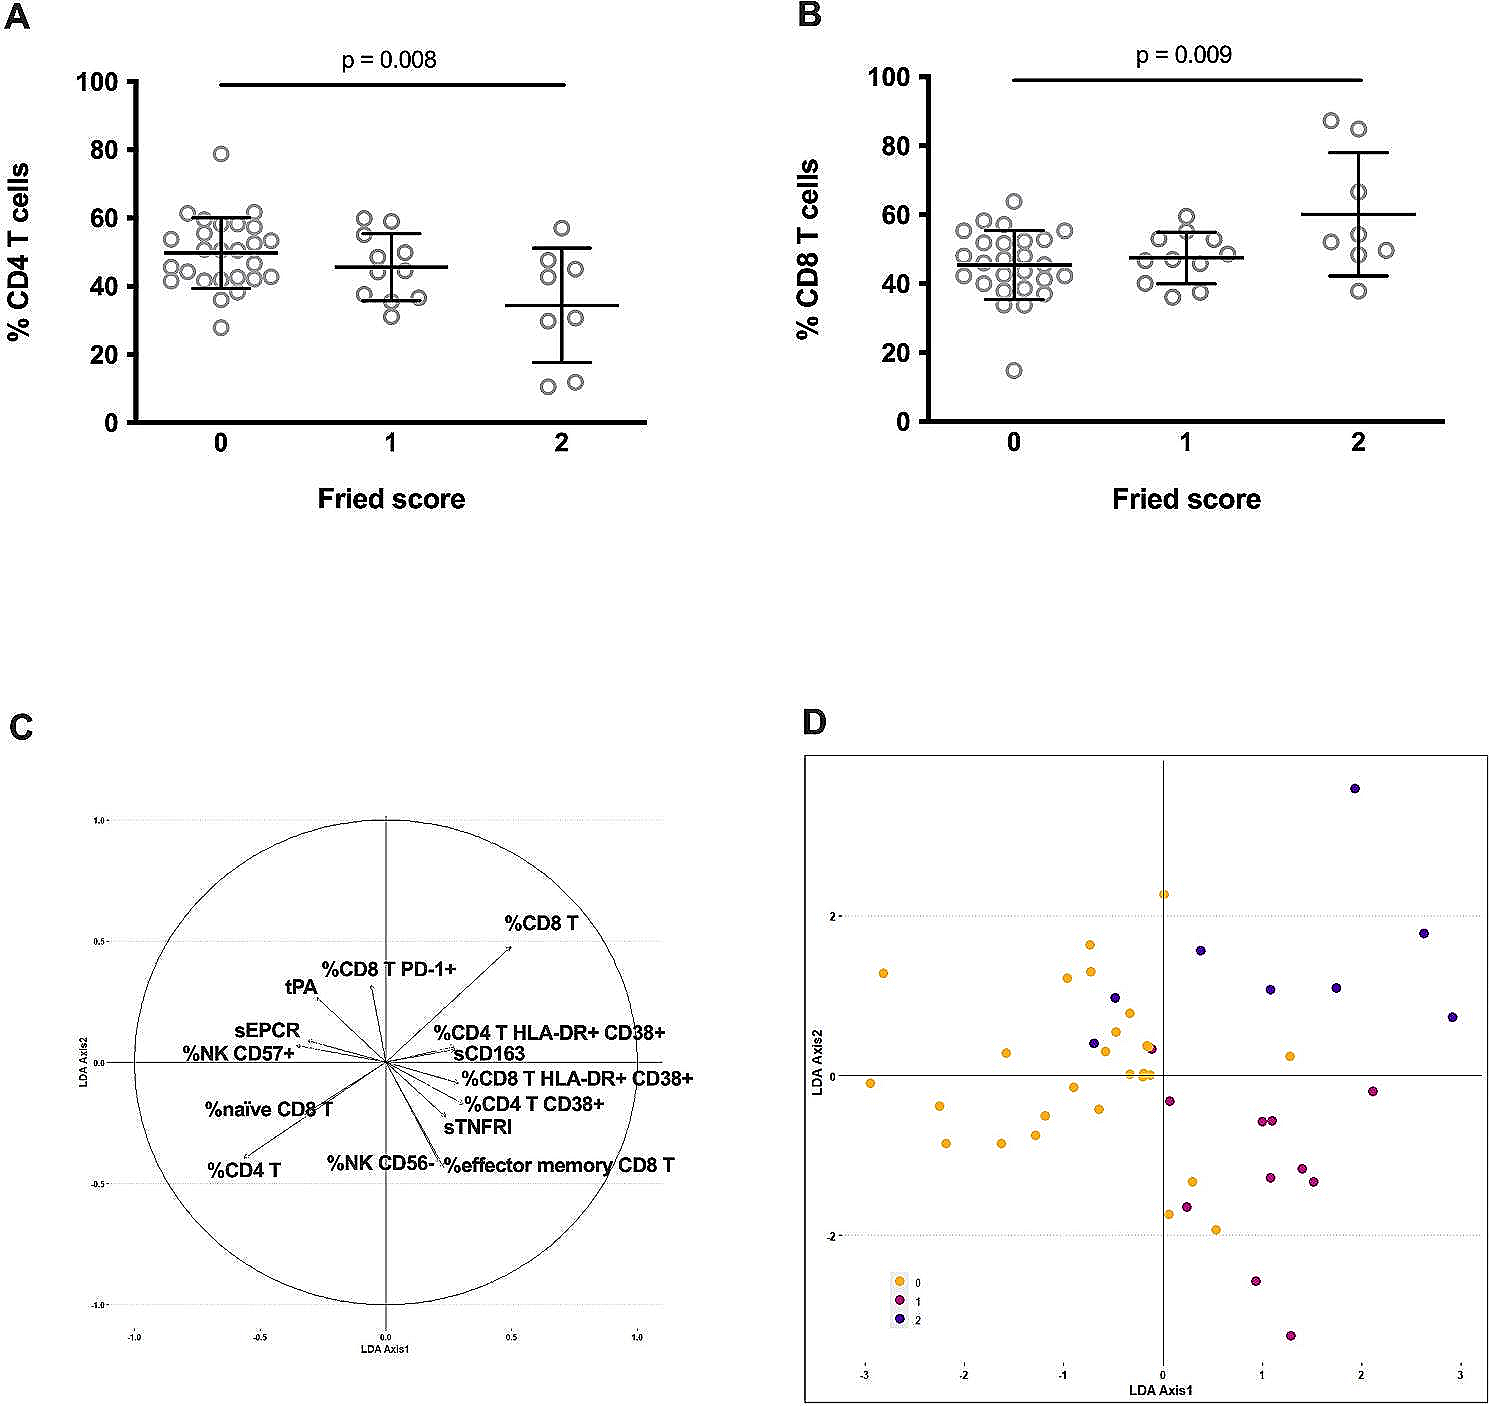
To assess whether EVs may be biomarkers of frailty and contribute to the frailty phenotype, we identified middle-aged individuals (45–55 years) in the HANDLS study who were frail (n = 87) and non-frail (n = 90) living above and below poverty, matched across sex and race (Table 1). EVs were isolated from plasma samples of these participants using size exclusion chromatography (SEC) with an Automatic Fraction Collector (AFC). The AFC facilitates a high-throughput approach for isolation of EVs from larger numbers of samples. Fractions 1–3 (F1–3) were pooled together, as they were the EV-enriched fractions. Consistent with other reports, the later fractions F4–10 were increasingly enriched in plasma proteins (Fig. 1A) [38, 39]. Isolated plasma EVs were validated according to Minimal Information for Studies of Extracellular Vesicles (MISEV) guidelines from the International Society of Extracellular Vesicles [40]. We assessed the presence of EV-associated markers by immunoblotting (Fig. 1B). The EV markers Flotillin-1, CD81, and CD9 were present in the EV-enriched fraction while the purity markers GM130 and ApoA1 were absent in the EV-enriched fraction. In addition, EV markers were also validated using an Exo-Check™ Exosome Antibody Array. The array confirmed the presence of other EV markers including ALIX, ANAXA5, CD81, EpCAM, ICAM1, and TSG101 (Fig. 1C). We further validated the size and concentration of the EVs using nanoparticle tracking analysis (NTA). The size distribution revealed a peak around 170 nm (Fig. 1D), which is consistent with EVs isolated from plasma. Through linear regression analysis, we found a significant interaction between frailty and race with EV concentration (p < 0.0001). Overall, EV concentration was highest in frail White participants, with significantly higher levels than non-frail White and frail African American participants (Fig. 1E). In Fig. 1D and E, we show the data for the distribution of EV concentration and size by frailty status and race, and interaction between frailty and race with EV concentration (Fig. 1D, E). Electron microscopy of the EV preparation showed a typical EV morphology with clear, round membranous vesicles and in some cases a cup-like shape, which can occur during the dehydration process for sample preparation in transmission electron microscopy (Fig. 1F) [41]. Collectively, these data indicate that plasma EVs isolated using SEC display characteristics that are attributed to EVs.
Table 1 Demographics for frailty sub-cohort of HANDLS studyFig. 1
EV protein and concentration profile of the frailty cohort. A Plasma was separated using size exclusion chromatography (SEC) into 10 fractions that were lysed and relative protein concentration was determined. The extracellular vesicle (EV)-enriched fractions F1–3 were pooled. The histogram represents the relative mean protein concentration for fractions from non-frail (n = 3) and frail (n = 3) individuals + standard error of the mean. B SEC EV fractions and human umbilical vein endothelial cells were lysed and analyzed by SDS-PAGE and immunoblotted with antibodies against EV markers Flotillin-1, CD81, and CD9. GM130 and ApoA1 were used as purity markers. C Exo-Check™ Exosome Antibody Array was used to further validate EVs for common EV markers. Positive (+) control for the assay is indicated. D EV size and distribution were analyzed by nanoparticle tracking analysis, shown here by race and frailty status. The distribution was averaged for each group (African American non-frail n = 43, African American frail n = 41, White non-frail n = 47, White frail n = 46). E EV concentration values were log2 transformed. Linear regression was used to examine the relationship between EV concentration and frailty status, accounting for sex, race, and poverty status (n = 177). The plot shows the linear regression values ± standard error of the estimated values. C) EV morphology and size were visualized using electron microscopy. Region outlined in red was zoomed in for further visualization (scale bars = 200 nm). AA = African American; F = fraction
EV-associated mtDNA levels and frailty statusCcf-mtDNA can act as a DAMP molecule and can be present in plasma EVs [17, 20,21,22]. Here we hypothesized that EVs from frail individuals may contain higher levels of ccf-mtDNA, which may contribute to the chronic inflammatory state observed in frailty. To test this idea, we examined EV mtDNA levels in our cohort using an experimental pipeline that we previously reported [20] which was optimized here for utilization of SEC-isolated EVs. Details of this workflow can be visualized in Supplementary Fig. 1. First, plasma EVs isolated using SEC were DNase treated to remove any DNA outside of the EVs. Then, DNA was isolated and levels of EV mtDNA were measured by quantitative real-time PCR (qPCR) using four primer sets that target different regions of the mitochondrial genome (Supplementary Table 1; Supplementary Fig. 1). The primers were designed to hybridize against regions spanning between 16S rRNA (MT-RNR2) and tRNA-Ile1 (MT-TL1) genes (Mito_3164), the NADH dehydrogenase 2 (MT-ND2) gene region (Mito_4625), Cytochrome c oxidase subunit 2 (COX2) gene region (Mito_7878), and the ATP8 (MT-ATP8) gene region (Mito_8446) (Supplementary Fig. 1).
We examined the DNA isolated from plasma EVs from our frailty cohort. The relationship between EV mtDNA levels amplified with the four primer sets was analyzed using Pearson correlation. All four mtDNA amplicons positively correlated with each other, and these correlations were significant (Supplementary Fig. 2). Therefore, all four regions of the mitochondrial genome were present in the EVs and each of the different primer sets are highly correlated with each other.
We used linear regression to analyze the relationship between EV mtDNA levels from each of the different primer sets with frailty status, sex, race, and poverty status. We found a significant frailty effect on EV mtDNA levels. EV mtDNA levels amplified with Mito_4625 (p = 0.023) and Mito_7878 (p = 0.027) were significantly higher in frail individuals compared to non-frail individuals (Fig. 2A, B). Therefore, frail individuals have higher EV mtDNA levels.
Fig. 2
EV mtDNA levels are higher in frail individuals. Plasma EVs were isolated from participants in the frailty cohort (Table 1). DNA was then isolated from the EVs, and mtDNA levels were measured using mtDNA specific primers, targeting four regions of the mitochondrial genome (n = 177). EV mtDNA values were log2 transformed. Linear regression was used to examine the relationship between EV mtDNA levels and frailty status, accounting for sex, race, and poverty status. EV mtDNA levels amplified by the A) Mito_4625 primer sets and B) Mito_7878 primer sets were significantly higher in frail individuals. The plots show the linear regression values ± standard error of the estimated values
Plasma EV inflammatory protein cargo is altered with frailty, race, sex, and poverty statusTo further test whether other EV cargo was associated with frailty status, we quantified inflammatory proteins in EVs. Previously, we have found that EV inflammatory proteins are altered with mortality and diabetes mellitus status [36, 37]. We have also shown that inflammatory gene expression is altered with frailty status in a middle-aged, diverse cohort [42, 43]. To assess whether inflammatory protein content in EVs differed by frailty status, EVs were lysed and analyzed using a Multiplex Proximity Extension Assay (PEA). This quantitative and sensitive method is highly suitable to detect proteins in body fluids and in EVs [36, 37, 44,45,46]. In total, the panel analyzed the levels of 92 inflammatory proteins. Out of this pool, 14 proteins met our stringent threshold and were included in further analysis. These proteins are listed, along with their general functions in Supplementary Table 2. Using linear regression, several significant interactions of EV inflammatory proteins with frailty, race, sex, and poverty status were observed. These interactions are summarized in Supplementary Table 3 and detailed below. There were 10 different proteins that were significant in at least one of our analyses. There were four proteins that met our detection threshold but did not have significant interactions with frailty, race, sex, or poverty status: CD40, CXCL5, MMP-1, and VEGFA.
The EV levels of eight different proteins had significant interactions with frailty and race: T-cell surface glycoprotein CD5 (CD5) (p = 0.002), T-cell surface glycoprotein CD8 alpha chain (CD8A) (p = 0.017), natural killer cell receptor 2B4 (CD244; also known as SLAMF4) (p = 0.006), C-X-C motif chemokine ligand 1 (CXCL1) (p = 0.006), C-X-C motif chemokine ligand 6 (CXCL6) (p = 0.015), C-X-C motif chemokine ligand 11 (CXCL11) (p = 0.038), latency-associated peptide transforming growth factor beta-1 (LAP-TGF-beta-1) (p = 0.007), and monocyte chemotactic protein 4 (MCP-4; also known as CCL23) (p = 0.032). In general, inflammatory proteins were higher in frail White participants compared to both non-frail White and frail African American participants (Fig. 3A). Specifically, the EV levels of five proteins were lower in frail African American participants compared to frail White participants, CD8A, CD244, CXCL6, CXCL11, and LAP-TGF-beta-1 (Fig. 3A). Two proteins, CD5 and CXCL1, were higher in non-frail African American participants compared to non-frail White participants (Fig. 3A). Six of these proteins were higher in frail White participants compared to non-frail White participants, CD5, CD8A, CD244, CXCL6, CXCL11, and LAP-TGF-beta-1 (Fig. 3A). One protein, CXCL1, was lower in frail African American participants compared to non-frail African American participants (Fig. 3A). Thus, there were eight different EV-associated proteins that varied with frailty and race, and overall were highest in frail White participants.
Fig. 3
EV inflammatory proteins are associated with frailty, sex, and race. Plasma EVs from individuals in the frailty cohort were lysed and analyzed in a multiplex proximity extension assay (n = 177). Normalized protein levels (NPL, which is in a log2 scale) are shown. Linear regression was used to determine the relationship between EV protein levels and frailty status, accounting for sex, race, and poverty status. A EV inflammatory proteins that had a significant relationship between frailty status and race are plotted. The plots show the linear regression values ± standard error of the estimated values. B uPA had a significant three-way interaction with frailty status, race, and poverty status. C CCL28 and CXCL1 had a significant interaction with frailty and sex. AA = African American; NPL = normalized protein level
The levels of one protein, urokinase-type plasminogen activator (uPA), had a significant interaction with frailty, race, and poverty status (p = 0.027). Here, there were differences between groups across poverty status by frailty and race. Frail White participants living below poverty had higher levels of uPA compared to frail White participants living above poverty (Fig. 3B). Amongst participants living below poverty, frail White participants had higher levels of uPA than both non-frail White participants and frail African American participants (Fig. 3B). Therefore, overall EV-associated uPA levels were highest in frail White participants living below poverty.
Two proteins had a significant interaction between frailty and sex, C-C motif chemokine ligand 28 (CCL28) (p = 0.023) and C-X-C motif chemokine ligand 1 (CXCL1) (p = 0.006). CCL28 was lower in frail women compared to non-frail women, and lower in non-frail men compared to non-frail women (Fig. 3C). Inversely, CXCL1 was higher in frail women compared to non-frail women, and higher in non-frail men compared to non-frail women (Fig. 3C). Additionally, CXCL1 levels were lower in frail men compared to non-frail men (Fig. 3C). Thus, CCL28 and CXCL1 levels were different with sex and frailty.
Five proteins had significant interactions between sex and poverty status, CD5 (p = 0.042), CD8A (p = 0.023), CXCL1 (p = 0.006), LAP-TGF-beta-1 (p = 0.032), and uPA (p = 0.008). In general, all five proteins were highest in men living below poverty. Specifically, four of these proteins had higher levels in men living below poverty compared to women living below poverty, including CD8A, CXCL1, LAP-TGF-beta-1, and uPA (Fig. 4A). Two proteins, CXCL1 and uPA, were higher in men living below poverty compared to men living above poverty (Fig. 4A). Additionally, one protein, LAP-TGF-beta-1, was lower in women living below poverty compared to women living above poverty (Fig. 4A). CXCL6 had a significant association with poverty status (p = 0.045). CXCL6 was lower in individuals living below poverty compared to individuals living above poverty (Fig. 4B). Overall men living below poverty had the highest levels of five EV-associated proteins and one protein, CXCL6, was lower in participants living below poverty.
Fig. 4
EV inflammatory proteins are associated with sex and poverty status. Plasma EVs from individuals in the frailty cohort were lysed and analyzed in a multiplex proximity extension assay (n = 177). Normalized protein levels (NPL, which is in a log2 scale) are shown. Linear regression was used to determine the relationship between EV protein levels and frailty status, accounting for sex, race, and poverty status (n = 177). A EV inflammatory proteins that had a significant association with sex and poverty status are plotted. The plots show the linear regression values ± standard error of the estimated values. B CXCL6 levels were significantly different with poverty status
Plasma EV mtDNA levels are significantly correlated with EV inflammatory proteinsTo assess the relationships between EV levels of mtDNA and EV inflammatory proteins, we analyzed the correlation between the levels of these molecules using Pearson correlation. We included in our analysis all detectable inflammatory proteins in the EVs (Supplementary Table 2). We found that 12 of the 14 EV detectable inflammatory proteins were significantly positively correlated with all four EV mtDNA amplicon regions. (Fig. 5). One protein, CCL28 was not significantly correlated with EV mtDNA levels, but was negatively correlated with CXCL1 and CXCL11. All other inflammatory proteins significantly correlated to each other.
Fig. 5
EV mtDNA levels are correlated with EV inflammatory proteins. Pearson correlation using pairwise complete observation was used to determine the associations between the four EV mtDNA amplicon regions and EV inflammatory proteins. Color is based on correlation coefficient (r), where r = 1 is red and r = − 1 is blue. Significance of the p-value is shown by size of the circle for each correlation. A p-value of 0.05 was used as the threshold for significance. Degree of significance is denoted by circle size. The four mitochondrial primer sets are denoted by “Mito_X”
EV inflammatory proteins and frailtyNext, we wanted to determine whether the presence or absence, rather than level of inflammatory proteins, were associated with frailty status. We used logistic regression to examine the detection status of all 92 inflammatory proteins by frailty status, controlling for sex, race, and poverty status. The presence of six proteins were significantly associated with frailty status: fibroblast growth factor 21 (FGF-21), hepatocyte growth factor (HGF), interleukin-12 subunit beta (IL-12B), programmed death-ligand 1 (PD-L1), thioredoxin-dependent peroxide reductase, mitochondrial (PRDX3), and STAM-binding protein (STAMBP; also known as AMSH). EVs from frail individuals were more likely to contain these six proteins compared to EVs from non-frail individuals (Fig. 6).
Fig. 6
Presence of EV inflammatory proteins and frailty status. Plasma EVs were isolated from the frailty cohort, lysed, and analyzed using a multiplex proximity extension assay (n = 177). Logistic regression was used to assess the presence of each inflammatory protein in EVs with frailty status. The model also accounted for sex, race, and poverty status
留言 (0)