
記住我


From July 15, 2021 to July 30, 2021, a total of 160 older adults, including 80 diabetic and 80 healthy, nondiabetic individuals, met the inclusion criteria for this study in the annual epidemiological survey of ophthalmology in the Xinjing Community of Shanghai in the SCODE study. All 160 subjects completed specimen collection by tear test paper, and 158 of these subjects only completed specimen collection by the conjunctival swab method. Therefore, 158 subjects were finally recruited in this study, including 79 diabetic patients and 79 healthy, nondiabetic individuals, and the two groups were assigned into the DM (including DM-T tear group and DM-S swab group) group and non-DM (including NDM-T tear group and NDM-S swab group) group. The number of both groups met the sample size requirement, and the basic profiles of the two groups were as follows: the mean ages of the DM group and the non-DM group were 67.47 ± 6.26 years and 68.68 ± 4.56 years, respectively, with no significant difference (P > 0.05). There were 39 and 34 males and 40 and 45 females in the two groups, respectively, with no statistical significance (P > 0.05). The BMIs of the two groups were 24.55 ± 3.17 and 24.64 ± 3.39, respectively, with no significant difference (P > 0.05). Fasting blood glucose was 6.99 ± 2.18 mmol/L in the DM group and 5.53 ± 0.79 mmol/L in the non-DM group, and the difference was statistically significant (t = 5.60, P < 0.05). The DM and non-DM groups were matched with each other in terms of sex, age and BMI; the differences were not statistically significant (P > 0.05), and the differences in fasting glucose were statistically significant (P < 0.05).
The distribution of ASV characteristic sequences/OTU representative sequences in the DM and non-DM groups was mainly between 404–431 bp in length, with an average of 425 bp per sequence, and 99.9% of the high-quality sequences had lengths distributed between 400 and 431 bp. Primer removal, mass filtration and chimera removal were carried out by the DADA2 method, and there was no statistical significance in the total number of effective sequences obtained between the DM group and the non-DM group (t = 1.43, P > 0.05). In the DM group, the total number of effective sequences was 9,129,441 (reads), and the total number of high-quality sequences was 7,569,884 (reads), accounting for 82.9%. The total number of effective sequences in the DM-S group was 10,388,711 (reads), and the total number of high-quality sequences was 8,341,766 (reads), accounting for 80.3%. In the non-DM group, the total number of effective sequences in the NDM-T group was 9,509,444 (reads), and the total number of high-quality sequences was 7,994,088 (reads), accounting for 84.1%. The total number of effective sequences in the NDM-S group was 9,621,626 (reads), and the total number of high-quality sequences was 7,680,882 (reads), accounting for 79.8%. The proportion of high-quality sequence quantities of tear paper was slightly higher than that of conjunctival swabs in both groups, and the difference was statistically significant (t = 2.13 and t = 4.46, P < 0.05).
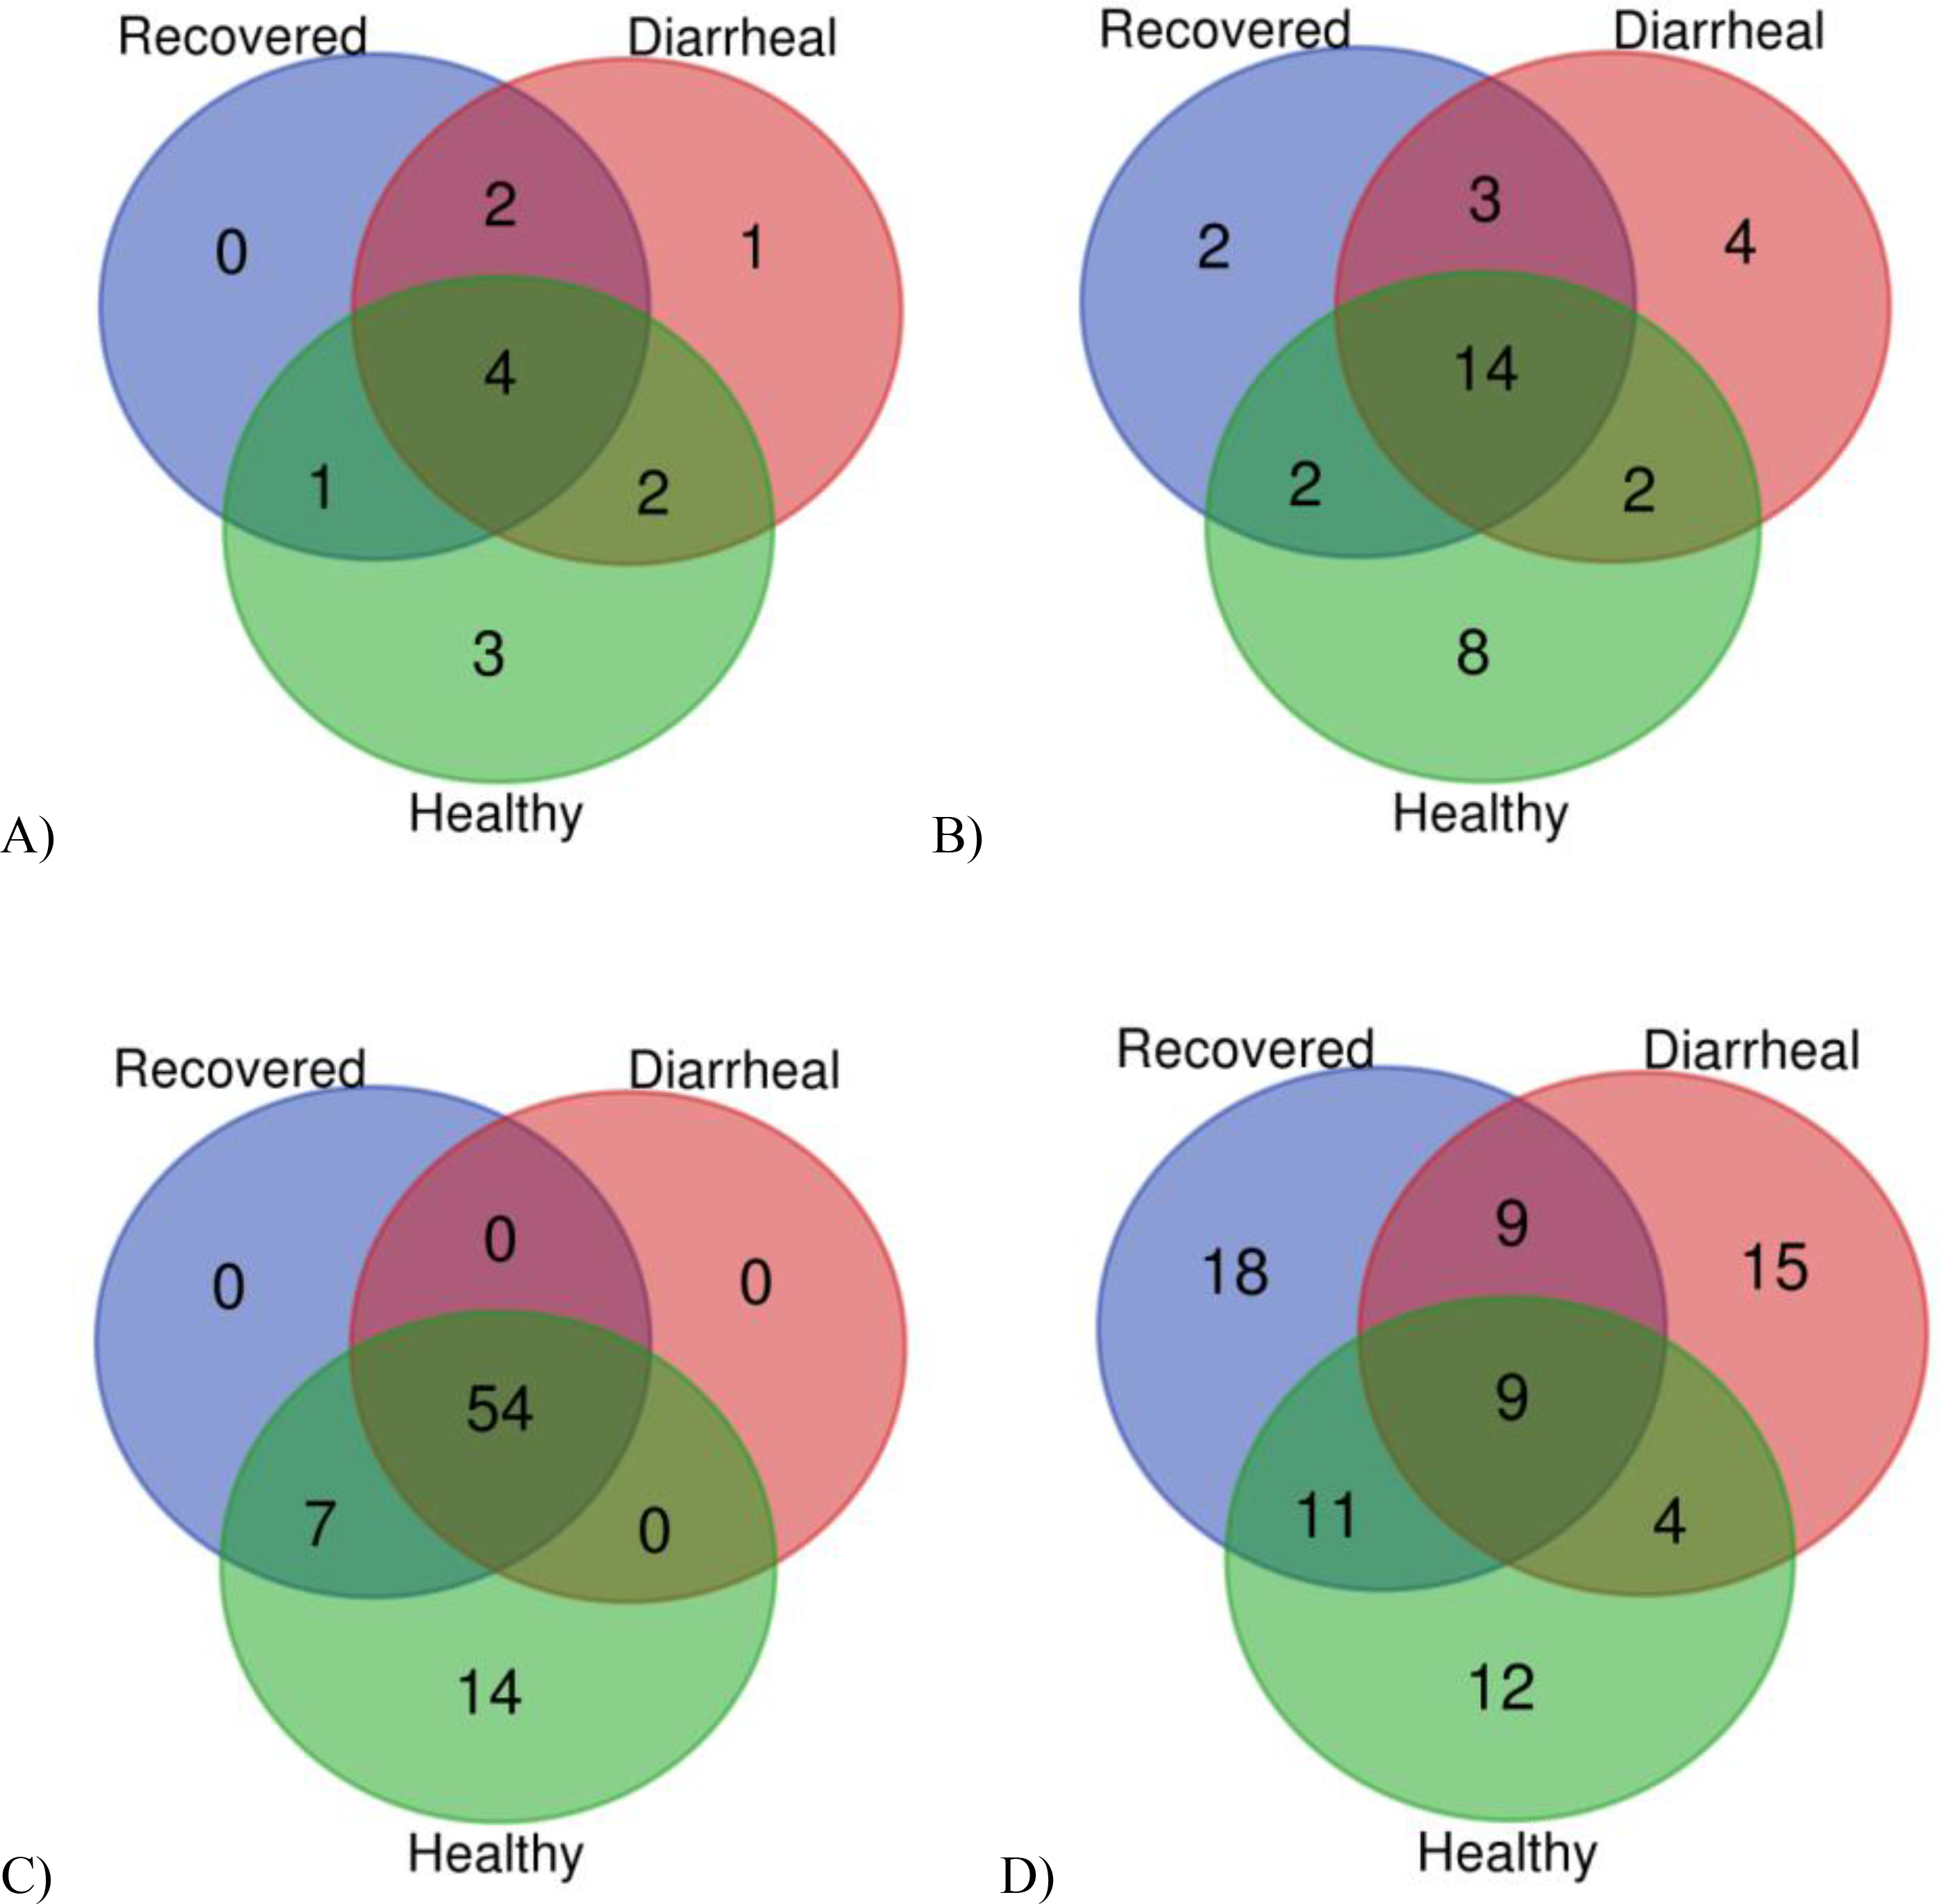
The high-quality sequences were grouped into ASVs/OTUs (operational taxonomic units) according to 98% sequence similarity, and the total ASVs/OTUs were calculated for each group at each taxonomic level of the domain, phylum, class, order, family, genus and species. A total of 884 ASVs/OTUs were annotated to the DM-T group, 790 to the DM-S group, 728 to the NDM-T group, and 768 to the NDM-S group (Fig. 1A). The results showed that there was a difference in the number of ASVs/OTUs annotated by the two sampling methods in the two different groups. In the DM group, the ASVs/OTUs annotated in the tear group were higher than those in the swab group, and in the NDM group, the ASVs/OTUs annotated in the swab group were higher than those in the tear group. A total of 1674 ASVs/OTUs were annotated in the DM group, which was significantly higher than the 1496 ASVs/OTUs in the NDM group.
Fig. 1
A The number of ASVs/OTUs in the four study groups; B Rarefaction Curve; C Species accumulation curves; D The number of taxa in four groups; E The relative abundance of four groups at phyla level (top 10); F The relative abundance of four groups at genus level (Top 20)
The flatness of the sparsity curve (Fig. 1B) reflected the magnitude of the effect of sequencing depth on the diversity of microbial communities. In this study, the sparsity curve gradually leveled off as the amount of sequencing data increased, indicating that the current sequencing depth was sufficient to reflect the richness and evenness of the microorganisms contained in this sample. The species accumulation curve (Fig. 1C) showed that the sample size was sufficient for this study.
The specific composition of microbial communities in each sample at each taxonomic level could be obtained by counting the ASVs/OTUs after resolving the differences induced by different depths of sampling. It was possible to calculate the number of taxonomic units contained in different groups at each taxonomic level (Fig. 1D), from which we can see that at the phylum, class, order, family, genus and species levels, both the DM and non-DM groups had more species detected in the tear group, with the DM group having a somewhat higher number of species detected than in the non-DM group.
Comparing the ocular bacterial taxon composition of the subjects in each group, the bacterial 16S rRNA sequences of the individual subjects were classified into the phylum level and genus level. At the phylum level (Fig. 1E), Proteobacteria abundance in the DM group was significantly higher than that in the non-DM group, while Actinobacteria abundance was significantly lower than that in the non-DM group. Proteobacteria, [Thermi], Chlorobacteria and Acidobacteria detected in tear test paper in the DM group and non-DM group were higher than those in the conjunctival swab tests of both groups, while Actinobacteria detected in tear test paper was significantly lower than that in the conjunctival swabs (QIIME2(2019.4) software).
At the genus level, most of the 16S rRNA gene sequencing results of ocular surface bacteria in each group were classified into 20 genera (Fig. 1F): Pseudomonas, Anoxybacillus, Cupriavidus, Corynebacterium, Chelatococcus, Curvibacter, Ochrobactrum, Coprococcus, Lactobacillus, Staphylococcus, Streptococcus, Blautia, Enhydrobacter, Novosphingobium, Agrobacterium, Rhodococcus, Clostridium, Bacteroides, Nesterenkonia, Thermus, etc. Corynebacterium in the DM group was lower than that in the non-DM group, while Curvibacter in the DM group was higher than that in the non-DM group. In both the DM group and non-DM group, the numbers of Ochrobactrum and Coprococcus in tear paper were higher than those in the conjunctival swabs, while the numbers of Anoxybacillus, Corynebacterium and Curvibacter were higher in the conjunctival swabs than those in the tear paper. The number of Pseudomonas detected on tear paper in the DM group was significantly higher than that in the conjunctival swab group (QIIME2(2019.4) software).
Our results showed that the alpha diversity indices of ocular surface microorganisms detected by tear test paper and conjunctival swabs in the DM group were not significantly different except for the observed species index (P > 0.05), revealing no differences in the abundance, uniformity and coverage of ocular surface microorganisms extracted by either tear test paper or conjunctival swabs in the DM group. In contrast, the alpha diversity indices of ocular surface microorganisms detected by tear paper and conjunctival swabs in the non-DM group were significantly different except for the Faith-pd index (P < 0.05), suggesting differences in the abundance, uniformity and coverage of ocular surface microorganisms extracted by tear paper and conjunctival swabs in the non-DM group. The alpha diversity indices of ocular surface microorganisms detected by tear paper in both groups were significantly different except for the Shannon index (P < 0.05), indicating that the microorganisms extracted by tear paper differed in abundance, uniformity, and coverage, whereas the microorganisms extracted by conjunctival swabs in both groups did not differ in abundance, uniformity, and coverage. (Fig. 2A, Table 1).
Fig. 2
A Alpha diversity index analysis of the four study groups; B Analysis of differences between the four groups; C PCoA analysis; D NMDS analysis
Table 1 Alpha diversity index analysisThe PLS-DA discriminant model based on the relative abundance at the species level was constructed by the unweighted UniFrac distance algorithm, with NMDS dimension taken as 2 and elliptical confidence level 0.95. The.
PCoA analysis and NMDS analysis are shown in Fig. 2C and D. In this study, the ocular surface microbes represented by two different sampling methods across all participants showed differences. Meanwhile, the ocular surface microbes detected by the same sampling method in the DM group and the non-DM group also showed differences.
Using the Bray–Curtis distance matrix file, "PERMANOVA" analysis for intergroup differences was performed with the scikit-bio package in Python, and the differences in microorganisms detected by both tear paper and conjunctival swabs in the DM and non-DM groups were statistically significant (Fig. 2B and Table 2). Differences were found between the DM and non-DM groups for the tear paper method but not for the conjunctival swab method. Again, this indicates that there were differences in the ocular surface microbiota represented by the two different sampling methods.
Table 2 Analyses of differences between the four groupsLEfSe analysis was used to further compare the species composition differences between the tear paper and conjunctival swab methods in the DM group and the non-DM group, and marker species with significant differences were obtained (Fig. 3A, B, C, and D). In the non-DM group, tears were more abundant with Proteobacteria, Bacteroidetes, [Thermi], Chloroflexi, Acidobacteria and Cyanobacteria at the phylum level (P < 0.05), while only Actinobacteria abundance in swabs was significantly different (P < 0.05). Tear test paper showed that the levels of Cupriavidus, Chelatococcus, Lactobacillus, Ochrobactrum, Staphylococcus, Coprococcus, Thermus, Blautia, Clostridium, and Bacteroides and the high abundance of Acinetobacter were significantly different (P < 0.05), and conjunctival swabs showed a significant difference in the high abundance of Corynebacterium and Curvibacter (P < 0.05). Compared with the non-DM group, the abundance of Proteobacteria, [Thermi] and Chloroflexi was higher in the DM group, as was the abundance of Firmicutes (P < 0.05). Tear test paper showed significant differences in the levels of Pseudomonas, Blautia, Coprococcus, Thermus, Staphylococcus, and Rhodococcus and a high abundance of Clostridium (P < 0.05). Conjunctival swabs showed significant differences in Corynebacterium and Chelatococcus and a high abundance of Lactobacillus (P < 0.05).
Fig. 3
Species with significant differences between the two groups(P < 0.05): A LEfSe analysis in DM-T and DM-S group; B LEfSe analysis in NDM-T and NDM-S group; C LEfSe analysis in DM group and NDM group with tear test paper; D LEfSe analysis in DM group and NDM group with conjunctival swabs
The abundance of Proteobacteria detected in the tear test was significantly higher in the DM group than in the non-DM group (P < 0.05), and the abundance of Firmicutes in the non-DM group was significantly higher than that in the DM group (P < 0.05). The abundance of Pseudomonas and Curvibacter was significantly higher in the DM group than in the non-DM group (P < 0.05), while the abundance of Anoxybacillus, Cupriavidus, Chelatococcus, Ochrobactrum, Staphylococcus, and Agrobacterium was significantly higher in the DM group than that in the non-DM group (P < 0.05). The abundance of Bacteroidetes and [Thermi] detected by conjunctivitis swabs in the DM group was significantly higher than that in the non-DM group (P < 0.05), while the abundance of Actinobacteria in the non-DM group was significantly higher than that in the DM group (P < 0.05). At the genus level, the abundance of Lactobacillus, Aquabacterium and Bacteroidetes in conjunctival swabs in the DM group was significantly higher than that in the non-DM group (P < 0.05), while the abundance of Corynebacterium and Streptococcus in the non-DM group was significantly higher than that in the DM group (P < 0.05).
留言 (0)