
記住我
More than a million sexually transmitted infections are acquired every day worldwide.1 Data from different parts of the world have revealed a decline in bacterial sexually transmitted infections which is reflected as a relative rise in viral sexually transmitted infections.2-6
This retrospective study, carried out in a tertiary center, was aimed to find out the clinical referral patterns of sexually transmitted infections in patients who attended the sexually transmitted infection clinic attached to the Dermatology and Venereology Department of Government Medical College, Kozhikode, and to study the linear trends in the pattern of sexually transmitted infections over 20 years.
Methods Inclusion criteriaAll patients diagnosed to have sexually transmitted infections at the sexually transmitted infection clinic of Government Medical College, Kozhikode from 1.1.1998 to 31.12.2017 were included after obtaining clearance from the institutional ethics committee.
Exclusion criteriaPatients having vulvovaginal candidiasis, bacterial vaginosis and molluscum contagiosum of genital areas were excluded. Patients with suspected sexually transmitted infections (other than herpes genitalis and genital wart where the diagnosis was made clinically) were excluded when laboratory tests like Gram stain, tissue smear or biopsy failed to support any specific diagnosis.
Case records of study subjects were reviewed using a preset questionnaire to collect information regarding patient characteristics, clinical features, investigation results and diagnosis.
Data were entered in Microsoft Excel, clinical patterns were identified and analyzed with trend analysis and sequence charting using MS Excel and SPSS Inc IBM company version 16 Chicago, SPSS Inc. (United States of America).
ResultsDuring the study period, 2470/5227 patients (47.3%), who attended our sexually transmitted infection clinic satisfied the inclusion criteria. The male to female ratio was 0.8:1 (1404 females and 1066 males). At presentation, 141/1404 females (10%) and 376/1066 males (35.3%) were unmarried which constituted 20% of the total (517/2470).
Among women, 802 (57.1%) were referred patients. Gynecologists referred 588 cases (73.3% of the total referrals). Various departments of our institution referred 260/1404 (18.5%) female patients. The gynecology department of the institution referred 227 (16.2% of the total) cases. 602 females (42.9%) and 800 males (75%) attended our local outpatient clinic on their own and were directed to the sexually transmitted infection clinic. The rest of the male patients (25%) were referred to us.
A significant proportion of patients (749, 30.3%) had multiple sex partners. Table 1 shows the sexual behavior of the study subjects.
Table 1:: Sexual behavior patterns documented in the study group
Gender (n) Opposite sex contact (%) Same sex contact (%) Bisexuals (%) Male (1066) 858 (80.5) 162 (15.2) 46 (4.3) Female (1404) 1395 (99.4) 7 (0.5) 2 (0.1) Total (2470) 2253 (91.2) 169 (6.8) 48 (1.9)Herpes genitalis (964, 39%) and condyloma acuminata (921, 37.9%) predominated, followed by syphilis (418, 17.2%). Nongonococal (57, 2.3%) and gonococcal urethritis (55, 2.26%) were comparable in frequency.
Viral sexually transmitted infections (1885, 76.3%) outnumbered bacterial sexually transmitted infections (575, 23.3%). Trichomoniasis accounted for 0.4% (n =10) of cases. Viral sexually transmitted infections and trichomoniasis were more common in females while the opposite was observed for bacterial sexually transmitted infections .
HIV coexisting with sexually transmitted infection was noted in 159 (6.4%) patients with a male to female ratio of 1.7:1 (100 males and 59 females). At the time of diagnosis of sexually transmitted infection, 113/159 (71.1%) had a prior diagnosis of HIV infection. In 46 patients (28.9%) HIV infection was detected during the evaluation of sexually transmitted infection.
On trend analysis, total sexually transmitted infections documented a polynomial trendline [r2 = 0.75, Figure 1]. It showed a decline from the maximum number of cases (n = 189) recorded from 1999 to 2001, followed by a fluctuating course with the lowest numbers (n = 74) in 2010. But an ascending trend was observed in 2017.
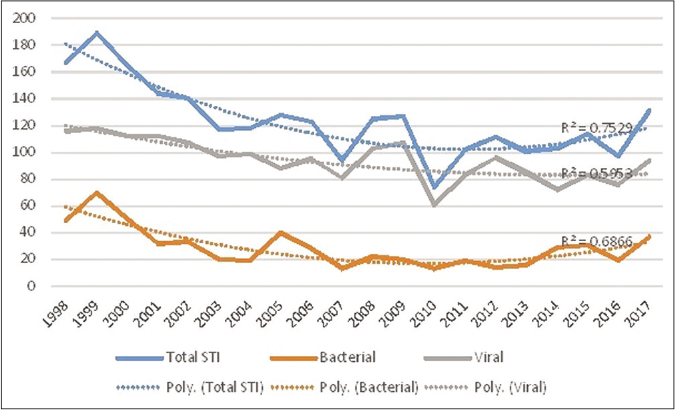
Figure 1:: Linear trends over 20 years (1998–2017) in total, bacterial and viral sexually transmitted infections among patients attending a tertiary care center in North Kerala, India (y-axis shows the annual number of cases)
Export to PPT
After the maximum number of syphilis cases recorded in 1999 (n = 55), the trend showed a sharp decline in 2000. Subsequent years showed only minor fluctuations in disease frequency best explained by a polynomial trend line with an r2 value of 0.568 [Figure 2]. After 2012 (n=9) an overall ascending trend was noted till 2017 with a small dip in 2016. On analyzing different stages of syphilis, it was obvious that the trend in syphilis was mostly following that of late syphilis/ syphilis of unknown duration till 2013; but since 2014 an increase in early syphilis was documented [Figure 3].

Figure 2:: Linear trend of syphilis (blue line) over 20 years (1998–2017) among patients attending a tertiary care center in North Kerala, India (y-axis shows the annual number of cases). Black line represents the trendline
Export to PPT
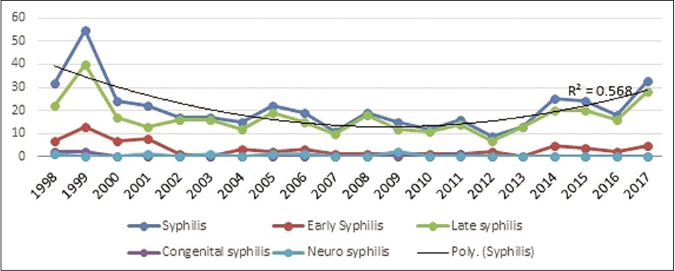
Figure 3:: Linear trend of different stages of syphilis over 20 years (1998–2017) among patients attending a tertiary care center in North Kerala, India (y-axis shows the annual number of cases)
Export to PPT
After remaining almost at the same level till 2001, herpes genitalis cases showed fluctuations from 2002 onwards; significant drops were documented at intervals of 2–4 years, but these were not sustained [Figure 4]. A maximum of 60 cases was observed in 2001and the minimum number of 35, was recorded in 2005, 2010, and 2014.
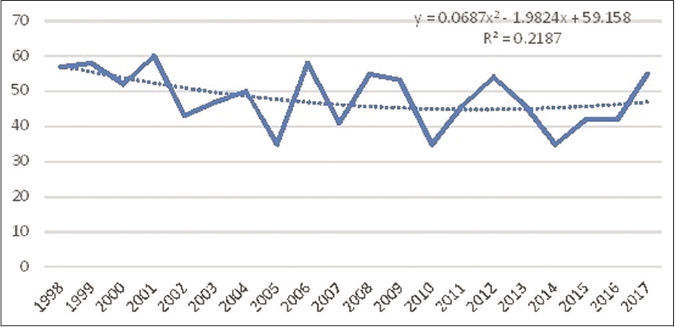
Figure 4:: Linear trend of herpes genitalis (solid line) over 20 years (1998–2017) among patients attending a tertiary care center in North Kerala, India (y-axis shows the annual number of cases). Dotted line represents the trendline
Export to PPT
Condyloma acuminata, on the contrary, showed a reduction in the number of cases over the 20 years [Figure 5]. But overall, there was a polynomial trend [r2 -0.648, Figure 5] with fluctuations from 2001, after remaining almost at the same level from 1998 to 2000. The maximum number of cases was documented in 2002 (n =64) and the minimum in 2010 (n = 26).
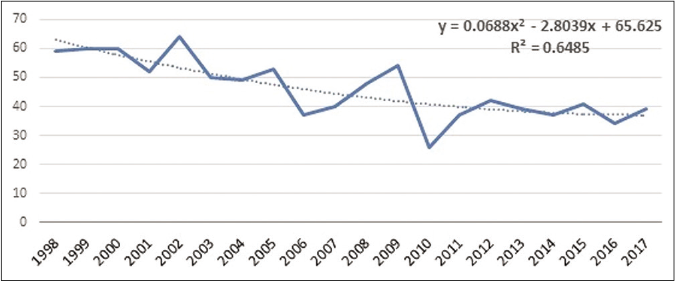
Figure 5:: Linear trend of condyloma acuminata (solid line) over 20 years (1998–2017) among patients attending a tertiary care center in North Kerala, India (y-axis shows the annual number of cases). Dotted line represents the trendline
Export to PPT
Gonorrhea recorded a maximum of ten cases in 2000 and a minimum in 2003 with no case reported. After 2003, the disease remained at a low level till 2017. A polynomial trend (r2 -0.616) was observed [Figure 6]. A somewhat similar trend was observed for non-gonococcal urethritis also, with a sharp decline in 2001 and minor fluctuations at low levels thereafter till the end of the study period [Figure 7].
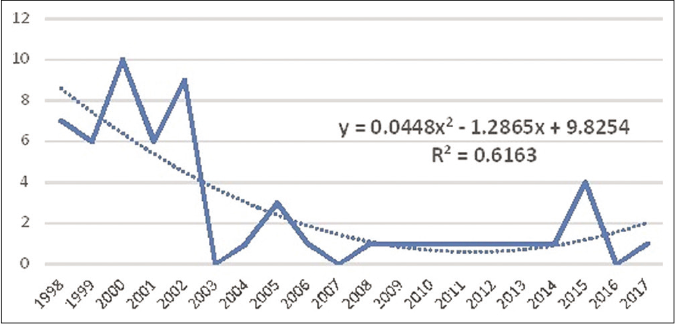
Figure 6:: Linear trend of gonorrhea (solid line) over 20 years (1998–2017) among patients attending a tertiary care center in North Kerala, India (y-axis shows the annual number of cases). Dotted line represents the trendline
Export to PPT

Figure 7:: Linear trend of nongonococcal urethritis (solid line) over 20 years (1998–2017) among patients attending a tertiary care center in North Kerala, India (y-axis shows the annual number of cases). Dotted line represents the trendline
Export to PPT
Meaningful analysis of trend was not possible for donovanosis, lymphogranuloma venereum and trichomoniasis as the total number of cases was low.
As a whole, bacterial sexually transmitted infections showed a polynomial trend (r2 -0.686) [Figure 1]. The highest and lowest number of cases were recorded in 1999 (n = 70) and 2007 (n = 13), respectively. Except for two larger peaks in 2005 and 2017, the fluctuations noted were mostly at low levels.
Viral sexually transmitted infections were also at a maximum frequency in 1999 (n = 118), then showed a gradual decline, till 2005, after which significant dips and rises at varying intervals of 2–4 years were documented (r2 -0.595) with the lowest levels being observed in 2010 (n = 61) [Figure 1].
Over the two decades, viral sexually transmitted infections decreased and remained low, though not as marked as the bacterial sexually transmitted infections.
DiscussionPatients manifesting bacterial vaginosis, vulvovaginal candidiasis and molluscum contagiosum affecting genital areas were excluded since the possibility of a nonsexual mode of transmission could not be absolutely ruled out.
The female preponderance observed was discordant to other studies conducted in sexually transmitted infection clinics. This could be due to the study being conducted in the sexually transmitted infection clinic in a tertiary care center where suspected cases receive a prompt referral from the nearby gynecology department.2,3 Among the female sexually transmitted infection patients, 227 (16.2%), being referred from the gynecology department of our institution supports this viewpoint and highlights the role of linkage between different specialties in women’s sexual health.7
The predominance of viral sexually transmitted infections observed by us was comparable to recent studies on sexually transmitted infections, though certain other studies documented syphilis as the most common sexually transmitted infection.2,3,7,8 Syphilis predominating among bacterial sexually transmitted infections was consistent with previous data.2,8,9
Female predilection noted for viral sexually transmitted infections could be due to the higher risk of clinically symptomatic infections in them. Male predominance noted in bacterial sexually transmitted infections might be due to the tendency of females to opt for gynecologists and the response of most bacterial sexually transmitted infections to routinely used antibiotics with less chance of recurrence warranting referral.
Female predilection noted for trichomoniasis was consistent with the longer duration of infection documented in females.10 More than 6% of sexually transmitted infection patients manifesting coexisting HIV was as documented in previous studies from sexually transmitted infection clinics.11
The ascending trend noted in syphilis cases in later years, especially the early infective stage needs monitoring in the background of reports of re-emergence of syphilis worldwide.5,6
The lack of a marked decline in herpes genitalis cases was consistent with the literature.2,7,9 The infection is mostly transmitted within long term couples with the median interval of three months for disease transmission. Hence strategies targeting serodiscordant couples may be more effective in the prevention of transmission whereas most sexually transmitted infection programs target high-risk groups.12
The decline noted in condyloma acuminata cases whether reflects an actual reduction or was an outcome of better facilities available at peripheral centers remains unclear. Previous studies give conflicting results.2,7,8 Decline of new cases among teenagers is reported from the developed world which is attributed to the introduction of human papillomavirus vaccines.2,13
Contrary to studies from the western hemisphere that reported a rise in chlamydia infection, an increase in nongonococcal urethritis was not observed by us. This could be due to the non-availability of better diagnostic facilities required for accurate classification and due to missing cases in the community in a study conducted in a referral center.6,9,14
Chancroid, lymphogranuloma venereum and donovanosis cases remained negligible throughout the study period as reported by others.2,3,7-9
The declining trend observed for sexually transmitted infections, especially for bacterial sexually transmitted infections, was consistent with existing data.2,9
The disturbing ascending trend observed during the final years of the study needs to be watched closely, especially in the background of decreasing international funding for preventive measures and shifting of focus to chemoprophylaxis of HIV.
LimitationsThe study carried out in a referral center, not reflecting the status in general population and our inability to do more accurate diagnostic tests (culture, polymerase chain reaction and nucleic acid amplification tests) were the limitations.
ConclusionOverall sexually transmitted infections showed a declining trend, which was more marked for bacterial sexually transmitted infections. But the ascending trend documented in total sexually transmitted infections, especially syphilis in the last couple of years needs to be followed up to plan future strategies.
留言 (0)