The present analysis, registered at www.clinicaltrials.com (NCT05209477, released on 01/26/2022), was conducted on prospectively collected data describing the clinical course of COVID-19 patients admitted to the ICU of Perugia University Hospital, Italy, following the approval by the local ethical committee (Protocol No. 3658/20). The study was performed in line with the Helsinki Declaration principles. Written informed consent was waived due to the observational nature of the study. All patients were treated according to the standard clinical practice and local institutional protocol.
Enrollment
From January to May 2022, all critically ill adult patients undergoing IMV with sedation and muscular paralysis for ARDS related to COVID-19 and suitable for prone positioning as a rescue therapy were screened. Concurring with the local institutional protocol, the decision was made to prone patients when the partial arterial oxygen tension on inspired oxygen fraction ratio (PaO2/FiO2) was < 150 mmHg following intubation by an attending physician [14]. Exclusion criteria included: pregnancy, inability to obtain a complete lung ultrasound assessment due to difficult sonographic windows, any contraindication to prone position [15], pneumothorax and pneumomediastinum, chronic obstructive pulmonary disease, any contraindication to recruitment maneuver [16], hemodynamic instability [17], prone position application after 3 days from IMV onset [7].
Study protocol
Enrolled patients were initially ventilated using a volume-controlled setting in the supine position (baseline) to achieve tidal volumes of 6 to 8 ml/kg [5] of predicted body weight. In addition, positive end-expiratory pressure (PEEP) was applied in combination with an inspired oxygen fraction (FiO2) defined by low PEEP–FiO2 tables to achieve peripheral oxygen saturations (SpO2) of 88–95% [18].
After the onset of 1 h of protective ventilation, a 2-min-lasting recruitment maneuver was administrated in the pressure-controlled ventilation mode (recruitment) with a total inspiratory pressure of 35 cmH2O [5]. The PEEP and FiO2 remained as set up during baseline step and the mechanical respiratory rate was set to 10 breaths/min with an inspiration-to-expiration ratio of 1:1. Subsequently, patients were proned whilst remaining on the same ventilator settings as in baseline step (pronation).
Measurements
Before the study enrollment, the following demographic and clinical data were collected: age, gender, predicted body weight, PaO2/FiO2 after intubation, comorbidities, days spent with NIRS before intubation, infection diagnosis to intubation delay, hospital admission to intubation delay, IMV duration, sequential organ failure assessment (SOFA) score, PEEP, and FiO2. Following completion of STEP1, 2, and 1 h of prone position lung ultrasound and arterial blood gases (ABGs) analysis were carried out whilst also assessing respiratory system mechanics and hemodynamic status. ABGs analysis was performed to assess pH, PaO2, PaO2/FiO2, and partial arterial carbon dioxide tension (PaCO2).
Expiratory tidal volume and respiratory rate values were obtained from the ventilator [19] at the end of each step and respiratory system compliance along with driving pressure were computed. Vital signs were continuously assessed for the whole study duration, monitoring the SpO2, invasive arterial blood pressure, heart rate, and ECG.
Technical components
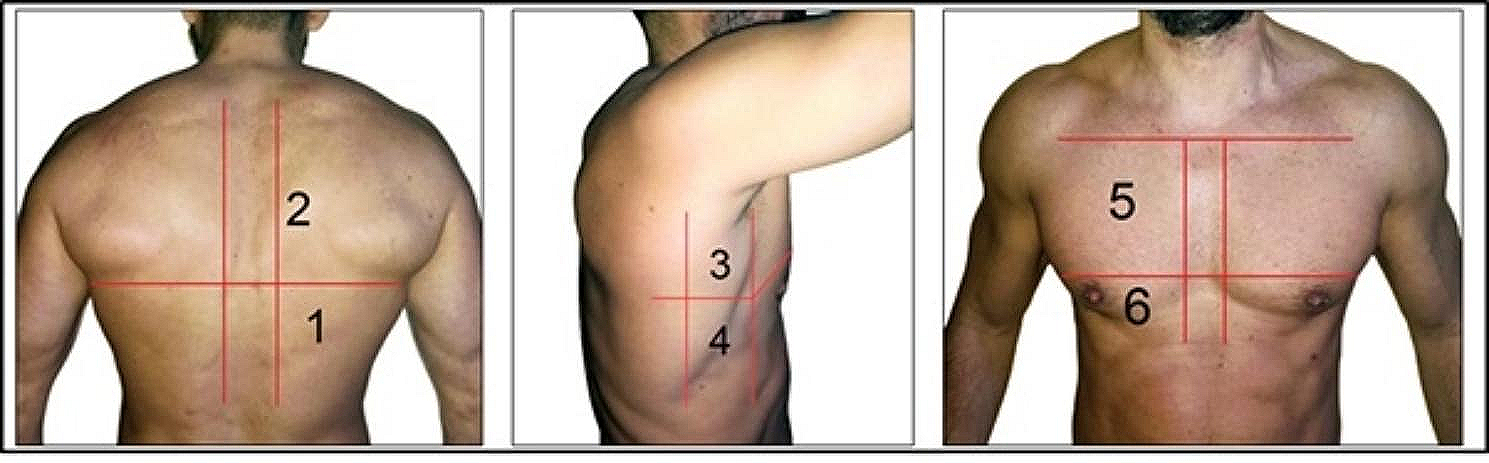
Lung ultrasound was performed at the bedside as previously described [20,21,22], using a portable ultrasound machine equipped with both 2.0–4.0 MHz-convex and 7.5–12.0 MHz-linear probes (MylabX6, Esaote SPA, Italy). Six quadrants for each hemithorax were scanned: the superior and inferior parts of the anterior, lateral, and posterior regions of the chest wall. In each region, LUS and the corresponding aeration pattern were computed as previously indicated [20,21,22]: A-line alone or in combination with less than 3 B lines (0 point—normal aeration pattern); B lines present in less than 50% of the pleural line (1 point—B1 aeration pattern); B lines present in more than 50% of the pleural line (2 points—B2 aeration pattern); total loss of aeration suggestive for lung consolidation (3 points—C aeration pattern). Accordingly, global and regional LUS were computed. The global LUS was defined as the sum of the scores obtained in the 12 sonographic lung regions and varied from a minimum of 0 (normal aeration pattern) to a maximum of 36 (complete loss of aeration) [20,21,22]. The regional LUS was computed for the anterior, lateral, and posterior regions of interest as well as the superior and inferior regions [20]. The regional LUS corresponded to the mean score of all pertaining intercostal spaces of each region and ranged from a minimum of 0 points to a maximum of 3 points.
The ultrasonography assessors were not involved in patients’ care. In addition, ultrasonographic and clinical data were independently gathered and stored by a data collector, not involved in the ultrasound assessment and patients’ care.
Statistical analysis
According to previous findings [19], to observe a reduction of LUS from 22 ± 3 in supine position to 20 ± 4.9 in prone position, a total sample size of 20 subjects was computed (Type I error rate of 0.05 and a Type II error rate of 0.20, 80% power).
Continuous variables were described as median and 25th–75th interquartile range. The comparison between all the study steps was performed by Friedman’s test for nonparametric repeated measures and Post Hoc test with Bonferroni’s correction. To assess the effects of ventilatory strategy (supine, recruitment, prone) and lung region of interest (anterior, lateral, and posterior–superior and inferior) on the dependent variable, a generalized mixed model analysis with Satterthwaite methods for degrees of freedom and Post Hoc test with Bonferroni’s correction were employed. A generalized linear mixed model (GLMM) was estimated on the observed data. The graphical representation of the GLMM predicted values of PaO2/FiO2 according to LUS has been reported together with the 95% confidence bounds. Two-tailed tests were applied for hypothesis testing and statistical significance was considered for p values < 0.05. Statistical analyses were carried out through R3.5.2 software (The R Foundation).


留言 (0)