
記住我
The genomic data was retrieved in fasta format (.faa and .fna files) for some important Salmonella Typhi strains included in this study, available at the GOLD database (Genome Online Database, http://gold.jgi.doe.gov) and strains comprising their complete genomes, gene and protein sequences were retrieved from (NCBI) National center for biotechnology information (http://www.ncbi.nlm.nih.gov). This database provides a comprehensive open-source access to information regarding genome and meta-genome sequencing projects and their associated meta-data around the world. A total of eight (8) Salmonella enterica subsp. enterica serovar Typhi strains were included in this study. Genome statistics like genome size, number of proteins, % GC content, bio-project information and genome assembly data, among others, of all the selected strains are tabulated below (Table 1).
Table 1 Genome statistics of Salmonella Typhi strains available at National Center for Biotechnology Information (NCBI)Phylogenetic analysesA phylogenetic tree is an estimation of the relationships among taxa or sequences and their hypothetical common ancestors [45,46,47,48]. Today most phylogenetic trees are built from molecular data like DNA or protein sequences. Building a phylogenetic tree requires four distinct steps, which are as follows; step-1: identify and acquire a set of homologous DNA or protein sequences, step-2: align those sequences, step-3: estimate a tree from the aligned sequences, and step-4: present that tree in such a way as to clearly convey the relevant information to others [48]. For this purpose, we selected the long chain of 16S rRNA house-keeping genes for phylogenetic tree construction. A multi-fasta file (sequences of 16S rRNA genes from 8 strains) was prepared and used as an input file here, each constituting 479 amino acid residues. The tree was constructed in MEGA (v10) using neighbor joining method showing the relative position of each strain in comparison to others (Fig. 2).
Fig. 2
Evolutionary relationships of taxa: The evolutionary history was inferred using the Neighbor-Joining method [49] for this unrooted tree. The bootstrap consensus tree inferred from 1000 replicates is taken, with two main clusters, to represent the evolutionary history of the taxa analyzed. Branches corresponding to partitions reproduced in less than 50% bootstrap replicates are collapsed. The percentage of replicate trees in which the associated taxa clustered together in the bootstrap test (1000 replicates) are shown next to the branches. The evolutionary distances were computed using the Poisson correction method and are in the units of the number of amino acid substitutions per site [50]. This analysis involved 8 amino acid sequences. All ambiguous positions were removed for each sequence pair (pairwise deletion option). There was a total of 479 positions in the final datasets. Evolutionary analyses were conducted in MEGA (v10) [48]
Mining Core genome, non-host homologous and essential genomeThe core genome/proteome of Salmonella enterica Typhi comprised of 3207 genes/proteins. For this, Salmonella enterica Typhi CT18 was randomly selected as the reference genome, using the EDGAR platform with default parameters. The core region of nucleotides of selected microorganisms represents the conserved set of genes among all strains that might contain interesting therapeutics targets for drug development projects. Since Salmonella Typhi is a human pathogen therefore it is necessary to filter out those genes/proteins which exhibit certain degree of homology towards their host proteome, a step know as host off-targeting. The comparison to the NCBI-BLASTp program separated human homologs from the aforementioned core proteome and resulted in 2450 proteins. Afterwards, the file of 2450 proteins were submitted to the DEG database for essential genes identification. Essential genes/proteins represent a minimal set of data vital for an organism’s survival and this analysis drastically reduced our dataset to only 37 essential proteins and are given in supplementary materials (S1_table_37_targets and S1_data_37_targets).
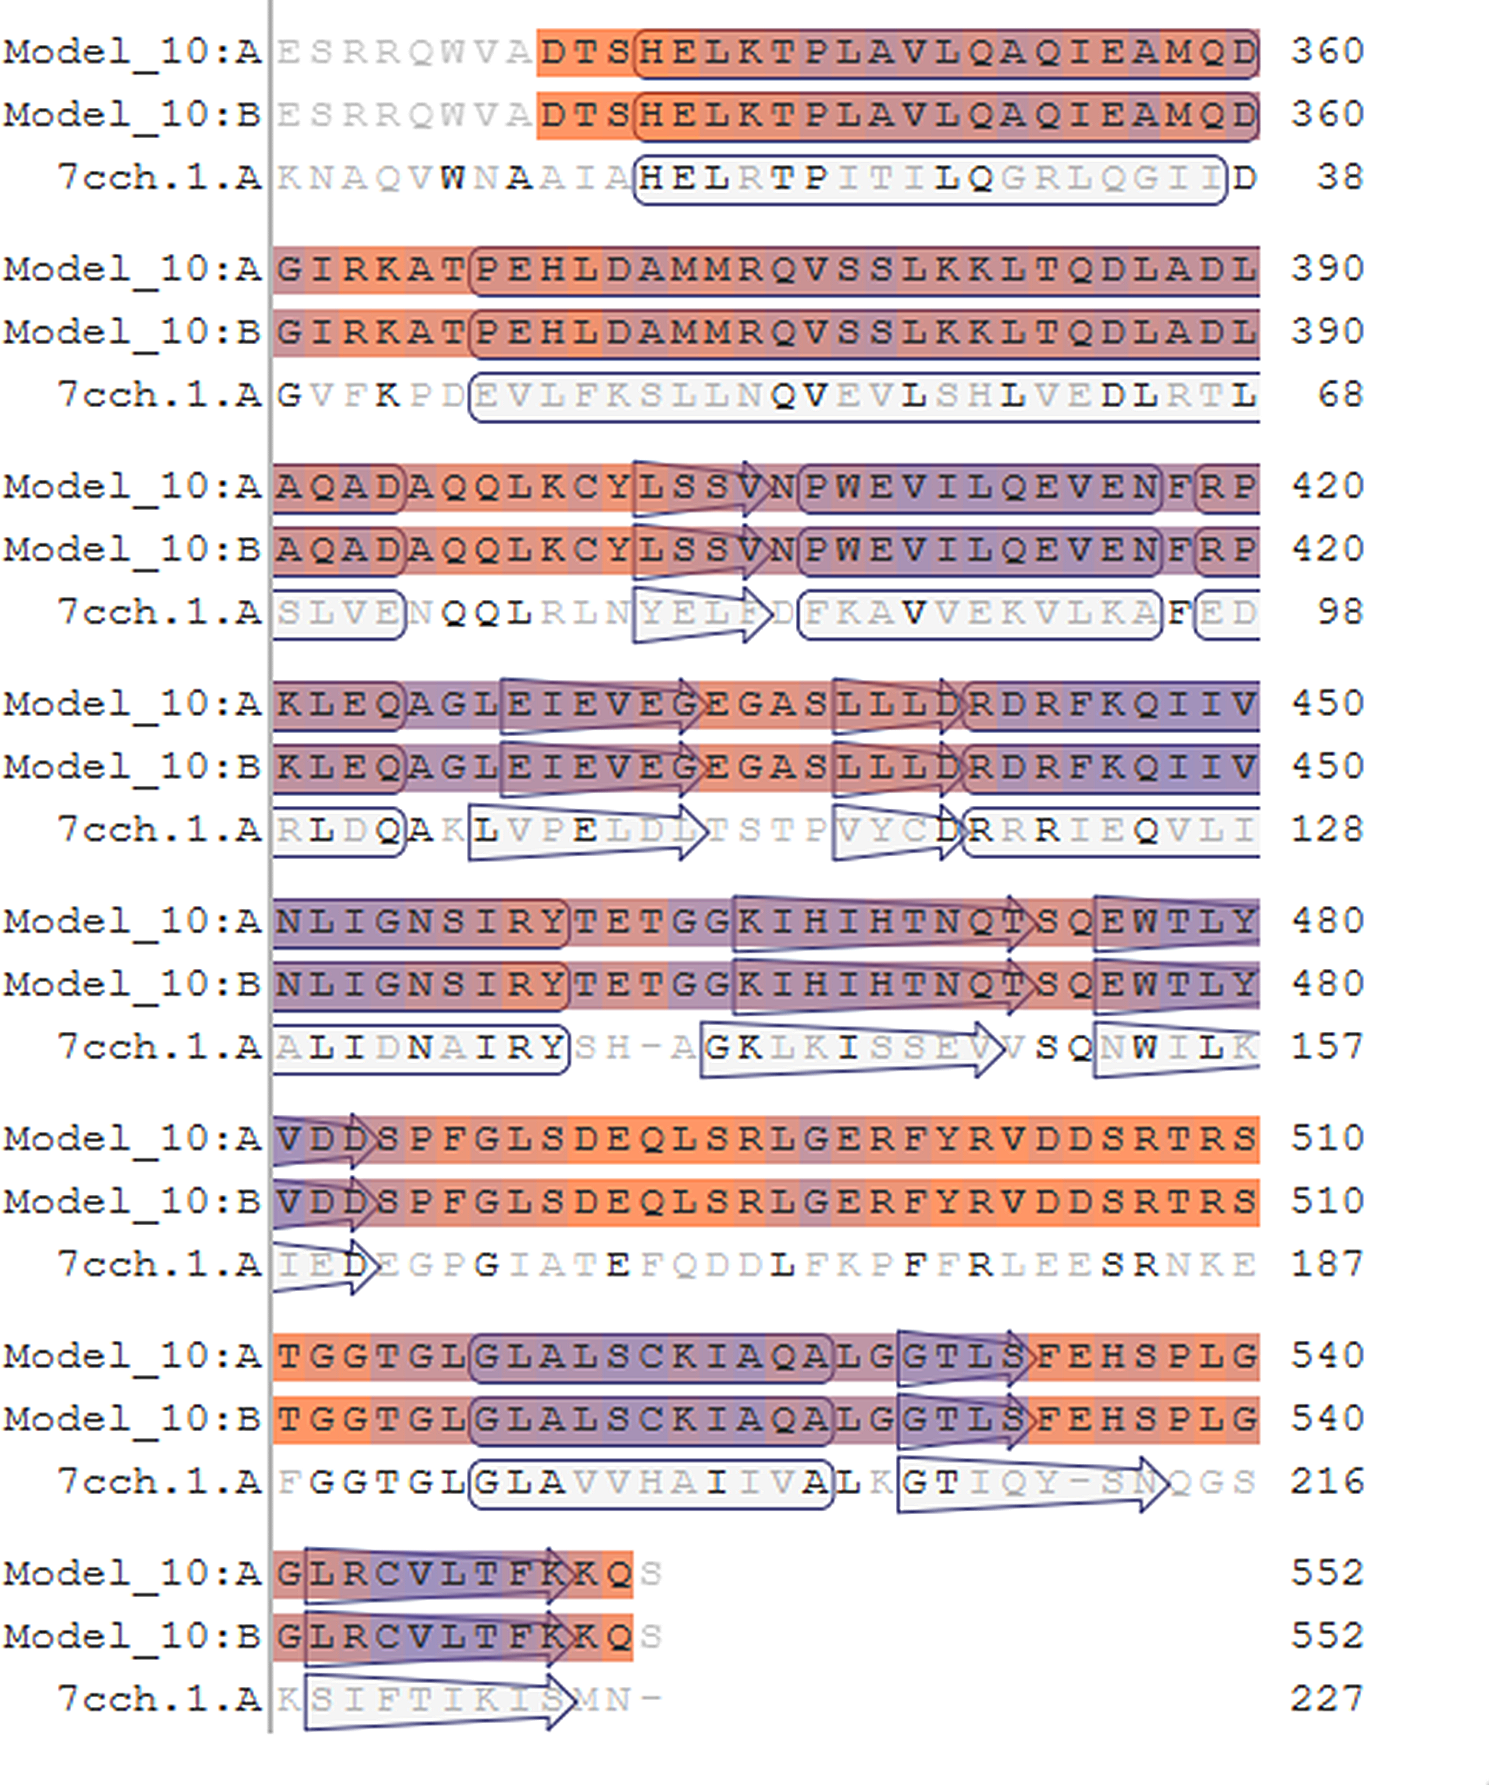
Modelome construction (3D comparative homology modelling)The three-dimensional structure of proteins infers their functions and therefore are of utmost importance in understanding their role in various biological processes, specifically in pathogen target identifications projects and developing inhibitors/drugs for them. Since no experimental structural information are available in the RCSB-PDB database, therefore both MHOLline and SWISS-MODEL were deployed for protein 3D structures identification. The set of core, essential and non-host homologous (CENHH) proteins were consequently subjected to both structure prediction workflows and in total, 7 structures were obtained (S2_data_7_targets), out of which only 4 (S3_data_4_targets) showed high quality that were selected as the final targets (Ramachandran value ≥ 90%). The PDB templates identified by the SWISS-MODEL for constructing 3D models were; STY0490_WP_000122257.1=6nb1.1.A, STY2284_WP_001103591.1=4gud.1.A, STY3473_WP_000764715.1=3tzf.1.A, and STY4091_WP_000116577.1=5vpu.1.A (also Table 2). For all constructed models, the coverage between the target and template sequences was > 90%, and the identity was ≥ 50%, with the highest coverage and identity for STY0490_WP_000122257.1. In comparative homology modelling for 3D structures, these values are considered as better [16, 17, 33]. For each target, the SWISS-MODEL and the PDBsum generated the Ramachandran plots, though all the four models qualify this quality-check threshold, there is a slight variation in their Ramachandran values. In any case, a good quality 3D model would be expected to have over 90% residues in the most favored regions [1,2,3]. The QMEAN Z-Score demonstrates that how many standard deviations from the mean is my target model score, given a score distribution from a large set of experimentally determined structures. Thus, a Z-score around 0.0 reflect a “native-like” structure and a Z-score below − 4.0 indicates a model with low quality [51]. It is evident from Table 2 that all the four targets exhibited an acceptable QMEAN Z-Score. QMEANDisCo Global Scores are the average per-residue QMEANDisCo score, which has been found to correlate well with the lDDT score [52]. QMEANDisCo is a composite score for single model quality estimation. It employs single model scores suitable for assessing individual models, extended with a consensus component by additionally leveraging information from experimentally determined protein structures that are homologous to the model being assessed. Typically, residues showing a score below 0.6 are expected to be of low quality [53,54,55,56]. The details of different values of structure validation analyses are given in supplementary materials for all identified targets, respectively (S1_figures (a-g) – S4_figures (a-g).
Table 2 Molecular weight and druggability characterization of the predicted targetsMolecular weight and Druggability analysesFinally, the molecular weight of the target proteins and their respective druggable pockets/cavities were determined prior to virtual screening and molecular docking. The molecular weights (MW) of potential targets were assessed using ExPASy Server and were classified accordingly (https://web.expasy.org/compute_pi/). The druggability of a protein mlecule defines their efficiency to bind a drug-like molecule. For this purpose, the DogSiteScorer program (www.proteins.plus/www.Dogsite.zbh.uni-hamburg.de) aided in exploring the druggable pockets. The DoGSiteScorer automatically predict pockets and sub-pocket in a target protein 3D structure, performs functional characterization and druggability estimation. A highly druggable protein is considered the one that shows maximum interaction affinity toward a drug molecule. The druggability measurement is measured on a scale of 0–1, for a medium to high druggable protein, the score is ≥ 0.6 while for highly druggable protein, it is ≥ 0.8 (Table 2). A protein of interest might contain several predicted druggable pockets yet the highly druggable pockets are normally considered for docking analyses. The drug targets were further crosschecked in the Target-Pathogen Database (http://target.sbg.qb.fcen.uba.ar) to prioritize them by determining the structural druggability, essentiality and different metabolic roles.
Protein-protein interaction networkThe current STRING database contains information of about 24,584,628 proteins and their interactions from more than 5000 organisms. Mainly these interactions are derived from 5 sources including a) predictions at genomic data b) high-throughput wet-lab experimental data c) co-expression data from conserved sequences d) automatic text mining from literature etc., and e) previous knowledge in other databases. It is an integrated bioinformatics web database of known (direct physical/experimental data) and indirect predicted protein–protein interactions (functional association data). The interactome for 37 essential and non-host homologs was build that was useful to check interactions of the target proteins with the neighbors. We emphasized our search whether our predicted targets were involved in more than a single interaction or not (≥ 3 interactions) explaining the promiscuous nature of the target proteins (Fig. 3). The network statistics showed the total number of nodes (n = 37), edges (n = 109) and the expected number of edges (n = 28). The average node degree or average number of interactions exhibited by a protein was 5.89, with average local clustering coefficient of 0.658. The PPI enrichment p-value (< 1.0− 16) was significant, the network showed significantly more interactions than it was expected. The interaction enrichment means that these proteins have more interactions among themselves than what would be expected for a random set of proteins of the same size and degree distribution drawn from the genome. Such an enrichment indicates that the proteins are at least partially biologically connected, as a group.
Fig. 3
Protein-protein interaction using STRING database. The different nodes in the network represent the proteins while the network edges represent specific and meaningful protein-protein associations. The network is a scalable vector graphic [SVG]; interactive. The different node colors show the different level of interactions whereas the edge colors show their known, predicted and other interactions. The colored nodes show the query proteins and first shell of interactors, the white nodes represent second shell of interactors, empty nodes represent proteins of unknown 3D structure and filled nodes represent some 3D structure is known or predicted. The edges indicate both functional and physical protein associations whereas line color indicates the type of interaction evidence and the line thickness indicates the strength of data support. Among the known Interactions, Cyan are from curated databases and Purple are experimentally determined. In Predicted Interactions, green is from gene neighborhood analyses, red are gene fusions events, and blue are from gene co-occurrence. The other remaining interactions are; Olive = text-mining, black = co-expression, Navy Blue = protein homology
Sub-cellular localization and virulence predictionA vector-based machine method and suffix tree algorithm feature, Cello2GO software investigated the subcellular location of target proteins of S. typhi for exo-proteome and secretome, a source of vaccine candidates due to their continuous contact with biotic and abiotic elements of the extracellular environment. It was found that all putative targets belonged to the cytoplasmic region of the pathogen cell (Fig. 4). The Virulence Factor Database (VFDB) checked the targets for virulent proteins that are involved in disease intensity, a property associated with microbial pathogenesis. This step is important because antigenic/virulent proteins could serve worthy vaccine candidates since they intervene in serious flagging pathways in the host cells and might potentially activates the host immune system in contrast to non-virulent proteins. The VFDB predicted two targets as virulent proteins (STY0490_clpP_ATP-dependent protease proteolytic subunit_WP_000122257) and (STY2284_hisH_Imidazole glycerol phosphate synthase_WP_001103591) by producing significant alignments with the VFDB core dataset proteins associated with experimentally verified 4188 sequences (virulence factors VFs). Albeit being cytoplasmic in nature, they might have an indirect role in cellular signaling or a metabolic pathway to propagate virulence and disease outcome.
Fig. 4
Subcellular localization of final 4 targets using CELLO2GO software. The identified putative targets were found in the cytoplasm of the S. typhi
Virtual screening, molecular docking and ADMET profilingAfter performing virtual screening, the top 200 hits were selected from the ZINC library of 12,000 molecules for each target protein (top drug-like molecules based on minimum ligand-receptor complex energy, RMSD scores and maximum number of Hydrogen bonds (H-bonding). These were then docked in the final set of our target proteins using the MOE software (15 poses selected for each ligand in the highly druggable protein cavity) and then visually inspected. In MOE, docking and visualization were performed according to a slightly modified protocol by Basharat et al., 2021; placement = triangle matcher, rescoring 1 = London dG, refinement = forcefield, rescoring 2 = affinity dG. All docked ZINC compounds were arranged in ascending order according to their binding energies and those with least energy of ligand-receptor complex were considered as top conformation. Compounds that were able to pass Lipinski’s drug-like test and had minimum energy were selected as suitable inhibitors. Later, the top 10 best drug-like molecules were selected that showed favorable interactions, favorable docking orientation and minimum energy scores for each target protein. ZINC codes and MolDock scores of selected ligands, the number of hydrogen bonds as well as protein residues involved in these interactions are tabulated (Tables 3, 4, 5 and 6). For convenience, the figures (Figs. 5, 6, 7 and 8) represent docking results of the top two ligands only while for MD simulation and energy calculation, only the 1st of the top two ligands was selected. In silico pharmacokinetics and pharmacology properties of selected compounds were studies for absorption distribution metabolism and excretion (ADME), to filter out the best possible drug candidate, with higher penetration and least side effects to the human and other possible hosts. Some of these compounds showed blood-brain barrier permeability or mutagenicity while most of them were substrates for P-glycoprotein. Majority of them also did not show maximum inhibition of cytochromes. Some compounds were predicted positive for mutagenicity, albeit, majority were not, in the predicted AMES toxicity test, it is presumed that they do not cause mutations in the host DNA replication or translation processes. Nearly all compounds exhibited the least acute oral toxicity for humans. Since only 2 compounds were characterized for each target protein from the top 10 hits, it is presumed that toxic compounds perilous to humans or other hosts, if any, could be replaced with the remaining 8 inhibitors from the list for ADMET profiling. Log P (o/w) is the lipophilicity of a molecule that is expressed as a partition coefficient (Log P) of an n-octanol/water system, where more lipophilic compounds are partitioned in the n-octanol layer. For a drug molecule to reach its target, it will be required to pass through lipid cell membranes, the drug requires to be sufficiently soluble in a lipid medium. For drug molecules that require oral administration, thay cannot be overly lipophilic since this will lead to poor absorption and hence will deviate the Lipinski’s ‘rule of five’ that predicts likely poor absorption or permeability when the Log P value is greater than five [57, 58]. The Log Kp values, on the other hand, is another physicochemical property that show the skin permeability coefficient (Kp) of a compound through mammalian epidermis and thus provide an insight into the mechanism of molecular transport through the stratum corneum (SC) [59]. The drug-like compounds mined in this study as potential inhibitor candidates were found to be active, safe and have not previously been studies as anti-Salmonella to date. These novel candidates might be interesting to be explored as Salmonella inhibitors, owing to future laboratory tests. The biological importance of each target and an analysis of the predicted protein-ligand interaction are described below (Table 7).
Table 3 STY0490_ATP-dependent CLP protease proteolytic subunit: Top - 10 ZINC compounds from a library of 12,000 drug-like compounds with minimum energy scores / maximum H-bondTable 4 STY2284_Imidazole glycerol phosphate synthase: Top −10 ZINC compounds from a library of 12,000 drug-like compounds with minimum energy scores / maximum H-bondTable 5 STY3473_Dihydropteroate synthase: Top - 10 ZINC compounds from a library of 12,000 drug-like compounds with minimum energy scores / maximum H-bondTable 6 STY4091_2,3- bisphosphoglycerate-independent phosphoglycerate mutase: Top - 10 ZINC compounds from a library of 12,000 drug-like compounds with minimum energy scores / maximum H-bondFig. 5
Diagram showing In Silico interactions of 2 best ZINC compounds (ZINC19340748 and ZINC08738207) with the identified putative target STY0490_ATP-dependent CLP protease proteolytic subunit. The 2D interactions (left panel) were determined via MOE software (v2016–17) while their respective 3D interactions (right panel - target protein in surface representation) were developed using PyMOL visualizing tool
Fig. 6
Diagram showing In Silico interactions of 2 best ZINC compounds (ZINC09319798 and ZINC71771245) with the identified putative target STY2284_hisH Imidazole glycerol phosphate synthase subunit HisH. The 2D interactions (left panel) were determined via MOE software (v2016–17) while their respective 3D interactions (right panel - target protein in surface representation) were developed using PyMOL visualizing tool
Fig. 7
Diagram showing In Silico interactions of 2 best ZINC compounds (ZINC00494142 and ZINC1614648) with the identified putative target STY3473 Dihydropteroate synthase. The 2D interactions (left panel) were determined via MOE software (v2016–17) while their respective 3D interactions (right panel - target protein in surface representation) were developed using PyMOL visualizing tool
Fig. 8
Diagram showing In Silico interactions of 2 best ZINC compounds (ZINC32918650 and ZINC20389823) with the identified putative target STY4091 2,3-bisphosphoglycerate-independent phosphoglycerate mutase. The 2D interactions (left panel) were determined via MOE software (v2016–17) while their respective 3D interactions (right panel - target protein in surface representation) were developed using PyMOL visualizing tool
Table 7 Pharmacokinetic parameters of the top-scoring ZINC compounds for predicted targets in S. typhi MD simulation and binding free energy calculations by MM/PBSAThe physicochemical and thermodynamic stabilities of the four predicted targets interacting with their corresponding inhibitors, the protein-ligand complexes, depends upon several properties like the free binding energy, the number of interactions, the root mean square deviation (RMSD), the root mean square fluctuation (RMSF) and the radius of gyration (Rg). Table 8 demonstrates the free binding energies (ΔG) for each of the four complexes. All the energies have negative values which indicates a favorable protein-ligand complex formation.
Table 8 Free binding energy calculations of stable complexes during the last 25 ns (250 frames) of the molecular dynamic simulation (order of the increased values of the free binding energy)Using the PLIP software, the number of hydrogen bonds (H-bond), hydrophobic contacts, salt-bridge, π-π stacking and π-cation interactions through the simulation were determined for each complex. The figures below show the calculated contacts for all the residues (only residues with more than ten (10) interactions were taken into account). The results show that the three complexes with lower free binding energy also have the greater number of interactions (greater than 500) and that the main interaction mechanisms are due to hydrophobic and H-bond contacts. The complexes with lowest number of contacts (05 and 06) show a diversity of contacts were salt-bridge, π-π stacking and π-cation also contribute to their stability (Fig. 9).
Fig. 9
Free binding energy calculations: Interactions calculated for., A) STY0490_ ZINC19340748., B) STY4091_ ZINC32918650., C) STY2284_ ZINC09319798., D) STY3473_ ZINC00494142
The RMSD calculated for all the complexes is shown in the Fig. 10. As can be seen, all the complexes show stability. Complexes (A and C) have some oscillations at the first half of the simulation but then attain stability after 100–125 ns whereas the other complexes (B and 06) attain stability around the first 50 ns.
Fig. 10
RMSD curves: The curves were calculated for., A) STY0490_ ZINC19340748., B) STY4091_ ZINC32918650., C) STY2284_ ZINC09319798 and D) STY3473_ZINC00494142
The RMSF is a measure of the residue fluctuations. Looking for the residues that made the greater number of interactions from Fig. 11, their RMSF values are lower than 4 Å. Complexes B and D, that have the greatest variety of interactions, show the lower RMSF values.
Fig. 11
RMSF curves: The curves were calculated for., A) STY0490_ ZINC19340748., B) STY4091_ ZINC32918650., C) STY2284_ ZINC09319798 and D) STY3473_ZINC00494142
The radius of gyration (Rg) can verify how compact or not the protein becomes in the complex as it measures the hydrodynamic capacity of the protein. From Fig. 12, it is observed that in all cases, the radii of gyration show a stable value with oscillations inside the 1.5 Å window.
Fig. 12
Rg curves: The curves were calculated for., A) STY0490_ ZINC19340748., B) STY4091_ ZINC32918650., C) STY2284_ ZINC09319798 and D) STY3473_ZINC00494142
STY 0490_clpP (EC 3.4.21.92) ATP-dependent CLP protease proteolytic subunit is a caseinolytic serine protease that cleaves peptides in various proteins that require ATP hydrolysis. ClpP has a chymotrypsin-like activity by playing a major role in the degradation of misfolded proteins. The catalytic activity comprises the hydrolysis of proteins to small peptides in the presence of ATP and Magnesium where alpha-casein is the usual test substrate, the absence of ATP causes hydrolysis of only oligopeptides shorter than five residues. It has been proved that alteration of the ClpP function is closely related to the altered virulence and infectivity of a number of pathogens thereby rendering ClpP as an attractive and potentially viable target for antivirulence drugs and antibiotics to tackle the pathogen by the activation or inhibition of ClpP [60,61,62]. The physiological role of the ClpP proteolytic subunit and their ability to degrade misfolded proteins generated under different stress conditions in S. typhimurium and other bacteria has also been reported by constructing an in-frame deletion of the clpP gene [63, 64]. The VS and docking showed 2 best hits including ZINC19340748 and ZINC08738207 that interact with the residues His152, Gly140 and Gly140, respectively in the predicted druggable pocket with the least possible ligand-receptor energy values (− 5.8724 and − 5.7044, respectively) whereas other best hits are also tabulated (Table 3 and Fig. 5).
STY2284_hisH (4.3.2.10) Imidazole glycerol phosphate synthase subunit HisH (IGPS) (CHEBI:58525). This protein is involved in step 5 of the 9-step-subpathway of L-histidine biosynthesis pathway, an Amino-acid biosynthesis pathway and synthesizes/catalyzes the conversion of PRFAR (5-[(5-phospho-1-deoxy-D-ribulos-1-ylimino) methylamino]-1-(5-phospho-β-D-ribosyl) imidazole-4-carboxamide) and glutamine (L-glutamine) to IGP (D-erythro-1-(imidazol-4-yl) glycerol 3-phosphate), AICAR (5-amino-1-(5-phospho-β-D-ribosyl) imidazole-4-carboxamide) and glutamate. The HisH subunit catalyzes the hydrolysis of glutamine to glutamate and ammonia as part of the synthesis of IGP and AICAR. The resulting ammonia molecule is channeled to the active site of HisF (https://www.uniprot.org/uniprot/P0A1R5). The enzyme has been reported as a potential target for drug and herbicide development as the histidine pathway does not occur in mammals [65,66,67]. We showed that Arg181, Gly183 and Ala187, among others, of the predicted druggable cavity of IGPS protein interact favorably with most of the top 10 ZINC compounds, especially the top two hits i.e., ZINC09319798 and ZINC71771245, thereby supposedly aiding in the available list of drug molecules against this enzyme (Table 4 and Fig. 6).
STY3473_folP (EC 2.5.1.15) Dihydropteroate synthase. This enzyme protein catalyzes the condensation of para-aminobenzoate (pABA) with 6-hydroxymethyl-7,8-dihydropterin diphosphate (DHPt-PP) to form 7,8-dihydropteroate (H2Pte), the immediate precursor of folate derivatives possessing the Mg+ 2 ion. The condensation process is involved in the step-1 subpathway of the tetrahydrofolate biosynthesis pathway. The folP gene has long been reported among sulfonamide class of drugs resistance genes and has been well studied to get an insight into the evolution of drug resistance mechanisms [68, 69]. Our docking results showed that ZINC00494142 and ZINC1614648 showed good interactions with dihydropteroate synthase with Lys221, Asp185 and Arg255, among others, with minimum energy scores (Table 5 and Fig. 7).
STY4091_gpmI (5.4.2.12) 2,3-bisphosphoglycerate-independent phosphoglycerate mutase is an important cytoplasmic enzyme involved in the sub-pathway step 3 of a 5-step glycolysis pathway to catalyze the interconversion of 2-and 3-phosphoglycerate, where Mn+ 2 serve as a cofactor bound to the enzyme. The ph
留言 (0)