
記住我


Lipopolysaccharide (LPS) from E. coli 055: B5, LC–MS and HPLC-grade solvents and fine chemicals were procured from Sigma-Aldrich, USA. SYBR green mix cDNA synthesis kits were purchased from Takara Bioscience, India. ELISA kits (IL-6, CCL2, INF-γ and IL-1β) were obtained from R&D Systems. Primary antibodies were purchased from Cell Signaling Technology, USA, and the corresponding catalogue numbers are mentioned in supplementary table S2. Bicinchoninic acid reagent (BCA kit) was bought from Thermo Scientific, USA. Polyvinylidene difluoride (PVDF) membrane (0.45 μm) was procured from Millipore, USA. Secondary antibodies were procured from Jackson Laboratory, USA, and an ECL kit was purchased from Advansta, Menlo Park, CA, USA. Deionized water (18 MΩ) was used for the preparation of all solutions. Leaves of G. Sylvestre were collected from Chittoor district, Andhra Pradesh, India. The plant specimen was authenticated by a botany professor from Osmania University, Hyderabad, India. LC–MS CHROMASOLVs-grade and HPLC-grade methanol (MeOH) and acetonitrile (ACN) were procured from Sigma-Aldrich (St Louis, USA). Analytical reagent (AR)-grade ammonium acetate, ammonium formate, formic acid, hydrochloric acid (HCl).
Cell lines and culture conditionsRAW-264.7 cell line (murine macrophages) was procured from ATCC and cultured in DMEM (Dulbecco’s modified Eagle’s) medium with 1.5 g/l sodium bicarbonate, 4 mM l-glutamine, 4.5 g/l glucose, and 10% FBS (fetal bovine serum). The human bronchial epithelial cell line (BEAS-2B cell line) was purchased from Lonza, USA, and cultured using BEGM media with growth factors. Both the cell lines were cultured in a 5% CO2 incubator with a humidified atmosphere of 95% air at 37 °C. All cell lines were used in between four and five passages.
Preparation of hydroalcoholic extract of Gymnema Sylvestre (HAEGS)The shade-dried leaves of Gymnema Sylvestre were powdered and a hydroalcoholic maceration method was employed for extracting the hydroalcoholic GS extract. The coarse powder (639 g) of Gymnema Sylvestre was added into the mixture of 5.62 L of ethanol and 1.87 L of water (in a 3:1 ratio) in a beaker with constant stirring using magnetic stirrers for a period of 48 h at 25 °C. The extracted solution was filtered through a muslin cloth and evaporated to dryness using a rotary evaporator at a temperature below 55 °C under a vacuum. The dried powder of HAEGS was stored at 4 °C in coloured glass bottles until further use.
Fractionation of HAEGSPart of the crude extract (HAEGS) were dissolved in acetone:chloroform solvent mixture and loaded onto a silica column (Fig. S8A). For separating various compounds, a mixture of acetone:hexane (shown in Scheme 1), a mixture of methanol:chloroform in various ratios, and lastly methanol solvents were used. By increasing the polarity, 30 fractions were collected in total, and the fractions with similar thin layer chromatography (TLC) patterns (Fig. S8B) were mixed to afford six major fractions (F1–F6). Fraction 31 (labelled as F7) obtained with methanol elution did not provide any detectable organic molecules and hence it was discarded.
Scheme 1
Schematic representation of the preparation and fractionation of hydroalcoholic extract of Gymnema Sylvestre
Phytochemical profiling of HAEGS extractSample preparationThe samples were dissolved in methanol, centrifuged and filtered using a 0.22 µm membrane filter and the final concentrations of the crude samples were injected (1 µL) into the UHPLC/Thermo Orbitrap Exactive mass spectrometer (Thermo Scientific, Bremen, Germany) system.
Development and optimization of the chromatographic conditionsAnalytical separations of HAEGS were achieved on a Surveyor UHPLC system (Thermo Scientific, Germany) consisting of a quaternary gradient pump, an auto-injector and an in-line degasser. The column compartment was maintained at a temperature of 25 °C. The chromatographic separation method was developed in reverse phase mode with Syncronis C18 column (2.1 × 100 mm; Thermo Scientific, Germany) (Dadinaboyina et al. 2021). Varying the selectivity determination factors such as pH of mobile phase, ratios of polarity change and flow rate optimized the method. Finally, acceptable separation was achieved using 0.1% formic acid in water (A) and acetonitrile (ACN) (B) with a flow rate of 0.15 mL min−1 in gradient elution mode. The following linear gradient elution was used: (time in min/%B): 0–1/5, 1–12/95, 12–16/95, 16–21/5, and 21–26/5. The column was equilibrated with 20 column volumes of mobile phase at the composition before sample injection and the injection volume was 1 μl.
Mass spectrometryMass spectral analysis was carried out on Thermo Orbitrap Exactive mass spectrometer (Thermo Scientific, Bremen, Germany). The eluent from the UHPLC system was directed in the mass spectrometer via heated electrospray ionization (HESI) interface and operated in the positive and negative ion modes. The mass spectrometer was calibrated before analysis using the manufacturer's calibration solution (ProteoMass LTQ/FN-Hybrid ESI Pos. Mode Cal Mix, SUPELCO) to obtain the mass range in external calibration mode. Parameters of the ion source were as follows: positive ion spray voltage 3.50 kV, negative ion spray voltage 2.50 kV, heater temperature 275 °C, capillary temperature 320 °C, capillary voltage 67.50 V, tube lens voltage 140 V, skimmer voltage 20 V, sheath gas flow 30 (arbitrary units), auxiliary gas flow 15 (arbitrary units) and sweep gas 0 (arbitrary units). Nitrogen was used as the sheath and auxiliary gas in the ion source. The instrument was operated in full scan and automatic MS/MS experiments over the range of 100–2000 m/z at a resolving power of 100,000 (full width at half maximum) using nitrogen as collision gas.
GC–MS analysisThe GC analysis was performed using Agilent 6890 GC equipped with Agilent Technologies 5977A mass selective detector (MSD). The separation of analytes was carried out on a capillary column (Agilent) HP-5 5% Phenyl Methyl Siloxane (30m × 250 µm × 0.5 µm). The injection port temperature was maintained at 240 °C and the oven was programmed from 50 to 280 °C at a ramp rate of 10 °C/min with the initial hold-up temperature time as 2 min and the final hold-up temperature time as 5 min. Helium was used as a carrier gas at a flow rate of 1.2 mL/min. The desorption of analytes and injection into the column was carried out in splitless mode to avoid the loss of low abundant volatiles. GC–MS interface, ion source and quadrupole temperatures were maintained at 280 °C, 230 °C, and 150 °C respectively. The ionization of volatiles was carried out in an electron ionization source at 70 eV electron energy, and the scan range was fixed at 30–800 units. The volatile organic compounds were identified by using the W9N11.L, NIST14 library database. Mass spectral data were processed using MSD Chem Station.
In-vitro assaysTreatment conditions for in vitro experimentsMacrophage (RAW-264.7) cells were seeded in 24-well plates (0.5 × 10⁵/well) for estimating the IL-6 levels using ELISA. For all other cell culture experiments, RAW-264.7 or BEAS-2B cells were seeded in six-well plates (3 × 10⁵/well) and incubated for 18 h, then cells were washed with phosphate buffer saline (1xPBS) and cultured with serum-free media for another 6 h. Further, cells were pre-treated with HAEGS (125, 250 and 500 µg/mL), different fractions of indomethacin (50 and 100 µM) or dexamethasone (100 and 500 ng/mL) for 2 h, then activated with LPS (1 µg/mL for RAW-264.7 and 5 µg/mL for BEAS-2B cells) and incubated for 12 h. Then, cell supernatant was collected for nitric oxide estimation and ELISA, while cells were harvested for gene expression and Western blot analysis.
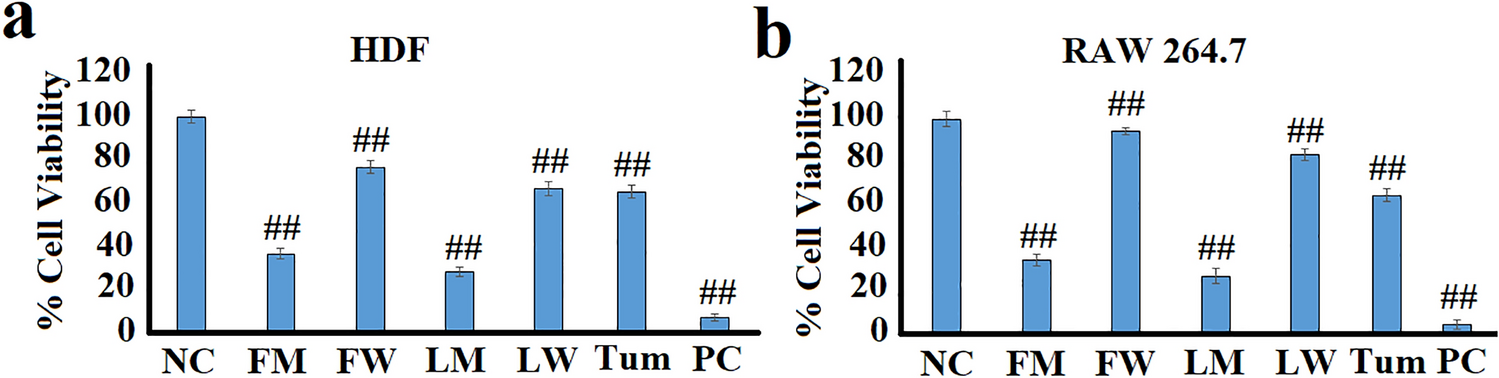
Cell viability by SRB assaySulforhodamine-B (SRB) assay was performed for assessing the cell viability as published previously (Tirunavalli et al. 2021a). Briefly, 5 × 10³ cells/well were seeded in a 96-well plate and then treated with sterile water (vehicle control) or HAEGS at various concentrations (125, 250 and 500 µg/mL) in the presence or absence of LPS. After 48 h, an SRB assay was performed. IC50 values were calculated using the curve-fit method by GraphPad Prism-5.
Gene expression analysisAfter the treatment period, treated cells or rat lung tissues were subjected to RNA isolation using RNAiso plus as described earlier (Andugulapati et al. 2020). Briefly, RNA was isolated using the TRIzol–chloroform method and total RNA was quantified using nano-drop. Isolated RNA (1 μg) was subjected to cDNA synthesis using a prime script cDNA synthesis kit as per the manufacturer’s instructions. Specified primers [IL-6, IL-1β, TNF-α, IL-8, CCL2, CCL3, CCL7, CXCL1, alveolar pulmonary stretch (amphiregulin), CC16, vascular cell adhesion molecule-1 (VCAM-1), intercellular adhesion molecule (ICAM-1), and reference markers (GAPDH, β2M, and β-actin)] were designed using Primer-3 software and the respective sequences are shown in Table S1. RT-qPCR was carried out using SYBR green mix and the differences in mRNA expression of the specified genes were calculated as the fold change using the formula 2-ΔΔct and data were expressed as mean ± SEM.
ROS measurement using the DCFDA assayROS estimation was performed using DCFDA staining as described earlier (Tirunavalli et al. 2021b). Briefly, after pre-treating the cells with specified concentrations of HAEGS for 2 h, cells were activated with LPS for another 12 h. Then DCFDA assay was performed using BD-Accuri® C6 flow cytometer for mean fluorescence intensity of DFCDA.
Immunoblotting analysisCells or rat lung tissues that were treated by HAEGS followed by LPS stimulation were subjected to Western blot analysis as described earlier (Andugulapati et al. 2020). Briefly, cells or tissue samples were lysed using RIPA lysis buffer and then protein concentrations were estimated using a BCA kit. Then, 30 μg of protein per sample was loaded onto the SDS-PAGE Bis–Tris 8–12% protein gel for electrophoresis and then transferred onto PVDF membranes. Further, the PVDF membrane was blocked with 5% BSA (Sigma Aldrich, USA) for 1 h at room temperature, followed by incubation with primary antibodies overnight at 4 °C. Then the respective secondary antibodies were added and then blots were developed using an ECL kit.
In vivo experimentsInduction of ARDS using intratracheal instillation of LPSAdult SD (male) rats weighing 210–240 g, (n = 32) were used for developing the LPS-induced ARDS. As per the Committee for the Purpose of Control and Supervision on Experiments on Animals (CPCSEA) regulations, all the animals were acclimatized at a specified temperature (24–26 °C) with the maintenance of 12 h dark and 12 h light cycles. The experimental protocol was approved by Institutional Animal Ethics Committee (IAEC) (IICT/023/2020), CSIR-Indian Institute of Chemical Technology 6). Male SD rats were randomly assigned to four groups (n = 8/group). Before LPS administration, rats were pre-treated with HAEGS 125 mg/kg and 250 mg/kg in group 3 and group 4 of the animals, respectively. LPS was dissolved in PBS to attain a concentration of 5 mg/mL. All animals were anaesthetized with ketamine (80 mg/kg) and xylazine (10 mg/kg). After 12 h of the pre-treatment, rats were challenged with LPS (5 mg/kg) intratracheally, in treatment groups (groups 3 and 4) and the LPS control group (group 2). Group 1 of rats were used as a sham control, where PBS was instilled into the rat’s trachea, while the remaining three groups were used to establish the ARDS model. After 12 h of LPS administration, rats were again dosed with HAEGS and monitored for a further 12 h. After 24 h of the LPS stimulation, Bronchoalveolar lavage Fluid (BALF) samples were collected from 50% of the animals from each group and one part of the BALF samples were subjected to neutrophil count and, remaining BALF sample was centrifuged and stored at − 80° in a freezer for ELISA. All animals were killed and the left lungs were isolated and collected in buffered formalin and subjected to histopathological examination, while the two lobes of the right lungs were collected for wet-to-dry (W/D) analysis and the remaining two lobes were collected for Western blotting, reverse transcription-quantitative PCR (RT-qPCR), ELISA and nitric oxide examinations.
Lung wet–dry weight (W/D) ratioAfter killing the animals, one of the right lung tissues was isolated and rinsed with 1XPBS, then the surface liquid of the lobe was removed by draining with clean filter paper, and the wet weight was recorded. Then these lung tissues were incubated in a thermostatic oven at a constant 80 °C for 48 h, followed by measuring the dry weight. The W/D ratio was estimated to measure the moisture content in the lung tissues.
BALF analysisAnimals were anaesthetized with pentobarbital 50 mg/kg and then BALF was collected after exposing the trachea. Then the trachea was cannulated, and a volume of 3 ml sterile saline was slowly infused into the lungs and 2 mL of BALF collected. BALF cell pellet was collected by centrifuging the BALF at 1800 rpm at 4 °C for 12 min, and the cell pellet was re-suspended in 500 μL of sterile saline to quantify inflammatory cell counts using a cell counter.
Estimation of IL-6 CCL2 and IL-1β using ELISAIL-6, CCL-2 and IL-1β protein levels were measured in cell culture supernatants, BALF and lung tissue homogenates using ELISA kits (R&D Biosystems, Minneapolis, MN, USA) as per the manufacturer’s instructions.
Nitric oxide estimationNitric oxide estimation was performed as described in our earlier publication (Tirunavalli et al. 2021a). Briefly, cell supernatant (cell culture or tissue homogenates) was collected and used to estimate the NO levels. Griess reagent was used to evaluate the NO levels of the samples by mixing both supernatants of the lung tissue samples and Griess reagent (1:1 ratio). The reaction mix was incubated at 37 °C for 10 min in dark conditions, and absorbance was measured at 548 nm.
Histopathology and immunohistochemistryHistopathology and immunohistochemistry were performed as described earlier (Tirunavalli et al. 2021a). Briefly, a part of the pulmonary lobe was isolated, rinsed with ice-cold PBS, and fixed with 10% neutral-buffered formalin. Paraffin blocks were prepared and sectioned (4 μm), followed by staining with haematoxylin and eosin (H&E) and periodic acid–Schiff (PAS) staining. A few sections were taken on positively charged (Thermo Fisher, USA) slides for immunohistochemistry analysis. The pathological changes in the lungs and alveolitis in lung tissues were scored and semi-quantitatively assessed by a pathologist using H&E staining. The scoring system of pathological changes was: 0, no pathologic changes; 1, patchy changes; 2, local changes; 3, scattered changes; 4, severe changes (in most parts of the lung) (Alavinezhad et al. 2017). Immunohistochemistry was performed as described in the previous protocol (Tirunavalli et al. 2021a). Briefly, tissue sections were incubated with primary antibodies for 16 h. Sections were washed and stained with secondary antibodies. The protein expression was detected using SignalStain® DAB Chromogen Kit. Neutrophil elastase, MPO, NRF2 and HO-1protein (Immunohistochemistry) relative expressions were quantified using Image J software and plotted as graphs for a better representation of the results.
Statistical analysisAll experimental results were expressed as mean ± standard error of the mean (SEM) and analysed with the GraphPad Prism 5.0 software. All data were analysed by one-way or two-way ANOVA with multiple comparisons, where appropriate. In all cases, P < 0.05 was considered statistically significant.
留言 (0)