Objective
The objective of the systematic review is to gather encompassing information on the outcomes linked to the implementation of minimum volume standards in hospitals. Those outcomes can be related to the patient-level (e.g., mortality, morbidity, quality of life, functional measures, postoperative complications, travel times, distance to hospitals), the process-level (e.g., quality indicators), or the health system level in general (e.g., costs).
Eligibility criteriaPopulation
We will include studies dealing with patients irrespective of their condition or the intervention received. All procedures performed within hospitals will be eligible for inclusion. Although it can be expected that the majority of procedures will be surgical, there will be no restriction to surgical procedures only. Other procedures such as care for acute myocardial infarction, pneumonia, or low-birth-weight neonates, for example, will also be included.
Intervention
The intervention is minimum volume standard, defined as a minimum of specific healthcare procedures in a given timeframe and area. In broad terms, we will include any change in how, when, and where healthcare is organized and delivered and who delivers healthcare if this involves the implementation of minimum volume standards. Minimum volume standards must be regarded within the context of a healthcare system. They can be expected to be different across states or regions. Thus, there will be no restrictions with respect to the regulatory approach (e.g., state authority, regional authority, and professional association), the year of implementation, selected standards or cutoff points, and consequences in case of noncompliance (e.g., non-reimbursement for the performed procedure).
Comparator
The comparator is no minimum volume standard.
Outcomes
We will consider a broad range of outcomes. The outcomes will be split into two groups (direct and indirect outcomes). For direct outcomes, we will largely follow the categorization scheme developed by the Cochrane EPOC group. As the included studies will cover a broad range of procedures, not all outcomes will be relevant for all procedures. In particular, patient outcomes will be amended depending on the procedure under study.
Patient outcomes: (hospital) Mortality, survival, morbidity, health-related quality of life, functional measures, reoperations, wound infections, bleeding, postoperative complications, readmissions, length of stay
Quality of care: Adherence to clinical practice guidelines or clinical pathways and quality assurance measures
Utilization, coverage, or access: Travel times and distance to hospital
Resource use: Costs
Healthcare provider outcomes: Transition frequencies (i.e., number of hospitals increasing their volume to meet minimum volume standards) and number of procedures (e.g., due to broader indications)
Adverse effects or harms: Any in one of the abovementioned categories
Any other outcomes not listed above will also be included.
Indirect outcomes will usually not be measured for a given procedure under study but at the health system level. As for any other health system intervention, the effects of minimum volume standards also need to be investigated at a structural level, as changes at the structural level can heavily affect any direct outcomes. These effects can be described as unintended. Nevertheless, this does not mean that they are less important. Some of these effects have already been described in the literature [21].
One such effect is procedure shifting (i.e., hospital focus on the delivery of new procedures). Hospitals not able to meet a minimum volume standard replace this procedure by focusing on the delivery of another procedure. Procedure shifting is acceptable unless broader indications are applied to the new procedure.
Minimum volume standards might also have an unintended effect on the delivery of emergency care. Hospitals not being able to deliver a procedure because of minimum volume standards might lack sufficient experience in case of emergency procedures. The German Medical Association has also pointed out that centralization might increase the shortage of young doctors in smaller hospitals due to an increased demand in high-volume hospitals [22].
Their report also concluded that overall, the effects at the health system level remain largely unstudied. There can be several such relevant effects at the same time, but no consensus on them has yet been reached.
All outcomes (direct and indirect) will be prioritized prior to conducting the review. Outcomes will be grouped into primary and secondary outcomes. This will be mentioned in amendments to the protocol.
Design of primary studies
We will include the following study designs:
(Cluster) randomized controlled trials ((C)RCTs) with at least two intervention and control sites
Non-randomized controlled trials (nRCTs) with at least two intervention and control sites
Controlled before-after (CBA) studies with at least two intervention and control sites
Interrupted time series (ITS) that have a clearly defined point in time when the intervention occurred and at least three data points before and three after the intervention.
RCTs (including cluster RCTs) are often not available to address questions about health system interventions and implementation strategies, such as minimum volume standards. As randomization in healthcare systems is very challenging, we do not expect any CRCT to meet our inclusion criteria. Therefore, we will include other study designs as suggested by the Cochrane Effective Practice and Organization of Care Group (EPOC). Following their guidelines, we will only include studies that have at least two sites (e.g., hospitals) included in each arm of the investigation. In a CBA, outcomes of interest are measured in both intervention and control groups before the intervention is introduced and after the intervention has been introduced. In an ITS, multiple data points are collected before and after the intervention, while the intervention effect should be measured against the pre-intervention trend. Therefore, ITSs should have at least three time points before and after the intervention. This study design does not require a control group. The study design will be determined using the Cochrane EPOC group algorithm.
Modelling studies (e.g., modelling the impact of centralizing procedures in a region to a smaller number of hospitals) will be excluded.
Information sources and search strategies
We will conduct a literature search to identify all published and unpublished studies. The search strategy will be developed by the research team in collaboration with an experienced librarian and checked by a referee according to the Peer Review of Electronic Search Strategies (PRESS) guideline [23]. We will apply no restrictions regarding language, publication data, and publication status. A draft of the Embase search strategy is presented below:
((centralization:ti,ab OR centralisation:ti,ab OR centralized:ti,ab OR centralised:ti,ab OR regionalization:ti,ab OR regionalisation:ti,ab OR regionalized:ti,ab OR regionalised:ti,ab OR hospital volume*:ti,ab OR minimum volume*:ti,ab OR high case numbers:ti,ab OR minimum numbers:ti,ab OR minimum quantities:ti,ab OR minimal provider volume:ti,ab OR minimum provider volumes:ti,ab OR procedure volume*:ti,ab OR minimum hospital volume:ti,ab OR minimal hospital volume:ti,ab OR minimum volume standard*:ti,ab OR minimal amounts:ti,ab OR minimum amounts:ti,ab OR minimum patient volume:ti,ab OR hospital procedure volume:ti,ab OR hospital procedural volume:ti,ab OR high hospital volume:ti,ab OR minimum requirements:ti,ab OR minimum workload:ti,ab OR minimum caseload*:ti,ab OR case load requirement*:ti,ab) AND (hospital*:ti,ab OR clinic*:ti,ab OR center*:ti,ab OR centre*:ti,ab)) OR high volume hospital*:ti,ab OR ‘high volume hospital’/exp
(law:ti,ab OR policy:ti,ab OR intervention*:ti,ab OR regulation*:ti,ab OR initiative*:ti,ab OR program*:ti,ab OR implementation*:ti,ab)
We will search the following databases to identify relevant studies: MEDLINE (via PubMed), Embase (via EMBASE), CENTRAL (via Cochrane Library), CINHAL (via EBSCO), EconLit (via EBSCO), PDQ evidence for informed health policymaking, Health Systems Evidence, and Open Grey. All databases will be searched without limitations to language, date, or land of origin. We will further search manually for additional studies by cross-checking the reference lists of all included primary studies as well as cross-checking the reference lists of relevant systematic reviews.
Furthermore, we will search the following trial registries: clinicaltrials.gov, German Clinical Study Register (DRKS), and International Clinical Trials Registry Platform (ICTRP).
We will also contact experts for additional studies and will conduct a hand search of available abstracts from conference reports.
Data management and study selection
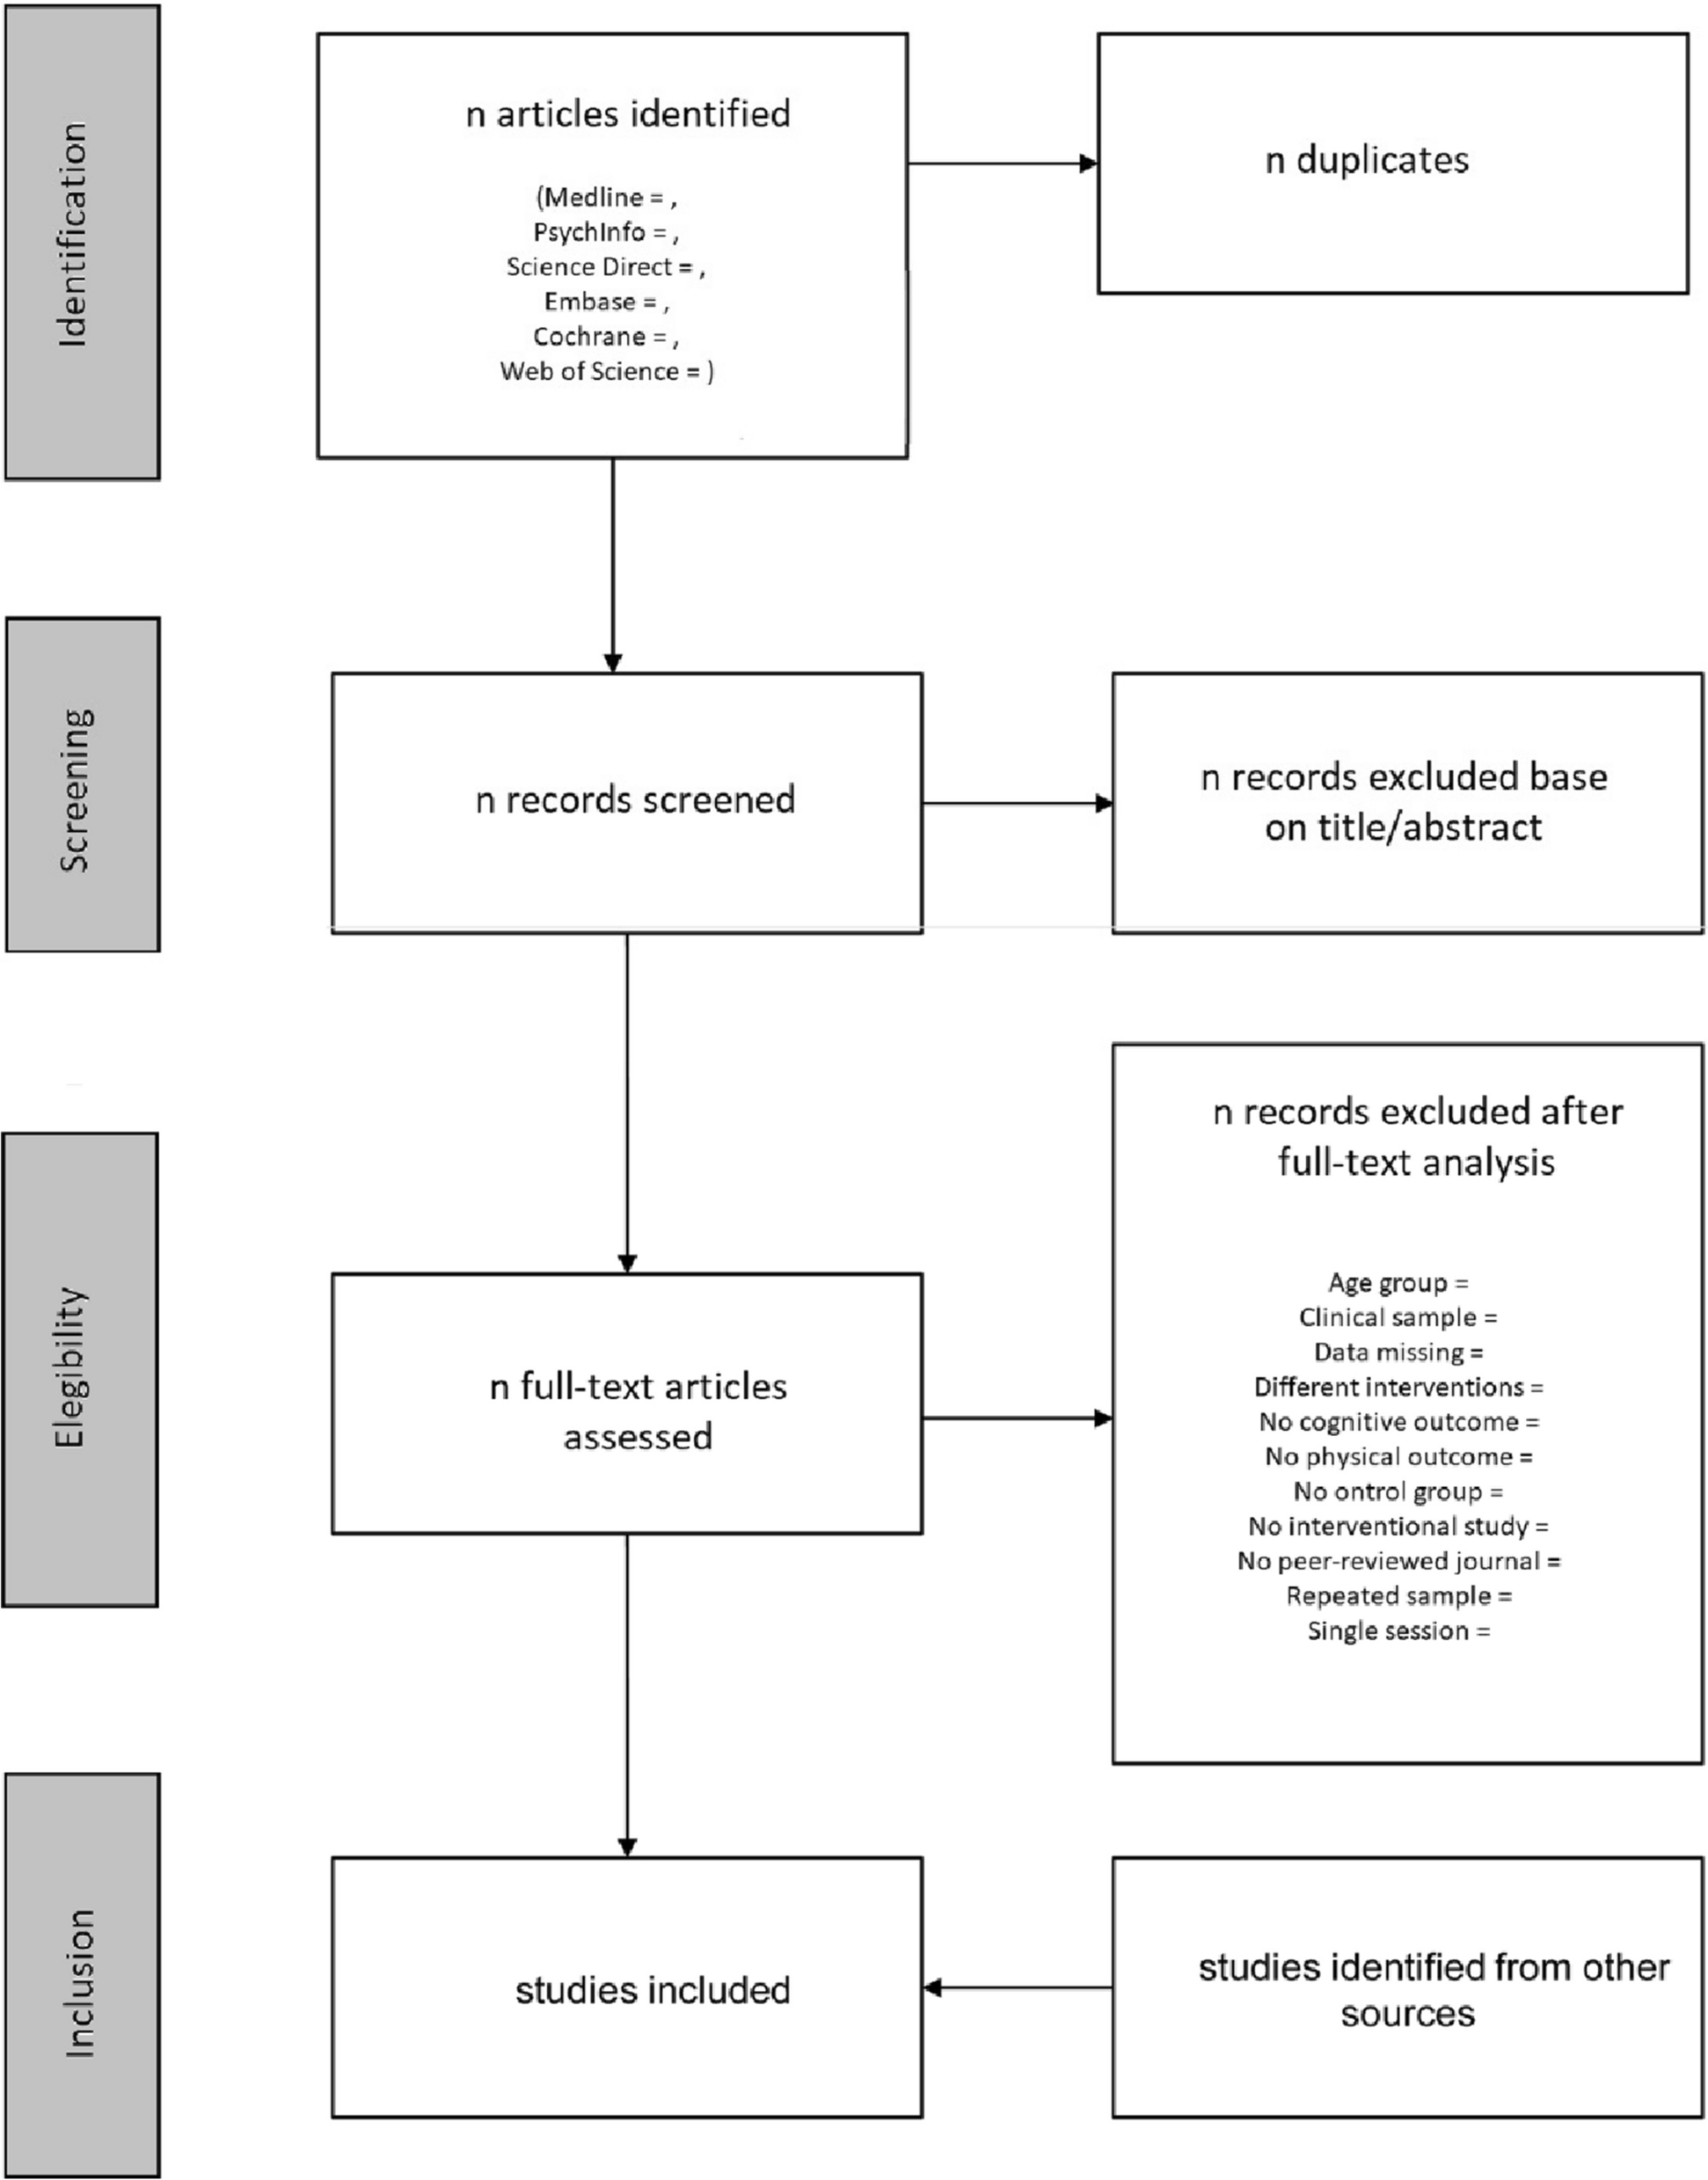
All potentially relevant hits will be imported to a reference management software (e.g., Rayyan). Duplicate publications will be removed. Two reviewers will independently screen titles and abstracts of all identified articles. We will retrieve the full texts of all potentially relevant articles. Full-text articles will be reviewed in detail regarding inclusion criteria by two reviewers independently. In case of disagreement, eligibility will be determined by discussion and consensus. In case of any uncertainty, we will contact the authors of the primary studies.
Based on preliminary searches, we expect to include 25 to 30 studies meeting our eligibility criteria.
A standardized data extraction tool will be developed in Excel and calibrated with the team. Using a random sample of five of the included studies, the data extraction form will be pilot-tested, and revised, as necessary. Data extraction will begin when high inter-rater reliability (Kappa statistic ≥ 0.60) has been achieved [24].
Data collection and quality assessment
Two review authors will independently perform data extraction of the included studies using the standardized and piloted data collection form. Then, both reviewers will check each other’s versions for completeness and accuracy. Any discrepancies will be resolved by discussion. If no agreement can be reached, arbitration will be carried out by the senior researcher. Primary study authors will be contacted in case of missing data or uncertainty (e.g., follow-up time points). We will extract data on the following items: sample size (number of included patients and hospitals); study design; patients/hospitals eligibility criteria; type of hospitals (e.g. teaching hospital); surgeon characteristics (if applicable); year(s) of data collection; country/region; data source (clinical vs. administrative); database/registry (if any); procedure or treatment; definition of minimum volume standard; outcomes; (unadjusted and adjusted) effect measures with corresponding confidence intervals and/or p-values; statistical models; and adjusting variables.
For quality assessment, we will use the ROBINS-I risk-of-bias tool, with additions for CBA and ITS study designs. The ROBINS-I tool is a tool to assess non-randomized studies of interventions and includes seven domains. The first two domains cover confounding and selection of participants, addressing issues before the start of the interventions. The third domain addresses classification of the interventions themselves. The other four domains cover issues after the start of interventions: biases due to deviations from intended interventions, missing data, measurement of outcomes, and selection of the reported result. Judgements are “low risk,” “moderate risk,” “serious risk,” and “critical risk” of bias [25].
To assess the risk of bias of [C]RCT and nRCT studies, we will use the RoB 2 risk-of-bias tool. RoB 2 is results based and structured into a fixed set of domains of bias. Those domains include trial design, conduct, and reporting. The proposed judgement about the risk of bias arising from each domain is algorithm generated. Judgement can be “low” or “high” risk of bias or can express “Some concerns” [26].
Two reviewers will independently assess the risk of bias and resolve any disagreements through discussion. In case of insolvable disagreement, a third reviewer will be involved.
Data synthesis
Our data synthesis strategy takes both methodological and clinical heterogeneity into account. From a methodological perspective, we will distinguish between different study designs and estimation approaches. From a clinical perspective, we will ensure medical homogeneity of studies considered for evidence synthesis.
For data synthesis and statistical analyses, we will follow the guidance published by the EPOC Cochrane group [27]: For dichotomous outcomes, we will use the risk ratio (RR) obtained from statistical analyses adjusting for baseline differences (such as Poisson regressions or logistic regressions) or the ratio of risk ratios (i.e., the RR post-intervention/RR pre-intervention), if possible. For continuous outcomes, we will use the absolute change obtained from a statistical analysis that has adjusted for baseline differences (e.g., regression models, mixed models, or hierarchical models). Alternatively, we will use the relative change adjusted for baseline differences in the outcome measures. This is the absolute post-intervention difference between the intervention and control groups minus the absolute pre-intervention difference between the intervention and control groups. For ITS studies, if possible, we will rely on the results either obtained by a regression including time trends before and after the intervention adjusting for autocorrelation and any periodic changes or auto-regressive integrated moving average (ARIMA) models. Results of interest refer to both, change in slope and change in level. Change in slope is the change in the trend from pre- to post intervention, while change in level refers to the immediate effect of the intervention. The immediate effect is calculated by the difference between the fitted value for the first post intervention data point minus the predicted value based on the pre-intervention slope only.
If papers with ITS design do not provide an appropriate analysis or reporting of results, but present the data points in a readable graph or in a table, we will reanalyze the data using a segmented time series regression model: Y(t) = B0 + B1*preslope T + B2*postslope (T – Ti)+ B3*intervention Xt + e(t) as suggested for Cochrane EPOC reviews, where Y(t) is the outcome in month t. Pre slope is a continuous variable indicating time from the start of the study up to the last point in the pre-intervention phase and coded constant thereafter. Post slope is coded 0 up to and including the first point post intervention and coded sequentially from 1 thereafter. Intervention is coded 0 for pre-intervention time points and 1 for post intervention time points. In this model, B1 estimates the slope of the pre-intervention data, B2 estimates the slope of the post intervention data, and B3 estimates the change in level of outcome as the difference between the estimated first point post intervention and the extrapolated first point post intervention if the pre-intervention line was continued into the post-intervention phase. The difference in slope is calculated by B2-B1. The error term e(t) is assumed to be first-order autoregressive. Confidence intervals (95%) will be calculated for all effect measures.
Analysis will be performed at the same level as the allocation to avoid unit-of-analyses errors. If such results will be reported in the included studies, and there is insufficient data to reanalyze the data, we will try to obtain data by contacting study authors. If these data will not be available, we will not report CIs and p-values for analyses containing unit-of-analyses errors.
If there are sufficient numbers of comparisons for similar outcomes and similar procedures across studies, we will use “box and whisker” plots to graphically display and explore heterogeneity of the results across studies. In addition, we will use I2 statistic to assess the extent of variability beyond chance for each of the groups of studies assessing similar comparisons, outcomes, and procedures.
For data synthesis, we will prepare a table for each category of interventions and procedures. Categories for interventions are hardly to be determined before. Therefore, we will judge on defining categories in view of the identified studies. Categories for procedures will consist of single procedures (e.g., total knee arthroplasty). However, if there is enough evidence from other studies suggesting the same effects across different procedures in a given field, we might decide to merge them into one category (e.g., all procedures in knee arthroplasty).
For all studies, we will record the number of events (in the case of health outcomes) and the total number in each group (for risk ratios) or mean and standard deviation (SD) in each group (for mean difference). All outcome effects will be shown with their associated 95% CIs.
We will only conduct a meta-analysis for studies that report similar comparisons (procedures, interventions, comparisons, and outcomes that are similar enough that an average effect across those studies would be meaningful).
Anticipating heterogeneity across studies, we will use a random-effects model for meta-analysis.
For CBAs and ITS, we will pool changes in intercept and slope.
In the case that no meta-analysis will be performed, a structured synthesis as suggested by EPOC will be conducted. We will describe the range of effects in the identified studies. Furthermore, we will describe the underlying mechanism through which the intervention affects specific outcomes, if feasible.
Subgroup analyses will be performed for different interventions, health systems (i.e., countries, regional health authorities), and procedures or corresponding categories.
We will perform sensitivity analyses for missing data by imputing a plausible range of assumptions. The potential implications of missing data will be discussed. We will also perform sensitivity analyses for different study types and differing risks of bias. Studies at a high risk of bias will be excluded from sensitivity analyses.
For data synthesis, we will use R in its current version.
Certainty assessment
Quality of the evidence will be evaluated using the Grades of Recommendation, Assessment, Development and Evaluation (GRADE) approach [28]. The GRADE approach uses five considerations (study limitations, consistency of effect, imprecision, indirectness, and publication bias) to assess the quality of the body of evidence for specific outcomes. Although GRADE has originally been developed for clinical questions, it can also be applied to public health or health system questions, albeit it is likely that this might be challenging. Currently, the GRADE working group is underway to identify challenges in applying the GRADE approach to public health and health system interventions to come up with potential solutions at a later stage. Evidence can be downgraded depending on assessments for risk of bias, indirectness of evidence, serious inconsistency, imprecision of effect estimates, or potential publication bias. The quality of the body of evidence will be assessed by two reviewers independently using the GRADEpro GDT software. Summary of finding tables will be prepared for summarizing confidence across studies.


留言 (0)