
記住我
The U.S. Food and Drug Administration considers functioning to be amongst the most essential clinical outcome assessments (which include patient-reported outcomes, clinician-reported outcomes, observer-reported outcomes, and performance outcomes) to track, regardless of condition [24], so we focus on adaptive functioning as the exemplar developmental concept. Adaptive functioning is an established part of neurodevelopmental assessment, and it appears in many longitudinal and treatment studies of genetic conditions. The most recent version of the widely used Vineland Adaptive Behavior Scales [25] is the first edition to contain person ability scores, which are called Growth Scale Values (GSV). The Vineland Comprehensive Interview Form is a semi-structured parent/caregiver interview designed to assess adaptive behavior across the lifespan. Items are arranged into 11 subdomains, each belonging to one of four domains (Communication, Socialization, Daily Living, and Motor).
Norm-referenced scoresAge-based norms are provided, based on samples constructed to reflect the USA population (per 2014 Census data) in each age range [25]. At the subdomain level, the norm-referenced scores are called V-scale scores and have a population mean of 15 and SD of 3, with a minimum score of 1. Because the Vineland is intended for use in neurodevelopmental disability, the range of norm-referenced scores is wider than for other tests (e.g., the floor of most IQ tests is no more than 4 SD below average). V-scale scores were derived through inferential norming of the raw scores.
Person-ability scoresGrowth Scale Values (GSVs) are also available at the subdomain level. The Vineland-3 was calibrated using the Andrich rating scale model [26]. The transformation from ability score to GSV used a coefficient of 9.1024 and a subdomain-specific constant (derived using joint maximum likelihood) to achieve a minimum GSV of 10 [26]; the maximum ranges from 110 to 197 depending on the subdomain. They are obtained via lookup table, corresponding to raw subdomain scores, which is publicly available (https://www.pearsonassessments.com/content/dam/school/global/clinical/us/assets/vineland-3/vineland-3-manual-appendices-b-e.pdf). Although the GSV range appears similar across subdomains, GSVs are a unitless measure and therefore cannot be compared or combined across subdomains. As of this writing, the standard errors of measurement (SEM) for GSV, which range from about 2 to about 9 depending on subdomain and age range, are not included in the manual but are available upon request from the publisher.
Simulation designWe used R version 4.0.2 [27] to simulate a series of randomized clinical trials, wherein cases were randomly assigned to placebo or active treatment and assessed at baseline and endpoint at 6 months. To create relevant studies, we conducted the simulations at two treatment effect sizes (defined below) and for all subdomains. To explore the hypothesis that the advantages of GSV will be more pronounced for samples with severe impairment than for those with more moderate impairments, we manipulated two sample-level factors: sample age range and sample impairment level. The final list of scenarios is provided in Additional file 1: Supplementary Table S1.
Sample-level factorsThe sample age range factor had two levels: 3–6 years and 12–16 years. While these ranges appear broad and cover a wide range of development, they were intentionally selected to illustrate age ranges commonly included in neurodevelopmental disability research.
Sample impairment on the GSV scale was conceptualized using the normative (V-scale) scores. The impairment factor had five levels, corresponding to 1, 2, 3, 4, and 5 standard deviations below the population mean on the V-scale (i.e., scores of 12, 9, 6, 3, and 1, respectively). First, the average of each level of the chronological age factor (5 years, 0 months and 14 years, 6 months for the young and old conditions, respectively) was used to select a V-scale lookup table (Vineland Scoring Manual Table B.1). From that table, the average raw score for each subdomain associated with V-scale scores of 12, 9, 6, 3, and 1 were returned. The GSV corresponding to this raw score was obtained from Vineland Scoring Manual Table B.2 and used as the mean of the generating distribution described below in step 1.
Study design factorsThe best practice in study planning is to power the trial based on the smallest effect size which would be clinically meaningful. Because there are currently no data available from which to determine a clinically meaningful effect on the GSV scale, we instead used an effect size-based approach to determine the sample size in the simulated study. Sixty-six participants are required to achieve 90% power for a moderately large standardized mean difference (Cohen’s d = 0.80) with 5% alpha. Given the inclusion of baseline score as a covariate, we reduced the sample size proportionally by 1–ρ2 ([28], p. 2924) where ρ was defined as 0.8 (see final paragraph of this section). Thus, the sample size used for simulation was 36% of 66, N = 24.
To mirror the sample size determination, the simulated treatment effect size was specified as a function of the SEM of the GSV, which was derived through methods described below. The SEM was converted to a standard deviation, and the effect size in GSV units was calculated as 0.8*SD, or a large standardized mean difference. A second condition, wherein the effect size was 0, was used to evaluate type I error.
Finally, to generate correlated data (two timepoints per person), it was necessary to specify a within-subject correlation parameter. The Vineland manual reports test-retest correlations for V-scale, but not GSV, over a period of 12–35 days. These range from 0.69 to 0.87 for the age ranges and subscales used here. Data available to the authors, from a GCAND natural history study, exhibit within-subject GSV correlations ranging from 0.86 to 0.96 between baseline and 6 months. Given this information, we selected a within-subject correlation of ρ = 0.8 for this simulation.
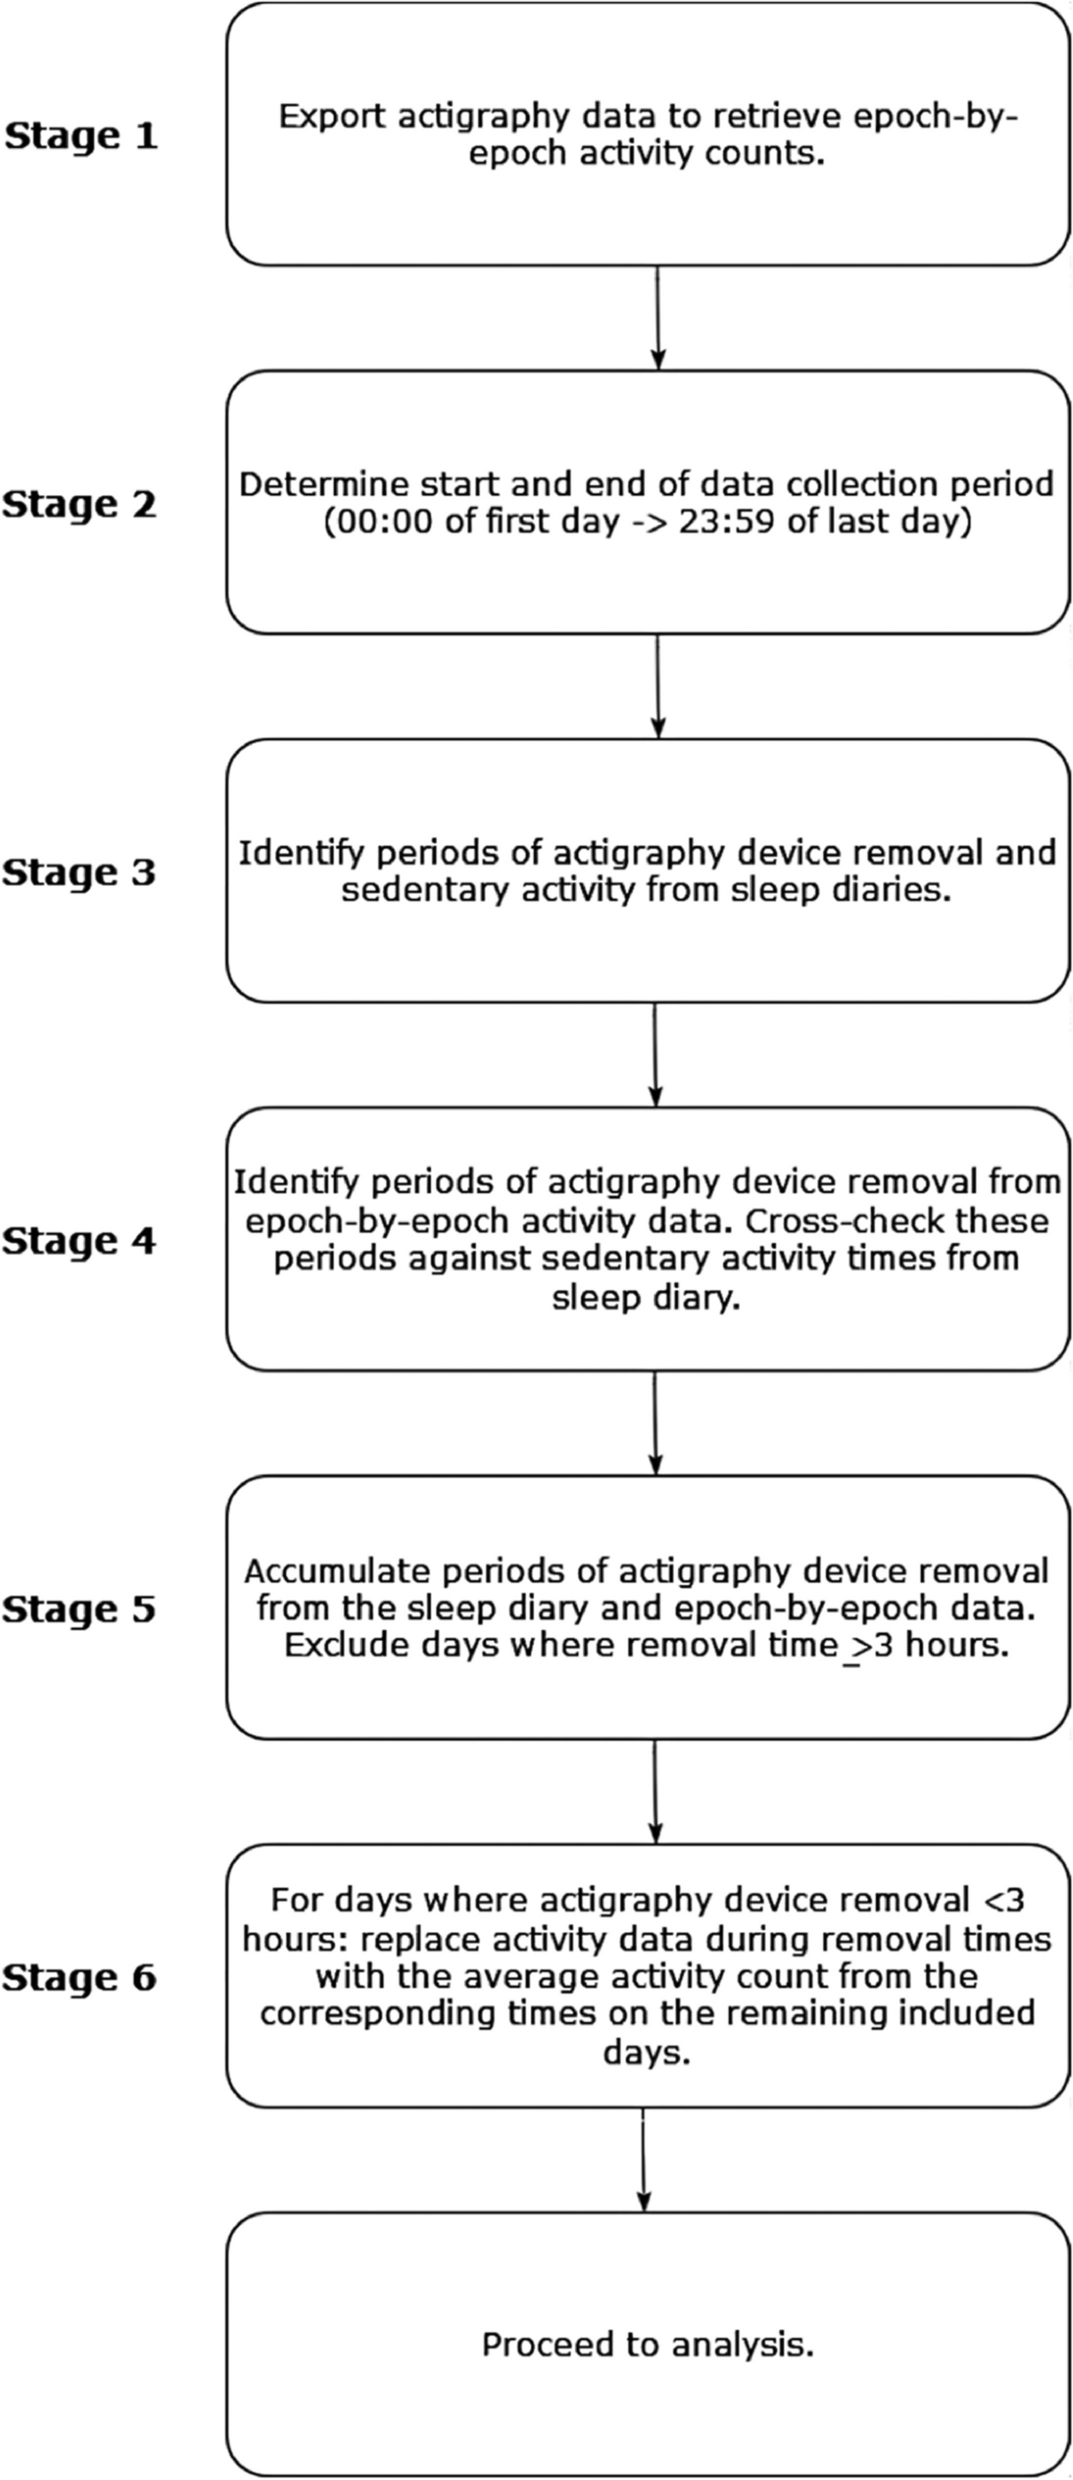
Dataset generationEach scenario was used as the basis for generating 5000 unique datasets (10,000 for the type I error condition). The process for a single dataset is described below and illustrated in Fig. 2.
Fig. 2
Simulation design. PBO = placebo; TRT = active treatment; ANCOVA = analysis of covariance; GSV = growth scale value (ability score); range = age range condition (3–6 years or 12–16 years); imp = impairment condition (average V-scale for sample of 1, 2, 3, 4, or 5 SD below average); es = effect size condition (zero or large standardized effect). Baseline and follow-up scores were drawn from a bivariate normal distribution, where the within-subject correlation was fixed at r = 0.8 and the mean and standard deviation were defined based on the age range and impairment conditions. For the PBO condition, the mean at baseline and follow-up were identical. For the TRT condition, the baseline mean was identical to PBO, but the follow-up mean was shifted by a factor depending on the effect size condition. Baseline age of the simulated participants was drawn from a uniform distribution, and V-scale scores were obtained using a lookup table with age and the simulated GSV score. Finally, the effect of group on follow-up score was calculated based on ANCOVA, controlling for baseline score. This process was repeated 5000 times (large effect size) or 10,000 times (zero effect size) for each combination of conditions
Step 1The placebo group GSV baseline and endpoint scores were drawn from a bivariate normal distribution. The mean of this distribution was determined using the impairment factor described above. The standard deviation of the placebo group GSV score distribution was determined using (a) the chronological age range design factor, (b) the GSV SEM table (Pearson Assessments, Personal Communication, September 30, 2020), and (c) the internal consistency reliability estimates (Vineland Scoring Manual Table 6.1). Both the GSV SEM and reliability estimates are presented by normative age group, such that an age group-specific SD could be calculated using the following formula: \(SD=\frac}\) . Because the chronological age range design factor spanned multiple Vineland normative age groups, we derived the variance of the mixture of n age groups (essentially a weighted average that accounts for the dispersion of the means of each age group): \(_^2=\sum_1^n\left(_n_n^2\right)+\left(\sum_1^n\left(_n_n^2\right)-\sum_1^n_n_n\right)}^2\right)\), where w represents the proportional weight of the age range design factor covered by the Vineland manual age group.
Step 2Step 1 was repeated to generate the scores for the active treatment group. These scores were drawn from a bivariate normal distribution, where the mean of the baseline distribution was identical to that of the placebo group and the mean of the endpoint distribution was shifted by adding a constant equal to the treatment effect size (large when the treatment was assumed to be effective, or zero for the simulation of type I error).
Step 3A baseline age vector with length equal to the simulation sample size was drawn with uniform probability and replacement from the range (in months) defined by the chronological age design factor. A follow-up age vector was computed by adding a constant of 6 months to the baseline age vector.
Step 4The dataset resulting from steps 1 to 3 contained randomly generated values for group assignment, baseline age, endpoint age, baseline GSV, and endpoint GSV. The Vineland Manual Table B.2 was used to convert these GSV into raw scores. If multiple raw scores were associated with a single GSV score, the median raw score was selected. The resulting raw scores were then converted into V-scale values based on the age of the case, using Vineland Scoring Manual Table B.1.
Model of analysisEach stimulated dataset was analyzed using an analysis of covariance (ANCOVA) model, with baseline score included as a covariate and the effect of group assignment (placebo versus active) the effect of interest. The outcomes of interest in this study were power and type I error. Power is the ability of a test to detect (i.e., produce a p-value below some threshold) a true effect. In this study, power was defined as the proportion of the replications for a given scenario that the two-tailed test of the null hypothesis was rejected at p = .05. Type I error is the proportion of tests which incorrectly rejected the null when the true effect size is zero. Given the data generation described above and an alpha of .05, Power should be at 90% and the type I error rate should be near 5%.
留言 (0)