
記住我

Due to advances in diagnostic and treatment armamentarium, cardiovascular disease (CVD) mortality has steadily declined over the past decades.1 However, the risk of cardiovascular (CV) events among patients undergoing dialysis remains 20–30 times higher than that in the general population.2 Patients undergoing peritoneal dialysis (PD) have an increased risk of CV mortality than those undergoing hemodialysis (HD).3
Recent randomized controlled studies (RCTs), including patients undergoing dialysis, have failed to demonstrate that hydroxymethylglutaryl-CoA reductase inhibitor (statin) can reduce fatal and nonfatal CV events despite clinically relevant reductions in serum cholesterol levels.4–6 Therefore, according to the Kidney Disease: Improving Global Outcomes guidelines, statin or statin/ezetimibe combination therapy was recommended in adults with dialysis-dependent chronic kidney disease (CKD) with evidence level 2A.7 Although the SHARP trial has demonstrated that the statin effect on the major atherosclerotic event in patients undergoing PD is neutral,6 some observational studies have shown the possible protective effect of statin therapy in patients undergoing PD.8,9 Further subgroup analysis of statin effect focusing on patients undergoing PD in large RCTs is still lacking.
This systematic review and meta-analysis aimed to evaluate whether statins reduce the mortality and CVD risks in patients undergoing PD and investigate the effects of statins on biochemical markers.
2. METHODSThe prespecified protocol of this systematic review was registered at PROSPERO (number CRD 42021242828), and the study was performed in accordance with the PRISMA guidelines (Supplemental Table 1, https://links.lww.com/JCMA/A165).
2.1. Search strategyThree electronic databases (MEDLINE via PubMed, Cochrane, Embase, Scopus, and Airitilibrary) were searched on June 14, 2022, using the search strategies detailed in Supplemental Table 2, https://links.lww.com/JCMA/A165. The ClinicalTrials.gov website and Google Scholar were also searched for randomized trials registered as completed but not yet published. The search was limited to RCTs, clinical trials, and cohort studies (Supplementary Table 2, https://links.lww.com/JCMA/A165).
Three investigators (D.Y.L., C.J.H., and H.M.C.) used a three-step search strategy. An initial limited search of MEDLINE and PubMed was performed, followed by analyzing the text words in the title, abstract, and index terms used to describe the article. A second search using all identified keywords and index terms was performed across all included databases. Subsequently, the reference lists of all the identified reports and articles were searched for additional studies. Eligibility queries were resolved through discussion. In cases of missing data in the included studies, the authors were contacted by e-mail for further information. The search was repeated to ensure accuracy and completeness.
2.2. Inclusion and exclusion criteriaRCTs and cohort studies were deemed eligible if they included patients aged ≥18 years who underwent PD. The intervention and control groups received statin therapy and a placebo or standard treatment, respectively. The types of statins were not limited, except for cerivastatin, which was withdrawn from the market owing to serious side effects. RCTs, clinical trials, and cohort studies that reported one or more endpoints that met our primary or secondary outcomes were included. Our primary outcome of interest was the association between statin use and a reduction in all-cause mortality and CVD. The secondary outcomes of interest were the association between statin use, lipid profiles, and inflammatory profile changes.
2.3. Data extraction and quality assessmentTwo reviewers (D.Y.L. and H.M.C.) independently extracted data. The data collected from each study included: (1) trial details (first author and year), (2) region of participating centers, (3) study design, (4) inclusion and exclusion criteria, (5) total number of patients in each group, (6) follow-up duration, (7) PD duration, (8) end-stage renal disease (ESRD) etiology, (9) baseline lipid profile, including low-density lipoprotein cholesterol (LDL-C), high-density lipoprotein cholesterol (HDL-C), total cholesterol, and triglyceride (TG) levels, (10) changes in lipid profile, (11) baseline C-reactive protein (CRP) level, (12) baseline albumin level, and (13) provided estimates of each outcome of interest. This information was extracted in a predesigned form using Microsoft Excel. Any divergence between the reviewers was discussed with a third reviewer (C.J.H.). An agreement was reached through a consensus. The Newcastle-Ottawa scale was used to determine the quality of cohort studies,10 and the Cochrane tool was used to assess the risk of bias for RCTs. The overall certainty of the evidence for each outcome depending on the risk of bias, indirect evidence, inconsistency, effect estimates imprecision, and potential publication bias, was analyzed using the grading of recommendations assessment, development, and evaluation (GRADE) approach.11
2.4. Data and statistical analysesThis meta-analysis and systematic review reported the number and proportion of patient characteristics. Studies by Cueto-Manzano et al12 and Han et al13 reported secondary outcomes as the median secondary outcomes. We converted the median to mean and standard deviation (SD), assuming the data distribution was symmetrical. The SD was considered approximately equal to the width of the interquartile range divided by 1.35.14 Concerning the influence of small-study effects on the results of a meta-analysis where evidence of between-study heterogeneity (I2 > 0) exists, we compared the fixed- and random-effects estimates of the intervention effect, and the result was similar.15 Considering the variance between studies, the DerSimonian and Laird random-effects model was used to analyze the pooled hazard ratio (HR) and 95% confidence interval (CI) obtained in studies included for all-cause mortality and CVD evaluation.16 Mean differences (MD) and 95% CIs of changes in lipid profiles and inflammatory biomarkers were selected as effect measures. Between-study heterogeneity was statistically assessed using Higgins’s I2 statistic.17 A CI for I² was constructed using the noncentral chi-square method, and an I² value >50% showed substantial heterogeneity. A formal assessment of publication bias was performed using Egger’s regression asymmetry test.18 Sensitivity analysis was conducted using the leave-one-out meta-analysis function from the meta R package.19 For secondary outcome analysis, we performed sensitivity analyses using different correlation coefficients due to the lack of change in SD in the included studies. The overall results of the sensitivity analyses showed no difference in the correlation coefficient range (0.5–0.9).20 All analyses were performed using RevMan (Version 5.3. Copenhagen: The Nordic Cochrane Centre, The Cochrane Collaboration [2014]).
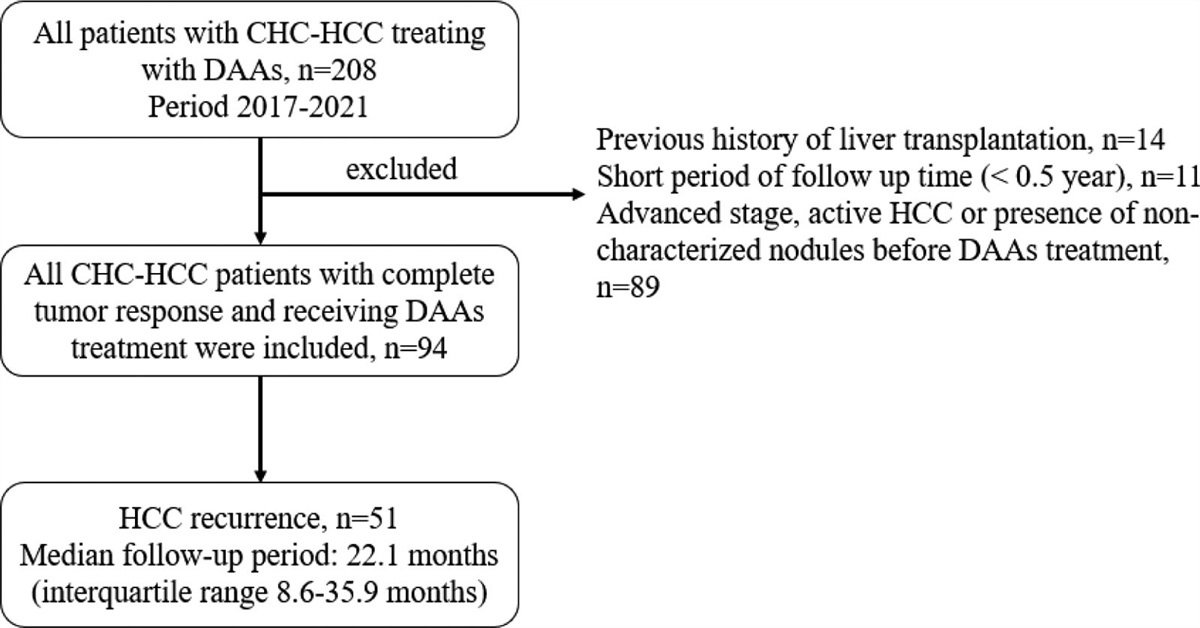
3. RESULTS 3.1. Search resultsThe initial search strategy yielded 2,746 unduplicated studies; after conducting title research based on the inclusion and exclusion criteria, 2,729 studies were excluded. In the Cochrane Library, a systemic review of the effects of statins on clinical outcomes in dialysis patients was first reported in 2004 and updated in 2009 and 2013. The previous systematic review and meta-analysis were reviewed carefully, and seven additional studies from the reference list of two review articles were included.21,22 Two reviewers (D.Y.L. and H.M.C.) independently assessed the 24 relevant studies included.6,8,9,12,13,23–39 After excluding seven studies without full-text articles,33–36,39 17 studies were left. Subsequently, we critically appraised all 17 studies, and their inclusion was independently analyzed by two review authors (D.Y.L. and H.M.C.). Eight full-text articles were excluded for the reasons shown in Fig. 1. Among the remaining 9 studies for qualitative synthesis, six reported secondary outcomes,12,13,23–26 and seven reported primary outcomes, including all-cause mortality or CVD. However, two studies had mixed HD and PD patients without further PD subgroup analysis,30,31and one study’s endpoint was a composite of all-cause mortality, nonlethal acute myocardial infarction, coronary artery bypass graft surgery, and percutaneous transluminal coronary angioplasty.27 Finally, four studies were included for primary outcome meta-analysis (two RCTs and two observational studies).6,8,9,23Table 1 summarizes the characteristics of the included studies. The entire search process is shown in the PRISMA flowchart (Fig 1).
Table 1 - Characteristics of the included studies Study Design/country/facility number Group N Study follow-up duration Outcome of interest Wu et al (2017)23 (1) prospective, randomized, open-labeled trialALT = alanine transaminase; AMI = acute myocardial infarction; CABG = coronary artery bypass graft; CAD = coronary artery disease; CHD = coronary heart disease; CK = creatine kinase; CRP = C-reactive protein; CVD = cardiovascular disease; HD = hemodialysis; HDL = high-density lipoprotein cholesterol; IL-6 = Interleukin 6; LDL-C = low-density lipoprotein cholesterol; MI = myocardial infarction; PAOD = peripheral arterial occlusive disease; PD = peritoneal dialysis; PTCA = percutaneous transluminal coronary angioplasty; TC = total cholesterol; TNF-alfa = tumor necrosis factor-alpha.
 Fig. 1:
 Flowchart of literature selection. CV = cardiovascular; CRP = C-reactive protein; HD = hemodialysis; PD = peritoneal dialysis; RCT = randomized controlled trial.
3.2. Characteristics of the included studiesAmong the 2,933 patients with PD in the nine included studies, 968 used statins. Two, one, one, one, and four studies used simvastatin 20 mg daily, simvastatin 5 mg daily, atorvastatin 40 mg daily, pravastatin 20 mg daily, and statins, respectively. The mean age of the study participants ranged from 48 to 59 years. There was no significant difference in age or male percentage between the statin and nonstatin groups. The follow-up duration ranged from 6 months to 4.9 years. One RCT required patients to receive either pravastatin or placebo orally for 2 months during the first treatment period. After a 1-month washout period, the patients were crossed over to receive another drug (or placebo) for an additional 2 months. The etiologies of ESRD in these patients were diabetes mellitus (14.3–74%), hypertensive glomerulosclerosis (11–62.5%), chronic glomerulonephritis (9.3–50%), polycystic kidney disease (2.6–15%), and unknown or other causes (9–24.9%). Baseline lipid profiles, albumin levels, and CRP levels are shown in Table 2. Table 3 summarizes the characteristics of the six studies with available data on prespecified secondary outcomes. Among the four included studies with available data on prespecified primary outcomes, one RCT and two observational cohort studies provided the desired data on all-cause mortality, and two RCTs and one observational cohort study provided the desired data on CVD.
Table 2 - Characteristics of participants in the included studies Studies Treatment group Patient, N Age, year Male, N, % PD duration, Months Cause of ESRD N, % Baseline lipid profile Others Diabetic Mellitus Hypertensive nephrosclerosis Chronic glomerulonephritis Polycystic kidney Others and Unknown LDL (mg/dl) HDL (mg/dl) Cholesterol (mg/dl) TG (mg/dl) Baseline CRP (mg/l) Baseline albumin (g/dl) Wu et alARB = angiotensin II receptor blocker; CRP = C-reactive protein; HDL = high-density lipoprotein cholesterol; LDL-C = low-density lipoprotein cholesterol; NR = not reported; TC = total cholesterol.
留言 (0)