
記住我


Conventional T1- and T2-weighted magnetic resonance imaging (cMRI) is, in addition to clinical examination, the method of choice for the diagnosis and treatment monitoring of multiple sclerosis (MS). Lesions are well visualized as hyperintensity on FLAIR, but FLAIR does not allow discrimination among inflammation, edema, demyelination, gliosis, and axonal loss. Although hypointensity on T1-weighted MRI (“black-hole lesions”) is correlated with permanent clinical impairment and better reflects the severity of irreversible tissue destruction, it is similarly not able to fully explain all the underlying pathological processes.1–5 Some studies using advanced MRI approaches6–13 (ie, magnetization transfer ratio or diffusion tensor imaging) or histopathology7,9,14–17 have also revealed alterations in normal-appearing white matter (NAWM), which are not visible on cMRI, highlighting the need for complementary noninvasive imaging modalities.18–20
For instance, magnetic resonance spectroscopic imaging (MRSI) can detect pathologies on a biochemical level. By noninvasively quantifying several brain neurochemicals, it can visualize pathophysiological processes that contribute to lesion formation in MS. The most commonly reported abnormalities in MS are elevated choline (Cho; a marker of myelin turnover), depleted N-acetylaspartate (NAA; reflecting reduced neuronal/axonal integrity and function), and increased myo-inositol (mIns; a marker for astroglial hypertrophy and hyperplasia), the elevation of which correlates with clinical impairment.21–23 The poor spatial resolution of MRSI has so far limited the detection of small focal metabolic abnormalities in NAWM and cortical gray matter (GM), which would be necessary to characterize lesion development in its early phase.
Free Induction Decay (FID)–MRSI24–27 at 7 T with a nominal ~2 × 2 mm2 in-plane spatial resolution could be an attractive clinical tool that overcomes this limitation by enabling accurate quantification of small local metabolic changes that are potentially relevant for insights into MS pathogenesis, early diagnosis, and prognosis. A recent study by Heckova et al28 has shown promising results detecting metabolic alterations in NAWM absent in healthy controls. However, the study did only look at the NAWM as a whole and did neither investigate those NAWM alterations in detail nor the NAWM in close proximity of lesions, which is of interest for, that is, slowly expanding iron rim lesions found using susceptibility-weighted imaging.29–31 Furthermore, they did not assess MS lesions on an individual basis, especially in regard to their microscopic appearance or their location.
Thus, the aims of our exploratory study were to assess focal metabolic hotspots invisible on cMRI, as well as metabolite alterations inside and at the periphery of lesions that are visible or invisible on cMRI and could not be investigated using traditional low spatial resolution MRS methods, and to correlate their metabolic changes with T1-hypointensity and the distance of lesions to cortical GM.
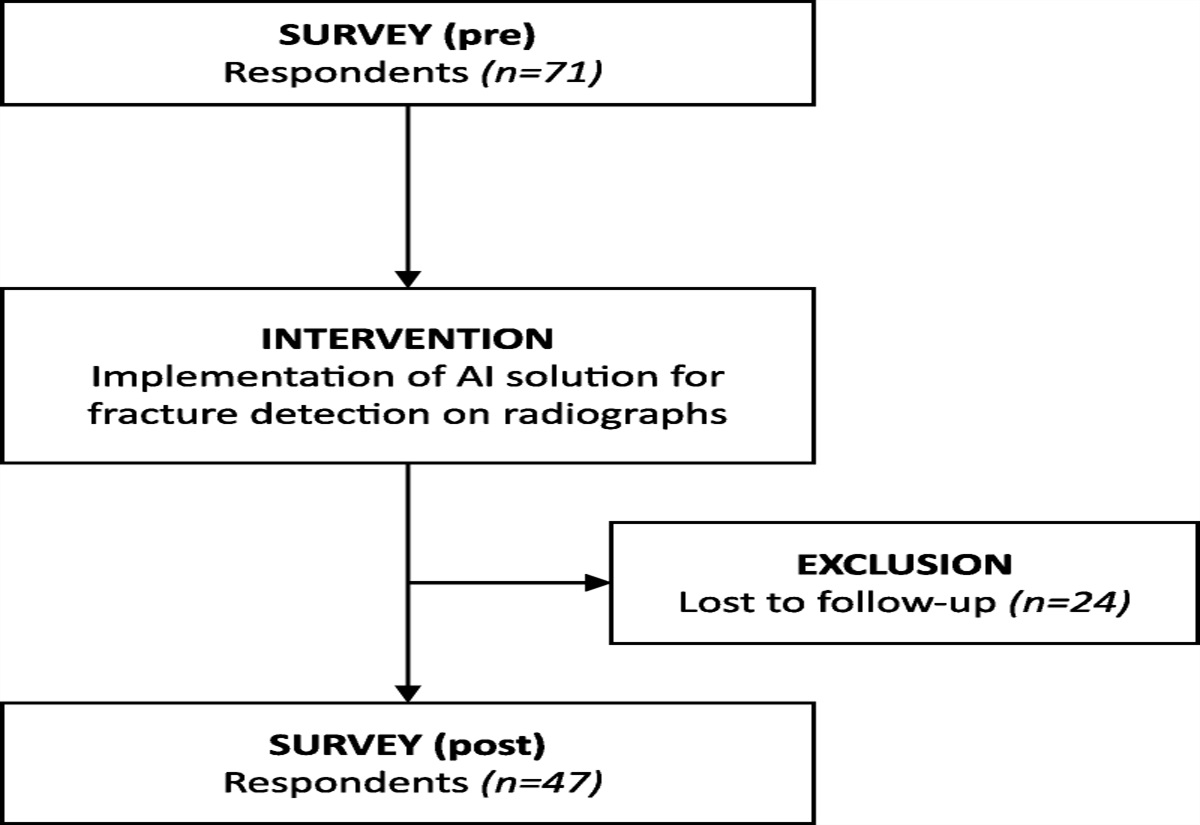
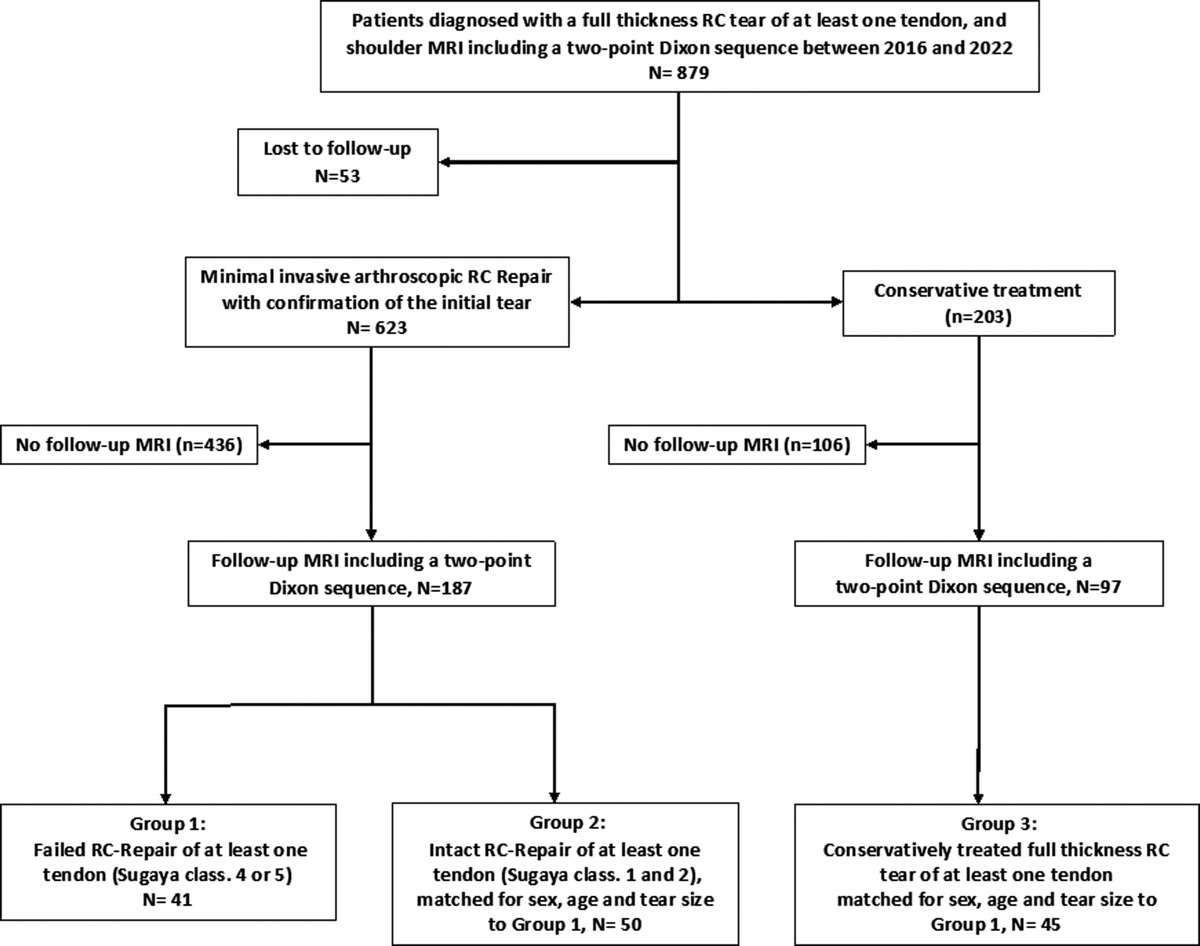
MATERIALS AND METHODS Study PopulationInstitutional review board approval (EK 154/2009) and informed consent were obtained for this prospective study. All patients were recruited between January 2016 and December 2017 by the Department of Neurology and met the following criteria (Fig. 1): clinically definite MS diagnosis according to the revised McDonald criteria,32 age 18–55 years, no Expanded Disability Status Scale (EDSS) score change within the last 6 months, stable treatment or no treatment within the last 6 months, no contradiction to 7 T MRI, no relapse or corticosteroid therapy during the last 3 months, and no other known neurological or neuropsychiatric disease.
 FIGURE 1:
 Flowchart of participants with MS enrolled in the study. EDSS, Expanded Disability Status Scale; MS, multiple sclerosis.
Imaging ProtocolThe study was performed using a 7 T whole-body magnetic resonance scanner (Magnetom; Siemens Healthineers, Erlangen, Germany) equipped with a 32-channel head coil (Nova Medical, Wilmington, MA). In each session, T1-weighted MP2RAGE (TR = 5000 milliseconds, TE = 4.13 milliseconds, TI1/TI2 = 700/2700 milliseconds, flip angle 1/2 = 4/5 degrees; including routinely calculated T1 maps33) images with 0.8 × 0.8 × 0.8 mm3 and T2-weighted 3D FLAIR (TR = 8000 milliseconds, TE = 270 milliseconds, TI = 2180 milliseconds) images with 0.86 × 0.86 × 0.86 mm3 spatial resolution were acquired to visualize MS lesions and to position the MRSI slice. Single-slice transversal 2D FID-MRSI27 was acquired above the corpus callosum with the following protocol: acquisition delay, 1.3 milliseconds25; TR, 200 milliseconds; flip angle, 27 degrees; 4-fold parallel imaging acceleration via CAIPIRINHA (controlled aliasing in parallel imaging results in higher acceleration)34; scan time, 6:06 minutes; FOV, 220 × 220 mm2; matrix size, 100 × 100; nominal voxel size, 2.2 × 2.2 × 8 mm3; and effective voxel volume, 77 μL (as explained in Kreis et al,35 nominal voxel volume, 38 μL). Additional details about data acquisition can be found in Supplementary Table S1 (see Table, Supplemental Digital Content 1, https://links.lww.com/RLI/A743).
Spectroscopic Data ProcessingUsing the FSL brain extraction tool, brain masks were extracted from T1-weighted images, and the MRSI spectra within these brain masks were processed via automated in-house developed software using Matlab (R2013a; MathWorks, Natick, MA), Bash (v4.2.25; Free Software Foundation, Boston, MA), and MINC (v2.0; McConnell Brain Imaging Center, Montreal, Quebec, Canada). Processing included prescan-based coil combination,36 parallel imaging reconstruction,34 spatial hamming filtering, and lipid signal removal.37 Individual spectra were fitted via LCModel (version 6.3–1; http://s-provencher.com/lcmodel.shtml) in the spectral range of 1.8 to 4.2 ppm using a basis set of simulated metabolites38 (Asp, tCr, tCho, γ-aminobutyric acid, Glc, Gln, Glu, GSH, mIns, tNAA, scyllo-Ins, Tau) and a measured macromolecular background.39 All MRS data are reported in accordance with standardized guidelines40 (see Table, Supplemental Digital Content 1, https://links.lww.com/RLI/A743; Supplemental Digital Content 2, https://links.lww.com/RLI/A744). Maps of metabolite levels/ratios, Cramer-Rao lower bounds, and spectral quality (ie, signal-to-noise ratio, and linewidth as full-width-at-half-maximum of the fitted NAA peak) were created.41
Data Analysis Segmentation and Lesion Type CategorizationAfter resampling the metabolic maps to the resolution of T1-weighted MRI by tricubic interpolation, ROIs were created using semiautomatic (user-guided) segmentation software ITK-SNAP42 and categorized into 4 ROI types: (1) “ROI_cMRI” defined MS lesions that appeared hyperintense on FLAIR and hypointense on T1-weighted MRI; (2) “ROI_MRSI” refers to hyperintense hotspots on Ins/tNAA maps (ie, ratio altered by a minimum of 50% compared with the surrounding tissue) that did not match any lesion on T1 and/or FLAIR; (3) representative ROIs of NAWM (“ROI_NAWM”); and (4) lesions visible on cMRI, but not on mIns/tNAA maps. Confluent lesions were included in the segmentation and were defined as having to be merged on at least 3 contiguous slices: if this was the case, they were segmented and counted as 1 lesion; if lesion merge was found on less than 3 layers, they were segmented as 2 separate lesions. To minimize partial volume errors, only lesions with a volume >20 mm3 inside the MRSI slab were included in the final analysis.
To compare the metabolite levels for black-hole lesions of different T1-hypointensity, T1 maps routinely calculated from MP2RAGE33 were read out and lesions were categorized into 3 groups (relative to T1 relaxation times found in WM and GM at 7T43) according to their T1 relaxation times: “mildly hypointense” (T1 < 2000 milliseconds); “moderately hypointense” (2000 milliseconds < T1 < 2500 milliseconds); and “severely hypointense” (T1 > 2500 milliseconds).
Layer AnalysisTo investigate whether the border of MS lesions is metabolically more active, we evaluated the metabolic profile inside and in proximity to MS lesions. For this, all segmented lesion ROIs were eroded (removing the outermost layer of voxels of the ROI) and dilated (adding a ring of voxels) 3 times resulting in 7 lesion layers in total (from the innermost layer L−3 over the border L0 to the outermost layer L+3; each layer was ~1 mm thick). As the dilation of lesions close to the GM or cerebrospinal fluid (CSF) might lead to artificial lesion voxels intruding on the GM or CSF, lesion-free GM and CSF masks were created using Freesurfer and Mincmath. These lesion-free masks were subtracted from the dilated ROIs to cancel out intruding voxels. In some cases, manual corrections for GM, CSF, and voxels of other close by lesions with FSLView were needed. For this analysis, only lesions with an original size in the range of 100–400 mm3 were included in order to fit 4 layers inside the lesion. Metabolic ratios for each lesion layer were normalized to NAWM (represented by the lesion's outermost layer).
Cortical LesionsAll MS lesions were labeled according to their proximity to the cortex44: cortical lesions as “cortical,” juxtacortical lesions (defined as lesions adherent to the cortex) as “juxta,” and subcortical lesions (found in the NAWM but in close proximity to the cortex; maximum 1 cm) as “sub.” All other lesions were labeled as “deep WM.” Owing to the limited number of “cortical” lesions, “juxta” and “cortical” lesions were evaluated jointly as “juxta + cortical.”
StatisticsIBM SPSS Statistics 24 was used. Descriptive statistics for Ins/tNAA, Ins/tCr, tNAA/tCr, and tCho/tCr were derived for all ROIs. Metabolite levels were compared among different lesion types, T1-hypointensity types, cortical lesion subtypes, and lesion layers via one-way analysis of variance and Tukey post hoc analysis. Correlation between metabolite levels and T1 times was investigated via a 2-tailed Pearson correlation analysis. A P < 0.05 was considered statistically significant.
RESULTSFifty-one patients with relapsing-remitting MS (RRMS) (30 female/21 male; mean age, 35.4 ± 9.9 years) were included in the final study. Patient demographic, disease-modifying therapies, and EDSS scores (assessed by 2 experienced neurologists in consensus) were collected (Table 1). In total, 779 ROIs were segmented: 750 ROI_cMRI (21 lesions not visible on mIns/tNAA [category IV] were included due to limited amount) and 29 ROI_MRSI. Thus, ~4% of metabolic alterations were visible only on MRSI, but not on cMRI. Of the 750 ROI_cMRI, 353 (including 9 [category IV] lesions) fulfilled the criterion of minimum size and were included in the final analysis. Of these, 111 were found in subcortical WM and 47 in juxta + cortical location (Table 1). Furthermore, 119 were classified as mildly hypointense, 150 as moderately hypointense, and 84 as severely hypointense. Eighty-nine lesions fulfilled the minimum size criterion for the layer analysis. The spectral quality was high; although NAA is reduced by pathology, the mean signal-to-noise ratio of NAA ranged from 11 to 17, the mean full-width-at-half-maximum of NAA ranged from 19.9 to 22.6 Hz, whereas the Cramer-Rao lower bounds (mIns, tCho, tCr, tNAA) ranged from 16 to 24 (see Table, Supplemental Digital Content 2, https://links.lww.com/RLI/A744).
TABLE 1 - Characteristics and Clinical Data of RRMS Patients Characteristic Participants With RRMS (n = 51) Sex Male 21 Female 30 Age, y* 35.43 ± 9.89 (21–55) Disease duration, mo* 95.87 ± 57.23 (2–229) EDSS score† 2 (0–5) No. MS lesions 750 MRSI hotspots 29 Cortical/juxtacortical/subcortical lesions 15/32/111 No. participants receiving therapy 44 First-line 19 Second-line 25Note: Unless otherwise specified, data are numbers of participants.
*Data are means ± standard deviations; data in parentheses are ranges.
†Data are medians, with ranges in parentheses.
RRMS, relapsing-remitting multiple sclerosis; EDSS, Expanded Disability Status Scale; MS, multiple sclerosis; MRSI, magnetic resonance spectroscopic imaging.
Changes in mIns/tNAA were the most prominent among the metabolic ratios at visual inspection (Fig. 2). mIns/tNAA was higher in ROI_MRSI (mean ± SD: 1.56 ± 0.91, +181.9%, P ≤ 0.001) and in ROI_cMRI (mean ± SD: 1.18 ± 0.57, +112.9%, P ≤ 0.001) than in ROIs_NAWM (mean ± SD: 0.55 ± 0.15). mIns/tNAA was higher for ROI_MRSI than for ROI_cMRI (mean ± SD: 1.56 ± 0.91 vs 1.18 ± 0.57, +32.4%, P ≤ 0.01).
 FIGURE 2:
 Boxplot diagrams for mIns/tNAA, mIns/tCr, tNAA/tCr, and tCho/tCr of the 3 investigated regions: “ROI_NAWM,” “ROI_cMRI,” and “ROI_MRSI.” Highly significant differences were found especially for mIns/tNAA.
Differences in mIns/tCr followed a similar trend. mIns/tCr was +42.9% higher for ROI_MRSI (mean ± SD: 1.23 ± 0.31, P ≤ 0.001) and +29.9% higher for ROI_cMRI (1.12 ± 0.35, P ≤ 0.001), respectively, than for ROI_NAWM (mean ± SD: 0.86 ± 0.28).
Similarly, tNAA/tCr was lowest for ROI_MRSI. tNAA/tCr was −41.5% lower for ROI_MRSI (mean ± SD: 0.96 ± 0.32, P ≤ 0.001) and −34.0% lower for ROI_cMRI (mean ± SD: 1.08 ± 0.38, P ≤ 0.001), respectively, than for ROI_NAWM (mean ± SD: 1.64 ± 0.34).
tCho/tCr was lower only in ROI_cMRI than in ROI_NAWM (mean ± SD: 0.43 ± 0.07 vs 0.46 ± 0.07, −6.27%, P ≤ 0.05).
Representative metabolic maps on conventional MRIs of 3 MS patients are visualized in Figures 3 and 4. Here, MS lesions can be clearly seen on T1-weighted and FLAIR images, as well as on mIns/tNAA, mIns/tCr, and tNAA/tCr maps. Some metabolic alterations (eg, elevated mIns/tNAA and mIns/tCr) are present in NAWM.
 FIGURE 3:
 A, T1-weighted MP2RAGE and T2-weighted FLAIR MRI of an MS patient. The yellow arrow points to a “severely T1-hypointense” lesion, and the blue arrow points to a “moderately T1-hypointense” lesion, which are both clearly visible on mIns/tNAA, mIns/tCr, and tNAA/tCr metabolic maps. The red arrows depict “mildly hypointense” lesions, which are apparent on mIns/tNAA and mIns/tCr, although only visible as a weak hypointensity on MP2RAGE. For greater clarity and visibility, the respective arrows on the metabolic maps are kept in white. B, T1-weighted MP2RAGE and T2-weighted FLAIR of another MS patient. Red arrows point to “MRSI hotspot” lesions, which can neither be seen as a T1-hypointensity on MP2RAGE nor as a T2-hyperintensity on FLAIR, although they demonstrate a large increase on mIns/tNAA and mIns/tCr metabolic maps. In addition, single metabolite maps are shown.
 FIGURE 4:
 T1-weighted MP2RAGE and T2-weighted FLAIR MRI of a third MS patient. The blue arrow points to a “ROI_cMRI,” the red arrow to a “ROI_MRSI,” and the yellow arrow to a “ROI_NAWM.” For each study group, a sample spectrum is shown.
T1 Relaxation Versus Metabolite LevelsDifferences in tNAA/tCr among mildly, moderately, and severely T1-hypointense lesions were the most prominent metabolic distinction (Fig. 5A) (P ≤ 0.001). tNAA/tCr was highest in mildly and lowest in severely T1-hypointense lesions with values for mildly versus moderately hypointense (mean ± SD: 1.27 ± 0.43 vs 1.05 ± 0.33, −16.8%, P ≤ 0.001), for mildly versus severely hypointense (mean ± SD: 1.27 ± 0.43 vs 0.91 ± 0.28, −28.0%, P ≤ 0.001), and for moderately versus severely hypointense (mean ± SD: 1.05 ± 0.33 vs 0.91 ± 0.28, −13.5%, P ≤ 0.05).
 FIGURE 5:
 A, Boxplot diagrams of mIns/tNAA, mIns/tCr, tNAA/tCr, and tCho/tCr for 3 different categories of MS lesions, grouped based on their absolute T1 values. mIns/tNAA showed significantly higher metabolic ratios in moderately and severely hypointense lesions compared with mildly hypointense lesions. In tNAA/tCr and tCho/tCr, severely hypointense lesions exhibited the lowest metabolic ratios. B, Pearson correlation between absolute T1 values and mIns/tNAA, mIns/tCr, tNAA/tCr, and tCho/tCr, respectively, of MS lesions. Significant overall correlations were found for mIns/tNAA, tNAA/tCr, and tCho/tCr. In mIns/tNAA, a positive correlation for mildly hypointense lesions was found, which evolved into a negative correlation with increasing T1 relaxation times. For mIns/tCr, an increasingly negative correlation for moderately and highly hypointense lesions is apparent, whereas, for both tNAA/tCr and tCho/tCr, the negative correlation vanished with increasing T1 relaxation times.
mIns/tNAA was +31.2% higher in moderately compared with mildly (mean ± SD: 1.26 ± 0.63 vs 0.96 ± 0.36, P ≤ 0.001), and +38.4% higher in severely compared with mildly (mean ± SD: 1.33 ± 0.59 vs 0.96 ± 0.36, P ≤ 0.001) T1-hypointense lesions.
Furthermore, tCho/tCr was significantly lower in severely than in mildly (mean ± SD: 0.44 ± 0.07 vs 0.40 ± 0.06, −9.2%, P ≤ 0.001), as well as in severely than mildly (mean ± SD: 0.44 ± 0.07 vs 0.40 ± 0.06, −8.2%, P ≤ 0.001) T1-hypointense lesions.
For mIns/tCr, the correlation for mild and moderate T1-hypointensity (mean ± SD: 1.07 ± 0.36 vs 1.17 ± 0.32, +9.12%, P = 0.058) was not significant.
All metabolic ratios except for mIns/tCr (r = −0.056) correlated significantly with lesion T1. tNAA/tCr showed the strongest correlation (r = −0.369, P ≤ 0.01), followed by tCho/tCr (r = −0.268, P ≤ 0.01) and mIns/tNAA (r = 0.152, P ≤ 0.01) (Fig. 5B).
Interestingly, although mIns/tCr did not show an overall correlation, the moderate and severely T1-hypointensity subgroups exhibited significant negative correlations with increasing T1-hypointensity (mildly: r = −0.002, P = 0.979; moderately: r = −0.221, P ≤ 0.01; severely: r = −0.365, P ≤ 0.01).
Although mIns/tNAA showed an overall weak positive correlation, the direction of the correlation changed from a positive correlation in mildly hypointense lesions (r = 0.234, P ≤ 0.05) toward a negative correlation in severely hypointense lesions (r = −0.362, P ≤ 0.01).
In the case of tNAA/tCr, only the overall correlation and correlation in the mildly hypointense subgroup were significant (mildly: r = −0.266, P ≤ 0.01; moderately: r = −0.08, P = 0.371; severely: r = −0.087, P = 0.450).
Lesion PeripheryMetabolite levels were significantly different for neighboring layers around MS lesions (P < 0.001) (Fig. 6A).
 FIGURE 6:
 A, An example of the originally segmented MS lesion (A), and 7 lesion layer rings (B–H) created by dilation/erosion of the original lesion using the mincmorph function. As the dilation of lesions close to the GM or cerebrospinal fluid (CSF) might lead to artificial lesion voxels intruding on the GM or CSF, lesion-free GM and CSF masks were created using Freesurfer and Mincmath. These lesion-free masks were subtracted from the dilated ROIs to cancel out intruding voxels. In some cases, manual corrections with FSLView were needed. I, Image shows the lesion on MP2RAGE and (J) shows all rings merged. A scale in the range of millimeters is given. B, Boxplot diagrams of normalized mIns/tNAA, mIns/tCr, tNAA/tCr, and tCho/tCr show significant differences in metabolite concentrations between the lesion layers for mIns/tNAA, and especially, tNAA/tCr. Only significant results among L+3, L0, and L−3 are shown.
The most prominent metabolic differences between lesion layers were found for tNAA/tCr. Compared with the lesion border (L0), tNAA/tCr ratios were +11.5% higher for the outermost ring (L+3) (mean ± SD: 0.90 ± 0.10 vs 1.00 ± 0.00, P ≤ 0.001). For L−3, tNAA/tCr was −15.4% lower than for L+3 (mean ± SD: 1.00 ± 0.00 vs 0.85 ± 0.23, P ≤ 0.001). The difference of −5.6% between L0 (0.90 ± 0.10) and L−3 (0.85 ± 0.23) was not significant (P = 0.156).
For mIns/tNAA, an inverse behavior was observed. For L+3, mIns/tNAA was −9.8% lower than for L0 (mean ± SD: 1.00 ± 0.00 vs 1.11 ± 0.12, P ≤ 0.001). For L−3, mIns/tNAA was +16.3% higher than for L+3 (mean ± SD: 1.16 ± 0.27 vs 1.00 ± 0.00, P ≤ 0.001). The difference of +4.9% between L0 (1.11 ± 0.12) and L−3 (1.16 ± 0.27) was not significant (P = 0.305).
No significant differences were found between lesion layers for mIns/tCr (L+3 vs L0: P = 0.640; L+3 vs L−3: P = 0.722; L0 vs L−3: P = 1.00) and tCho/tCr (L+3 vs L0: P = 0.618; L+3 vs L−3: P = 0.085; L0 vs L−3: P = 0.928).
Cortical LesionsThere were significant metabolic differences between MS lesions near and distant from the cortex (P < 0.05).
The mean tCho/tCr of lesions was lower near the cortex (Fig. 7B). Subcortical lesions had −6.6% lower tCho/tCr (mean ± SD: 0.41 ± 0.06, P ≤ 0.01) than deep WM lesions (mean ± SD: 0.44 ± 0.07), whereas juxta + cortical lesions had −14.6% lower tCho/tCr (mean ± SD: 0.37 ± 0.07, P ≤ 0.001) than deep WM lesions.
 FIGURE 7:
 A, Schematic depiction of lesion subtypes with regard to lesion proximity to the GM. B, Boxplot diagrams of mIns/tNAA, mIns/tCr, tNAA/tCr, and tCho/tCr for the different lesion location subtypes. tCho/tCr showed the familiar WM-GM distribution, whereas mIns/tCr showed significantly lower metabolic ratios toward the cortex.
For tNAA/tCr and mIns/tNAA, there was no significant difference (mIns/tNAA: deep WM vs juxta + cortical [mean ± SD: 1.19 ± 0.55 vs 0.87 ± 0.41, −27.4%, P = 0.089]).
mIns/tCr was −21.0% lower for juxta + cortical lesions than for deep WM (mean ± SD: 0.89 ± 0.39 vs 1.13 ± 0.35, P ≤ 0.05) and −20.5% lower for juxta + cortical than subcortical lesions (mean ± SD: 0.89 ± 0.39 vs 1.12 ± 0.31, P ≤ 0.05).
DISCUSSIONThis study evaluated metabolic alterations in the NAWM, inside and in the proximity of MS lesions in 51 RRMS patients, and correlated these changes with T1 relaxation and distance between lesions and the cortical GM.
Multiple sclerosis lesions were clearly visualized on high-resolution metabolic maps, particularly mIns/tNAA maps. This prominent difference is attributed to the combined effect of elevated mIns, which reflects astroglial activation, and decreased tNAA, which is associated with axonal loss, neuronal damage, and mitochondrial dysfunction. Interestingly, we found focal regions of, on average, 2.8-fold higher mIns/tNAA than those of the surrounding NAWM and with an appearance similar to that of MS lesions, which were not visible (as yet) on cMRI. These MRSI hotspots had 1.3 times higher mIns/NAA ratios than typical cMRI-visible MS lesions. As it was found in a previous study,28 that these changes cannot be found in healthy controls, we hypothesize that these MRSI-visible hotspots represent initial metabolic bursts before macroscopically visible lesion formation; however, this remains to be confirmed in a longitudinal study. Earlier detection of new lesions via MRSI could in the future assist in a more accurate and earlier diagnosis of MS, help predict MS progression, and support clinical decision making, for example, therapy changes.45
The increased spatial resolution of our method enabled the clear visualization of these MRSI hotspots in otherwise inconspicuous NAWM. In prior studies with lower resolution, metabolic changes in the NAWM were described to be of diffuse nature. In contrast, our findings show that these changes are more localized than was assumed.23,45–48 The appearance of MS lesions on our high-resolution metabolic maps often closely resembled their appearance on high-resolution cMRI.
Although previous studies have shown heterogeneous metabolic alterations in “black-hole lesions,”2,4 they did not differentiate lesions according to their T1 relaxation and included very few lesions. We showed that T1-hypointense lesions exhibited different levels of metabolic activity, as confirmed by correlation analysis. tNAA/tCr showed the strongest correlation with T1-relaxation, although, interestingly, the negative correlation was stronger in the subgroup with lower T1, whereas it was weaker in the subgroup with higher T1. This suggests that the axonal loss at the beginning of lesion formation is more rapid and metabolically visible before becoming macroscopically apparent.
The contrary was found in mIns/tCr, suggesting that reactive astrogliosis might be the driving force behind the visibility of lesions on cMRI. tCho/tCr showed the highest correlation with T1 in mildly hypointense lesions, potentially reflecting a higher extent of remyelination in early lesions.1–5
We observed altered metabolic activity outside lesions, suggesting that the macroscopic lesion boundaries on cMRI cannot, in fact, be equated with the cessation of pathophysiological processes. We were able to see a clear metabolite gradient over lesions with a highly active center. In addition, we hypothesize that mIns is associated with the expansion of lesions, as increased mIns was found outside lesions while tNAA was not decreased.
An additional advantage of the higher resolution is the possibility to depict cortical lesions, which are known to play a critical role in MS.49 We were able to show that, besides the well-known WM-GM distribution of tCho/tCr, mIns/tCr also exhibits a decrease the closer the lesion is to the cortical GM. This supports the hypothesis that mIns is a biomarker for astrogliosis, as histopathological studies have confirmed that cortical lesions are largely noninflammatory with no lymphocyte infiltration, complement deposition, blood-brain barrier disruption, or apparent astrogliosis.50–54
Our study has limitations. As we cannot preclude that MS pathology might change the T1 of metabolites55 and a water scan is not possible in the clinical setting, we did not perform absolute quantification. Increased levels of metabolic ratios can be induced either by an elevated nominator, a reduced denominator, or by a combination of both. As we did not see any focal changes in tCr on single metabolite maps, tCr was chosen as denominator. In contrast to that, tNAA and mIns clearly showed changes of high magnitude on single metabolite maps, which was also shown in previous MRS studies.23,56,57 Taking the ratio of tNAA or mIns to tCr might have led to an underestimation of the respective metabolic changes, although still remaining clearly distinguishable.
Furthermore, our MRSI sequence was limited to a single 8-mm thick slice above the corpus callosum, which limited the amount of investigated lesions and hindered the inclusion of periventricular lesions. Moreover, it limited the thickness of our lesion layers (resulting in a moving average), and although only analyzing every third lesion layer, the influence of partial volume error could not be fully extinguished. The remaining partial volume errors in z-direction resulted in the need to exclude multiple lesions. However, large pathological changes (as we see them) still prevail and in-plane partial volume errors are minimized. Overcoming these limitations of a single slice, recent 3D FID-MRSI58 techniques have provided promising results in brain tumors,55 although B1+ inhomogeneities might pose a bigger bias for T1 estimation.59 Nevertheless, these methods are able to capture the full extent of MS-related neurometabolite changes over the entire brain. In addition, the number of cortical lesions was limited, highlighting the importance of recent developments60,61 to improve cortical lesion detection. Furthermore, we did not assess whether lesions were chronically active (via SWI) and/or persistent on T1-weighted images for more than 3 months before our measurements, and our patient population was quite heterogeneous with regard to disease-modifying treatment. Further (longitudinal) studies on more homogeneous patient populations and including other advanced MRI techniques will be necessary to fully understand the role of the metabolically active hotspots that we found only on MRSI, but not cMRI, especially concerning their future evolvement.
CONCLUSIONSIn this study, we observed various metabolite alterations associated with MS pathology. In particular, we found significant focal increases of mIns/NAA in WM regions that appeared normal on cMRI (ie, ~4% of metabolic alterations) and with an appearance similar to, but with even slightly higher mIns/NAA as, those observed in cMRI-visible MS lesions. The high spatial resolution of FID-MRSI allowed us to selectively assess metabolite levels in the lesion center, active lesion periphery, and even cortical lesions. Our results confirm the potential of mIns as an early biomarker in lesion development related to neuroinflammation. The correlation of mIns levels with the distance between MS lesions and the cortical GM is consistent with its role as a marker of astrogliosis. Increased mIns is likely an early event associated with the visibility and expansion of lesions on cMRI, whereas NAA is more associated with irreversible damage. This could have important clinical implications for the evaluation of disease activity and treatment monitoring.
REFERENCES 1. Bitsch A, Kuhlmann T, Stadelmann C, et al. A longitudinal MRI study of histopathologically defined hypointense multiple sclerosis lesions. Ann Neurol. 2001;49:793–796. 2. Li BSY, Regal J, Soher BJ, et al. Brain metabolite profiles of T1-hypointense lesions in relapsing-remitting multiple sclerosis. AJNR Am J Neuroradiol. 2003;24:68–74. 3. Bagnato F, Jeffries N, Richert ND, et al. Evolution of T1 black holes in patients with multiple sclerosis imaged monthly for 4 years. Brain. 2003;126:1782–1789. 4. Brex P, Parker G, Leary S, et al. Lesion heterogeneity in multiple sclerosis: a study of the relations between appearances on T1 weighted images, T1 relaxation times, and metabolite concentrations. J Neurol Neurosurg Psychiatry. 2000;68:627–632. 5. Barkhof F, Koeller KK. Demyelinating diseases of the CNS (brain and spine). In: Hodler J, Kubik-Huch RA, Schulthess GK, eds. Diseases of the Brain, Head and Neck, Spine 2020–2023: Diagnostic Imaging. IDKD Springer Series Springer; 2020. Available at: http://www.ncbi.nlm.nih.gov/books/NBK554329/. Accessed July 9, 2021. 6. Filippi M, Iannucci G, Cercignani M, et al. A quantitative study of water diffusion in multiple sclerosis lesions and normal-appearing white matter using echo-planar imaging. Arch Neurol. 2000;57:1017–1021. 7. Moll NM, Rietsch AM, Thomas S, et al. Multiple sclerosis normal-appearing white matter: pathology-imaging correlations. Ann Neurol. 2011;70:764–773. 8. Vos CMP, Geurts JJG, Montagne L, et al. Blood-brain barrier alterations in both focal and diffuse abnormalities on postmortem MRI in multiple sclerosis. Neurobiol Dis. 2005;20:953–960. 9. Seewann A, Vrenken H, van der Valk P, et al. Diffusely abnormal white matter in chronic multiple sclerosis: imaging and histopathologic analysis. Arch Neurol. 2009;66:601–609. 10. Vrenken H, Seewann A, Knol DL, et al. Diffusely abnormal white matter in progressive multiple sclerosis: in vivo quantitative MR imaging characterization and comparison between disease types. AJNR Am J Neuroradiol. 2010;31:541–548. 11. Schmierer K, Wheeler-Kingshott CAM, Boulby PA, et al. Diffusion tensor imaging of post mortem multiple sclerosis brain. Neuroimage. 2007;35:467–477. 12. Ciccarelli O, Werring DJ, Wheeler-Kingshott CA, et al. Investigation of MS normal-appearing brain using diffusion tensor MRI with clinical correlations. Neurology. 2001;56:926–933. 13. Schmierer K, Scaravilli F, Altmann DR, et al. Magnetization transfer ratio and myelin in postmortem multiple sclerosis brain. Ann Neurol. 2004;56:407–415. 14. Allen IV, McKeown SR. A histological, histochemical and biochemical study of the macroscopically normal white matter in multiple sclerosis. J Neurol Sci. 1979;41:81–91. 15. Bjartmar C, Kinkel RP, Kidd G, et al. Axonal loss in normal-appearing white matter in a patient with acute MS. Neurology. 2001;57:1248–1252. 16. Kutzelnigg A, Lucchinetti CF, Stadelmann C, et al. Cortical demyelination and diffuse white matter injury in multiple sclerosis. Brain. 2005;128:2705–2712. 17. Evangelou N, Esiri M, Smith SM, et al. Quantitative pathological evidence for axonal loss in normal appearing white matter in multiple sclerosis. Ann Neurol. 2000;47:391–395. 18. Filippi M, Rocca MA, Barkhof F, et al. Association between pathological and MRI findings in multiple sclerosis. Lancet Neurol. 2012;11:349–360. 19. Filippi M, Rocca MA. MR imaging of multiple sclerosis. Radiology. 2011;259:659–681. 20. Ineichen BV, Beck ES, Piccirelli M, et al. New prospects for ultra-high-field magnetic resonance imaging in multiple sclerosis. Invest Radiol. 2021;56:773–784. 21. De Stefano N, Narayanan S, Francis SJ, et al. Diffuse axonal and tissue injury in patients with multiple sclerosis with low cerebral lesion load and no disability. Arch Neurol. 2002;59:1565–1571. 22. Filippi M, Bozzali M, Rovaris M, et al. Evidence for widespread axonal damage at the earliest clinical stage of multiple sclerosis. Brain J Neurol. 2003;126(pt 2):433–437. 23. Kirov II, Patil V, Babb JS, et al. MR spectroscopy indicates diffuse multiple sclerosis activity during remission. J Neurol Neurosurg Psychiatry. 2009;80:1330–1336. 24. Bogner W, Gruber S, Trattnig S, et al. High-resolution mapping of human brain metabolites by free induction decay (1)H MRSI at 7 T. NMR Biomed. 2012;25:873–882. 25. Hangel G, Strasser B, Považan M, et al. Ultra-high resolution brain metabolite mapping at 7 T by short-TR Hadamard-encoded FID-MRSI. Neuroimage. 2018;168:199–210. 26. Gruber S, Heckova E, Strasser B, et al. Mapping an extended neurochemical profile at 3 and 7 T using accelerated high-resolution proton magnetic resonance spectroscopic imaging. Invest Radiol. 2017;52:631–639. 27. Heckova E, Strasser B, Hangel GJ, et al. 7 T magnetic resonance spectroscopic imaging in multiple sclerosis: how does spatial resolution affect the detectability of metabolic changes in brain lesions?Invest Radiol. 2019;54:247–254. 28. Heckova E, Dal-Bianco A, Strasser B, et al. Extensive brain pathologic alterations detected with 7.0-T MR spectroscopic imaging associated with disability in multiple sclerosis. Radiology. 2022;303:141–150. 29. Hametner S, Dal Bianco A, Trattnig S, et al. Iron related changes in MS lesions and their validity to characterize MS lesion types and dynamics with ultra-high field magnetic resonance imaging. Brain Pathol. 2018;28:743–749. 30. Dal-Bianco A, Grabner G, Kronnerwetter C, et al. Slow expansion of multiple sclerosis iron rim lesions: pathology and 7 T magnetic resonance imaging. Acta Neuropathol. 2017;133:25–42. 31. Absinta M, Dal-Bianco A. Slowly expanding lesions are a marker of progressive MS—yes. Mult Scler J. 2021;27:1679–1681. 32. Polman CH, Reingold SC, Banwell B, et al. Diagnostic criteria for multiple sclerosis: 2010 revisions to the McDonald criteria. Ann Neurol. 2011;69:292–302. 33. Marques JP, Kober T, Krueger G, et al. MP2RAGE, a self bias-field corrected sequence for improved segmentation and T1-mapping at high field. Neuroimage. 2010;49:1271–1281. 34. Strasser B, Považan M, Hangel G, et al. (2 + 1)D-CAIPIRINHA accelerated MR spectroscopic imaging of the brain at 7T. Magn Reson Med. 2017;78:429–440. 35. Kreis R, Boer V, Choi IY, et al. Terminology and concepts for the characterization of in vivo MR spectroscopy methods and MR spectra: background and experts' consensus recommendations. NMR Biomed. 2021;34:e4347. 36. Strasser B, Chmelik M, Robinson SD, et al. Coil combination of multichannel MRSI data at 7 T: MUSICAL. NMR Biomed. 2013;26:1796–1805. 37. Bilgic B, Chatnuntawech I, Fan AP, et al. Fast image reconstruction with L2-regularization. J Magn Reson Imaging. 2014;40:181–191. 38. Naressi A, Couturier C, Devos JM, et al. Java-based graphical user interface for the MRUI quantitation package. MAGMA. 2001;12:141–152. 39. Považan M, Hangel G, Strasser B, et al. Mapping of brain macromolecules and their use for spectral processing of (1)H-MRSI data with an ultra-short acquisition delay at 7 T. Neuroimage. 2015;121:126–135. 40. Lin A, Andronesi O,
留言 (0)