
記住我

We prospectively recruited patients with episodic CH from the Headache Clinic of the Taipei Veterans General Hospital and non-headache healthy controls for comparisons from the community between April 2020 and April 2022. The initial diagnosis of cluster headache was made by headache specialists according to the International Classification of Headache Disorders, 3rd edition (ICHD-3) [19]. We collected the clinical features of CH as well as the CASs in all recruited patients by questionnaires and chart review.
Standard protocol approvals, registrations, and patient consentsThe study protocol was approved by the Institutional Review Board of the Taipei Veterans General Hospital (2020–03-011BC), informed written consent was obtained for all participants (both CH and control groups) in accordance with the Declaration of Helsinki.
Inclusion and exclusion criteria for CH patients and non-headache healthy controlsThe inclusion criteria for CH patients were as follows: 1) patients were diagnosed by headache specialists according to the ICHD-3 diagnostic criteria of episodic CH (3.1.1), 2) age between 20 and 65 years, and 3) patients were able to undergo magnetic resonance imaging (MRI) examinations without contraindications.
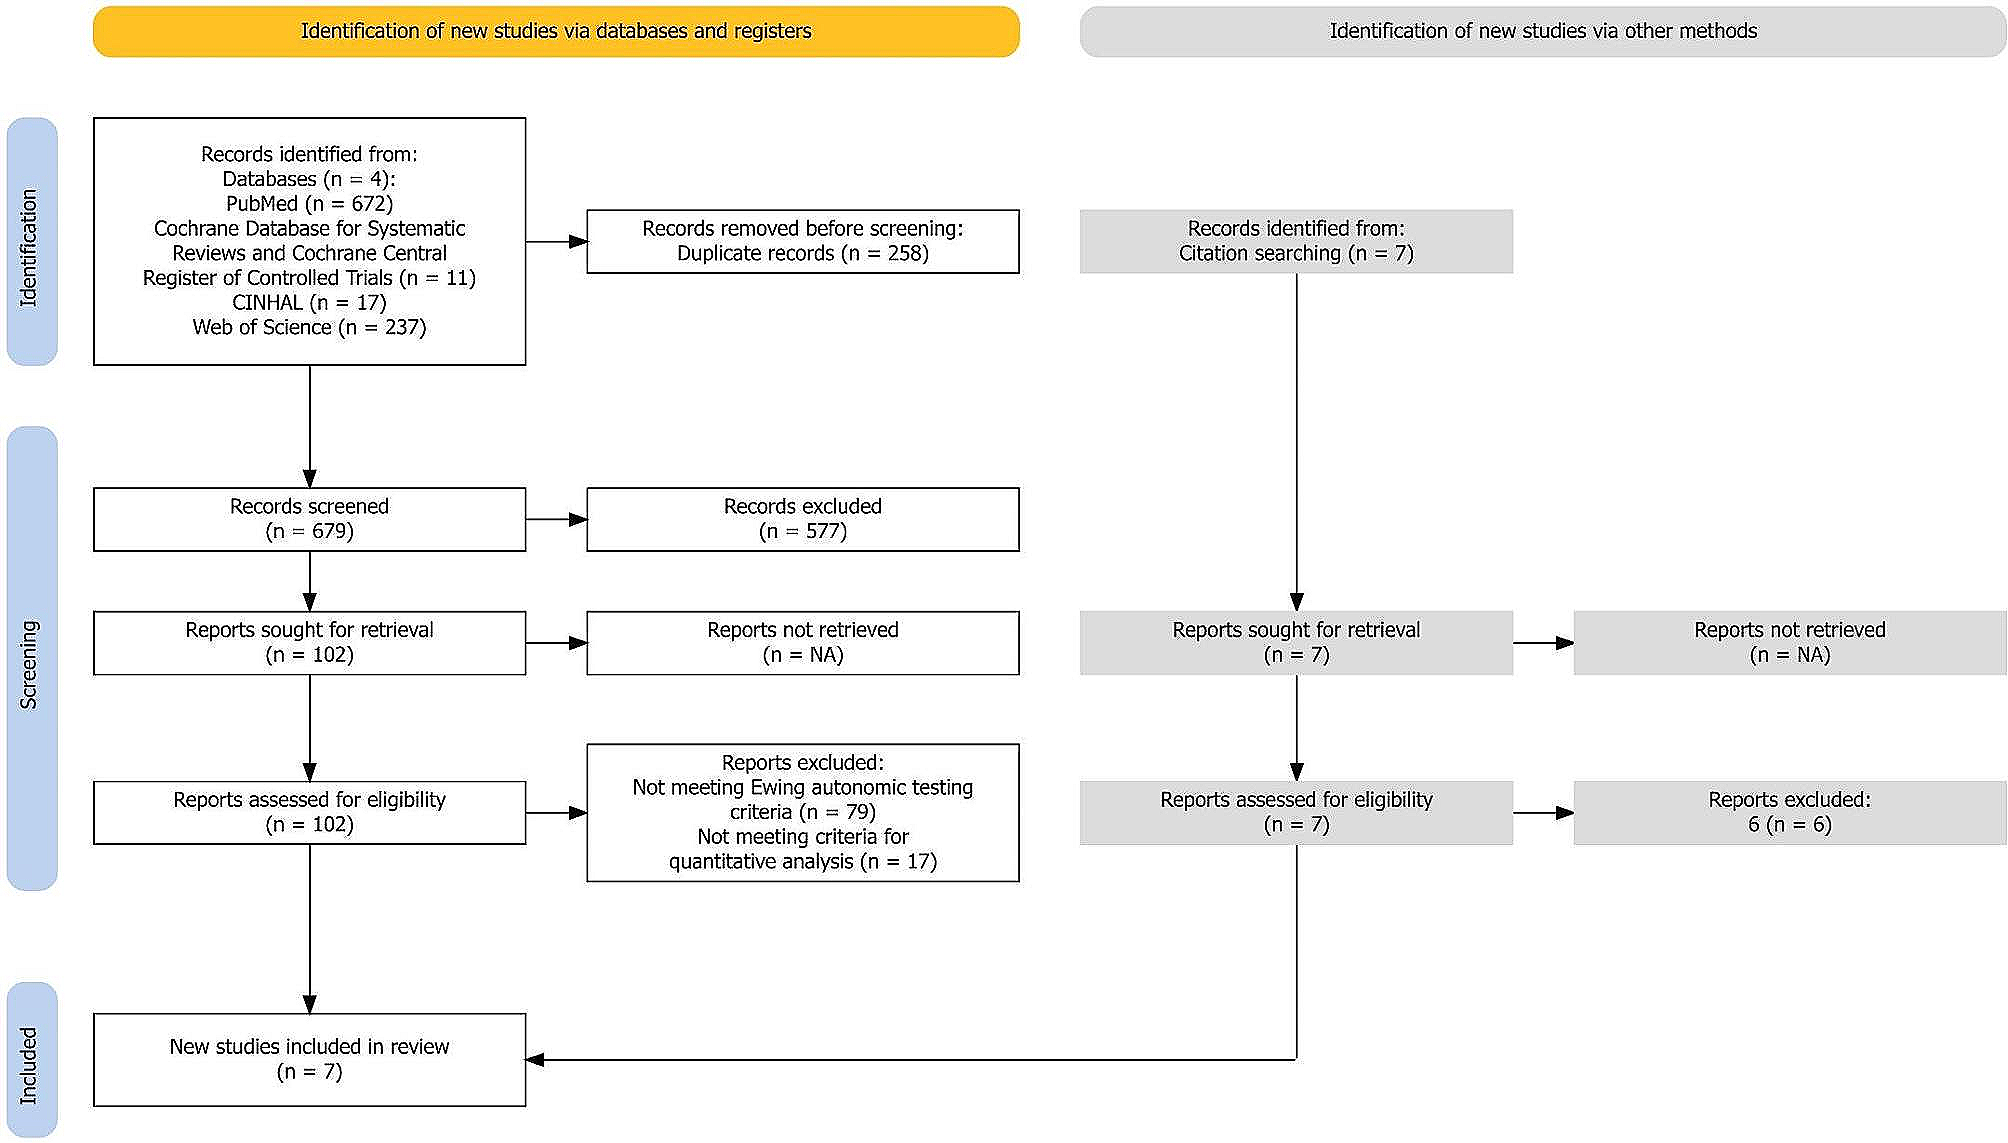
The exclusion criteria for the CH group included the following: 1) CH patients with side-shifting attacks; 2) CH patients with coexistent migraine or tension-type headache ≥ 4 days per month during the out-of-bout period; 3) patients with other secondary headache disorders according to the ICHD-3; 4) Patients with ophthalmic or otolaryngological diseases, 5) patients with history of systemic disorders, including uncontrolled hypertension, diabetes, chronic kidney disease, autoimmune disease, cirrhosis, and malignancy; 6) patients with a history of neurological disorders that may alter the brain structure, such as stroke and neurodegenerative disorders; 7) patients with a history of head or neck malignancies or infection that may alter the paranasal sinus structure; and 8) pregnant or lactating patients (Fig. 1).
Fig. 1
Study schematic flow chart
Control groupNon-headache healthy controls, matched by age and sex, were recruited from the nearby neighborhood or university if they did not have the following: 1) primary or secondary headache diagnoses according to the ICHD-3, 2) ≥ 1 headache episode per month, 3) a history of moderate or severe headaches, and 4–7) any of the above exclusion criteria for patients with CH. All control subjects were interviewed by a neurologist (JWW) to ensure that they did not have other headache disorders.
Cranial autonomic symptomsIn this study, the total number of CASs (ranging from 0 to 5) was calculated based on the ICHD-3 criteria for CH, including 1) lacrimation/conjunctival injection, 2) rhinorrhea/nasal congestion, 3) forehead and facial sweating, 4) miosis and/or ptosis, and 5) eyelid edema [19].
Specialized MR protocol for the SPGAll participants of this study received MR scans on a 1.5 T scanner (Optima™ MR450w GEM, GE Healthcare, United States). Technical parameters for MR scans were as follows: 1) Two-dimensional sagittal T2-weighted images: repetition time (TR)/echo time (TE) = 3138/102 ms, slice thickness = 2 mm, matrix: 320 × 224, field of view (FOV) = 16 cm × 16 cm, number of excitations (NEX) = 6, voxel size 0.5 × 0.714x2 mm. The scanning range of the sagittal T2-weighted images was about 24 mm, focusing on the pterygopalatine fossa, which covered bilateral SPG and vicinity. 2) Two-dimensional axial T2-weighted images: TR/TE = 3973/103 ms, slice thickness = 2 mm, matrix: 320 × 224, FOV = 16 cm × 16 cm, NEX = 6, voxel size 0.5 × 0.714x2 mm. Axial T2-weighted images also focused on the SPG, and the scanning range was about 36 mm. The upper border was the lower margin of the lens, and the lower border was the line tangential to the upper two-thirds of the maxillary sinus [17, 20,21,22]. 3) Two-dimensional axial T1-weighted images: TR/TE = 9.6/3.8 ms, slice thickness = 1 mm, matrix: 288 × 224, FOV = 24 cm × 18 cm, NEX = 1, voxel size 0.83 × 0.8x1 mm. The axial T1-weighted images was performed on the whole brain. 4) Three-dimensional axial and sagittal fast imaging employing steady-state acquisition (FIESTA): TR/TE = 6.5/2.0 ms, slice thickness = 0.8 mm, matrix: 352 × 352, FOV = 22 cm × 22 cm, NEX = 1, voxel size 0.625 × 0.625x0.8 mm. The sagittal FIESTA imaging was performed on the whole brain. All sequence were performed without slice gap [17, 20,21,22]. The total acquisition time of the whole specialized protocol for SPG was 25 min 46 secs.
Both patients and healthy controls received the same protocols, and CH patients underwent head MRI during cluster bouts. To ensure the quality of the MRI images, we performed all MRI studies (CH and control) on the same scanner. We performed routine quality control twice per week to ensure the imaging quality. Moreover, all scans of this study were operated by the same specialized radiologic technologist (TYC). During MRI scanning, our research team, including a radiologic technologist (TYC) and neuroradiologist (STC), were on site to check the imaging quality immediately after the scanning. When the imaging was not qualified, we repeated the scan until the imaging fulfilled the requirements in order to avoid motion artifacts and maintain the signal-to-noise ratio.
MeasurementThe SPG volume was manually measured by two neuroimaging specialists (STC and JWW) blindly and independently by using axial and sagittal FIESTA imaging (SPG diameters: axial and sagittal FIESTA; SPG volumetric: sagittal FIESTA), with the reference of T2-weighted images (axial and sagittal) for localization (Fig. 2). Of note, our picture archiving and communication system (PACS) allows labeling and measuring the same structure synchronously in different neuroimaging sequences. The first step of SPG volumetry was calculating the cross-sectional area of SPG on each image slice by delineating a freehand region of interest around the ganglion via institutional radiology software (SmartPACS, Taiwan Electronic Data Processing Corp.). Then, the whole SPG volume was subsequently calculated as the sum of the cross-sectional area multiplied by the slice thickness. The inter-observer agreement of the SPG volume (both sides of the SPG from CH patients and controls) between the two observers (STC and JWW) was calculated to ensure that the method was reliable. The results of the measurement by the neuroradiologist (STC) with 7 years of experience who specialized in extracranial structures of the head and neck system were used for final analyses. In this study, we also recorded the shape of SPG based on the in vivo morphological classification proposed by Bratbak et al., including round, elongated, and crescent shapes [20].
Fig. 2
Visualization and measurement of the SPG. Axial (a) and sagittal (b) FIESTA MRI, axial (c) and sagittal (d) T2-weighted MRI depicting the sphenopalatine ganglion (SPG) (the red arrow is positioned in the center of the SPG, blue arrow is positioned at the pterygopalatine fossa [PPF]). The SPG has a crescent shape and intermediate signal intensity. The image surrounded by the orange rectangle is the ‘zoomed-in’ image. The light blue polygon depicts the border of the PPF. The oval red line is the border of the SPG. The dark blue line depicts the adjacent structure of PPF. FL cerebral frontal lobe, McS masticator space, MN maxillary nerve, MS maxillary sinus, MT middle nasal turbinate, NC nasal cavity, O orbit, PC palatine canal, PN palatine nerve, PPF pterygopalatine fossa, PP pterygoid process, SPB sphenoid bone, TL temporal lobe, VC vidian canal, VN vidian nerve
StatisticsSPSS version 22.0 (SPSS Inc., Chicago, Illinois, USA) was used in the data analyses. Each rater measured the volume of SPG twice, and we calculated the intra-observer agreements in each rater and the inter-observer agreements between the two raters. For intra-observer arrangements, the intraclass correlation coefficients (ICCs) were computed to assess the agreement in the volumetric measurement of each specialist by using the two-way mixed-effects model estimating absolute agreement. For inter-observer agreement, the ICCs were computed to assess the agreement in the volumetric measurement between two neuroimaging specialists by using the two-way mixed-effects model estimating absolute agreement. According to the magnitude of these parameters, the interpretation was as follows: < 0.20, unacceptable; 0.20–0.40, questionable; 0.41–0.60, good; 0.61–0.80, very good; and 0.81–1.00, excellent [23].
The demographics and clinical profiles of CH patients were expressed as the means and standard deviations (SD) and analyzed by using t tests and chi-square tests as appropriate. The differences in the average bilateral SPG volume and diameter between CH patients and healthy controls were assessed with independent sample t-test, with a significance threshold of p < 0.05. In CH patients, the differences in the SPG volume between the pain and non-pain sides in the same subjects were assessed with paired t-test with a significance threshold of p < 0.05. The associations between the SPG volume (pain side and non-pain side) and the clinical profiles of patients, including CH duration, attack frequency, and attack duration, were exploratory analyses, which were assessed by Pearson correlations with a significance threshold of p < 0.05. The associations between the SPG volume (pain side and non-pain side) and presence of restlessness or agitation were also exploratory analyses, which were assessed by independent sample t-test with a significance threshold of p < 0.05.
留言 (0)